Market overview
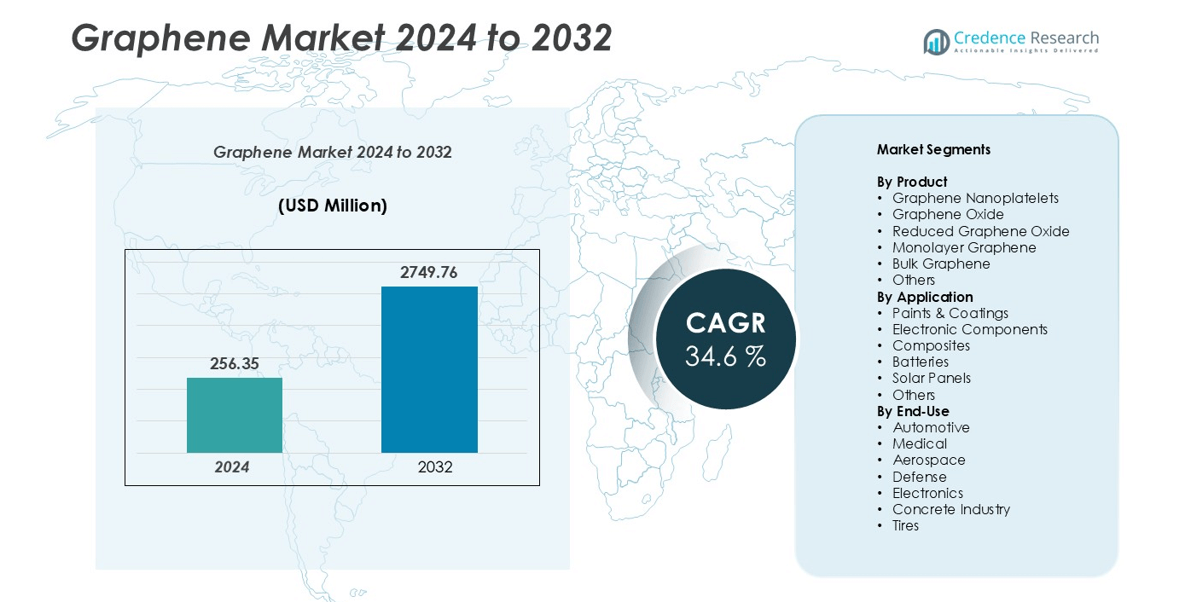
Graphene market size was valued at USD 256.35 million in 2024 and is anticipated to reach USD 2749.76 million by 2032, at a CAGR of 34.6% during the forecast period.
| REPORT ATTRIBUTE |
DETAILS |
| Historical Period |
2020-2023 |
| Base Year |
2024 |
| Forecast Period |
2025-2032 |
| Graphene Market Size 2024 |
USD 256.35 million |
| Graphene Market, CAGR |
34.6% |
| Graphene Market Size 2032 |
USD 2749.76 million |
The global graphene market is led by key players such as Talga Group, GRAPHENE SQUARE INC, Applied Graphene Materials, 2D Carbon Graphene Material Co., Ltd., and Thomas Swan & Co. Ltd., which dominate through strong R&D capabilities and broad product portfolios. These companies focus on large-scale manufacturing, advanced composites, and energy storage applications to cater to rising industrial demand. Asia-Pacific remains the leading region, accounting for approximately 34% of the global market share, driven by significant production capacity and technological advancements in China, Japan, and South Korea. North America and Europe follow, supported by innovation-led ecosystems and expanding industrial applications in electronics, automotive, and aerospace sectors.
Market Insights
- The global graphene market was valued at USD 256.35 million in 2024 and is projected to reach USD 2,749.76 million by 2032, registering a CAGR of 34.6% during the forecast period.
- Market growth is driven by rising demand from the electronics, automotive, and energy storage industries, supported by graphene’s superior electrical conductivity, mechanical strength, and lightweight properties.
- Key trends include increasing adoption in composites, batteries, and flexible electronics, along with advancements in large-scale, cost-efficient production technologies.
- The competitive landscape features major players such as Talga Group, GRAPHENE SQUARE INC, and Applied Graphene Materials, focusing on R&D, partnerships, and capacity expansion; however, high production costs and standardization issues remain key restraints.
- Asia-Pacific leads the market with 34% share, followed by North America (32%) and Europe (27%), while Composites and Graphene Nanoplatelets represent the dominant segments in terms of application and product share, respectively.
Access crucial information at unmatched prices!
Request your sample report today & start making informed decisions powered by Credence Research Inc.!
Download Sample
Market Segmentation Analysis:
By Product
The graphene market by product is dominated by Graphene Nanoplatelets, which hold the largest market share due to their excellent mechanical, thermal, and electrical properties. These nanoplatelets are widely used in composite materials, energy storage devices, and coatings, driving demand across multiple industries. Graphene Oxide and Reduced Graphene Oxide are also gaining traction due to their high surface area and chemical reactivity, making them ideal for sensors, batteries, and functional coatings. The growth of nanotechnology applications and increasing adoption in advanced materials are key drivers fueling expansion in this segment.
- For instance, ACS Material LLC supplies “Single-Layer Graphene Oxide Powder (H Method)” with a lateral size of 0.5–5 µm and an oxygen content of around 35 weight percent, used by research institutions for applications like membrane and sensing technologies.
By Application
Within the application segment, Composites emerge as the dominant sub-segment, accounting for the highest market share. Graphene’s ability to enhance strength, conductivity, and durability in polymer, metal, and ceramic composites has accelerated its adoption in aerospace, automotive, and industrial applications. Batteries and electronic components are also witnessing rapid growth as graphene improves energy density, charge-discharge efficiency, and thermal management. The push for lightweight, high-performance materials and sustainable energy storage solutions continues to drive innovation and adoption across these application areas.
- For instance, Graphene Composites has developed a heat management system that protects vehicles, including ships and high-speed aircraft, from heat damage.
By End-Use
The end-use segment is led by the Automotive industry, where graphene integration in composites, tires, and coatings enhances vehicle performance, fuel efficiency, and durability. Aerospace and electronics are emerging as significant contributors due to increasing demand for lightweight, high-strength, and conductive materials. Medical applications, particularly in sensors and drug delivery, are growing steadily. Key drivers include the rising emphasis on energy efficiency, advanced material adoption, and technological innovations across industries seeking enhanced performance and sustainability, which collectively bolster the graphene market across diverse end-use sectors.
Key Growth Drivers
Rising Demand from Electronics and Energy Storage Industries
The graphene market is witnessing strong growth driven by its increasing adoption in electronics and energy storage applications. Its exceptional electrical conductivity, thermal management capabilities, and high surface area make it ideal for batteries, supercapacitors, sensors, and electronic components. For instance, graphene-based electrodes enhance lithium-ion battery performance by improving charge-discharge efficiency and cycle life, attracting demand from consumer electronics and electric vehicle manufacturers. Additionally, the push for energy-efficient, high-performance materials across renewable energy and industrial sectors accelerates its integration into solar panels, conductive inks, and flexible electronics. These factors collectively boost market demand, with companies focusing on scaling production and developing application-specific graphene products to meet industry requirements.
- For instance, Cerebral Energy is developing a graphene solid-state battery for the U.S. Department of Defense that has demonstrated over three times the energy density of conventional lithium-ion batteries in lab prototypes.
Expansion in Automotive and Aerospace Applications
The automotive and aerospace industries are significant contributors to graphene market growth due to the material’s lightweight, high-strength, and thermal properties. Graphene-reinforced composites improve vehicle fuel efficiency, reduce emissions, and enhance structural integrity, making them attractive for automakers pursuing sustainable solutions. In aerospace, graphene enhances composite performance, contributing to lighter aircraft components with superior strength-to-weight ratios. These applications are further propelled by regulatory pressures to improve energy efficiency and reduce environmental impact. Growing investments in electric vehicles, advanced aircraft, and high-performance transportation technologies continue to expand demand for graphene, encouraging manufacturers to innovate in high-volume production techniques suitable for industrial-scale applications.
- For instance, The Graphene Flagship’s Spearhead Project (GICE), which was led by Airbus and Sonaca, concluded in September 2023. The project successfully advanced the technology readiness of graphene-based de-icing systems to level 6 (TRL6), including prototype demonstration in an icing wind tunnel. This research aims to develop a commercial alternative to chemical de-icers like glycol, which would reduce environmental impact and improve operational efficiency for future aircraft.
Advancements in Production Technologies
Graphene market expansion is strongly supported by technological advancements in scalable and cost-effective production methods. Innovations such as chemical vapor deposition (CVD), liquid-phase exfoliation, and electrochemical synthesis have enabled higher-quality graphene at lower production costs. These advancements address historical challenges related to yield, consistency, and purity, making graphene more accessible for commercial applications. Companies increasingly invest in automated production systems and partnerships to meet growing industrial demand, especially in energy storage, electronics, and coatings. Enhanced production capabilities also drive market adoption by enabling new applications, from flexible electronics to conductive composites, supporting a broadening range of end-use industries while maintaining performance and cost-effectiveness.
Key Trends & Opportunities
Integration into Sustainable and Eco-Friendly Materials
A major trend in the graphene market is its integration into sustainable and eco-friendly materials. Graphene’s ability to reduce material weight, improve efficiency, and enhance durability makes it ideal for green technologies. For instance, graphene-enhanced concrete and coatings reduce energy consumption and increase service life, aligning with global sustainability goals. Companies are exploring bio-based composites and water purification membranes incorporating graphene, presenting new growth avenues. The increasing regulatory focus on environmental sustainability across industries such as construction, automotive, and energy storage further accelerates adoption, providing significant opportunities for market expansion and product differentiation.
- For instance, the incorporation of graphene oxide (GO) into concrete formulations has demonstrated significant improvements in mechanical strength and durability.
Growth of Wearable and Flexible Electronics
Graphene is increasingly adopted in the wearable and flexible electronics sector due to its exceptional conductivity, transparency, and flexibility. Devices such as flexible displays, smart textiles, and biomedical sensors benefit from graphene’s ability to maintain electrical performance under mechanical stress. This trend is driven by rising consumer demand for advanced, lightweight, and multifunctional devices in healthcare, fitness, and consumer electronics. Companies focusing on R&D for printable graphene inks and stretchable electronics are creating new opportunities to expand into next-generation applications, positioning the market for sustained growth.
- For instance, Numerous scientific studies and research papers confirm that graphene-based transparent conductive electrodes (TCEs) have been shown to maintain high electrical conductivity even when subjected to significant mechanical deformation, a property that is highly valuable for wearable electronic devices.
Expansion in Energy Storage Solutions
Graphene’s potential to revolutionize energy storage systems represents a significant market opportunity. It enhances lithium-ion and supercapacitor performance by increasing energy density, cycle life, and charge efficiency. Industrial adoption of graphene-based electrodes in electric vehicles, grid storage, and portable electronics continues to rise. Companies are actively developing hybrid energy storage solutions combining graphene with other nanomaterials to maximize performance. As global energy demand increases and renewable energy integration accelerates, the market sees substantial opportunity for growth, driven by graphene’s ability to support high-performance, long-lasting energy storage solutions.
Key Challenges
High Production Costs and Scalability Issues
Despite growing demand, the graphene market faces challenges related to high production costs and scalability. Techniques like chemical vapor deposition (CVD) and exfoliation produce high-quality graphene but are often expensive and limited in volume, restricting widespread commercial adoption. Manufacturers face difficulties in achieving consistent material quality while scaling production for industrial applications. These cost and scalability barriers can hinder adoption in price-sensitive sectors, particularly in construction, automotive, and consumer goods. Addressing these challenges through process optimization, cost-effective synthesis methods, and strategic partnerships remains critical for market growth.
Standardization and Regulatory Constraints
The graphene market also contends with a lack of standardized quality metrics and regulatory frameworks. Variability in material properties, including thickness, conductivity, and purity, can affect performance and safety across applications. Regulatory uncertainty regarding nanomaterials in medical, food, and consumer products further complicates market entry and compliance. Companies must invest in rigorous quality control, certification processes, and alignment with emerging regulations to ensure safe and consistent graphene integration. The absence of universal standards remains a barrier to large-scale commercialization and wider industry adoption.
Regional Analysis
North America
North America holds a significant share of the global graphene market, accounting for approximately 32% of total revenue. The region’s growth is driven by strong research and development investments, particularly in the United States, where universities and startups are advancing graphene-based technologies for energy storage, electronics, and aerospace applications. The presence of key players and supportive government funding for nanotechnology innovation further strengthen the regional market. Growing demand from electric vehicles, defense, and medical device sectors continues to enhance adoption, positioning North America as a leading hub for graphene commercialization.
Europe
Europe represents around 27% of the global graphene market, supported by robust research infrastructure and growing industrial collaborations. Countries such as the United Kingdom, Germany, and Spain are at the forefront of graphene research and manufacturing, focusing on sustainable production and advanced material integration. The European Union’s funding under initiatives like the Graphene Flagship accelerates innovation in composites, coatings, and electronics. Rising adoption in automotive lightweighting, renewable energy, and aerospace components fuels market expansion. Increasing environmental regulations and focus on green technologies further promote graphene’s use across key European industries.
Asia-Pacific
The Asia-Pacific region dominates the global graphene market with an estimated 34% market share, driven by rapid industrialization and extensive manufacturing activities in China, Japan, and South Korea. China leads in graphene production capacity and patent filings, while Japan and South Korea focus on integrating graphene in electronics and energy storage solutions. Growing demand for high-performance materials in automotive, flexible electronics, and batteries accelerates regional growth. Government-backed nanotechnology programs and expanding collaborations between research institutions and industry players strengthen Asia-Pacific’s position as the largest and fastest-growing graphene market globally.
Latin America
Latin America accounts for approximately 4% of the global graphene market, with Brazil and Mexico emerging as key contributors. The region’s growth is supported by increasing investments in advanced materials research and expanding use of graphene in energy storage and construction sectors. Brazil’s focus on renewable energy and lightweight composites is fostering regional innovation. However, limited production infrastructure and high import dependency constrain market scalability. Ongoing collaborations between universities and private firms are expected to enhance awareness and promote the gradual adoption of graphene technologies across industrial applications in the coming years.
Middle East & Africa
The Middle East & Africa region holds nearly 3% of the global graphene market share, with growing potential in renewable energy and construction applications. The United Arab Emirates and South Africa are leading adopters, focusing on integrating graphene in solar panels, coatings, and water purification systems. Strategic government initiatives promoting sustainable technologies and diversification of industrial sectors are creating new opportunities. However, the market remains in its early development phase due to limited R&D infrastructure and production capabilities. Increasing awareness and partnerships with global graphene producers are expected to drive gradual regional growth.
Market Segmentations:
By Product
- Graphene Nanoplatelets
- Graphene Oxide
- Reduced Graphene Oxide
- Monolayer Graphene
- Bulk Graphene
- Others
By Application
- Paints & Coatings
- Electronic Components
- Composites
- Batteries
- Solar Panels
- Others
By End-Use
- Automotive
- Medical
- Aerospace
- Defense
- Electronics
- Concrete Industry
- Tires
By Geography
- North America
- Europe
- Germany
- France
- U.K.
- Italy
- Spain
- Rest of Europe
- Asia Pacific
- China
- Japan
- India
- South Korea
- South-east Asia
- Rest of Asia Pacific
- Latin America
- Brazil
- Argentina
- Rest of Latin America
- Middle East & Africa
- GCC Countries
- South Africa
- Rest of the Middle East and Africa
Competitive Landscape
The global graphene market is moderately consolidated, with a mix of established players and emerging innovators focusing on large-scale production, material quality, and application diversification. Leading companies such as Talga Group, GRAPHENE SQUARE INC, Applied Graphene Materials, 2D Carbon Graphene Material Co., Ltd., and Thomas Swan & Co. Ltd. are emphasizing research and development to enhance product performance and cost efficiency. Strategic collaborations between manufacturers, research institutions, and end-use industries are driving technological advancements in composites, electronics, and energy storage applications. Companies like Graphene Laboratories, Inc., Graphensic AB, and BGT Materials Limited are expanding their portfolios with tailored graphene solutions for niche sectors. Continuous innovation in production technologies, sustainability-focused product development, and partnerships for commercial-scale deployment define the competitive dynamics. As demand for high-performance materials accelerates across automotive, aerospace, and electronics industries, competition intensifies with firms striving to secure patents, expand capacity, and strengthen global distribution networks.
Shape Your Report to Specific Countries or Regions & Enjoy 30% Off!
Key Player Analysis
- Talga Group
- GRAPHENE SQUARE INC
- Applied Graphene Materials
- 2D Carbon Graphene Material Co., Ltd.
- BGT Materials Limited, Ltd.
- Graphensic AB
- Thomas Swan & Co. Ltd.
- AMO GmbH
- ACS Material
- Graphene Laboratories, Inc.
Recent Developments
- In December 2023, NanoXplore Inc. announced the successful commissioning of two anode material pilot lines, which will help the company achieve sustainable energy storage solutions.
- In July 2022, Thomas Swan signed an agreement with Concrene Ltd. Thomas Swan planned to use graphene nanoplatelets in various concrete dispersion handled by Concrene Ltd. to produce high-compressive strength concrete. The agreement was aimed at expanding the Thomas Swan product application base further on a global scale.
- In June 2022, Graphenea and Grapheal joined forces to quicken the study on biosensors with GraphLAB, a graphene-based product. GraphLAB is a next-gen assessment method for protein disease and screening detection.
- In May 2022, Imkemex (based in Mumbai, India) and Applied Graphene Materials initiated an exclusive distribution agreement. With this new alliance, AGM hopes to directly extend its commercial reach to the liquid resins, coatings, composites, and polymers industries in the region.
Report Coverage
The research report offers an in-depth analysis based on Product, Application, End-Use and Geography. It details leading market players, providing an overview of their business, product offerings, investments, revenue streams, and key applications. Additionally, the report includes insights into the competitive environment, SWOT analysis, current market trends, as well as the primary drivers and constraints. Furthermore, it discusses various factors that have driven market expansion in recent years. The report also explores market dynamics, regulatory scenarios, and technological advancements that are shaping the industry. It assesses the impact of external factors and global economic changes on market growth. Lastly, it provides strategic recommendations for new entrants and established companies to navigate the complexities of the market.
Future Outlook
- The graphene market will experience strong growth driven by expanding applications across electronics, energy storage, and composites.
- Increasing integration of graphene in electric vehicles and renewable energy systems will enhance sustainability and efficiency.
- Advancements in large-scale and low-cost production technologies will make graphene more commercially viable.
- Collaboration between manufacturers and research institutions will accelerate product innovation and industrial adoption.
- The demand for lightweight and high-strength materials in aerospace and automotive sectors will boost graphene usage.
- Growing investment in flexible and wearable electronics will create new market opportunities.
- The medical and healthcare sectors will increasingly adopt graphene for biosensors, drug delivery, and diagnostics.
- Regulatory support for advanced nanomaterials will facilitate wider acceptance across industries.
- Asia-Pacific will continue to dominate production and consumption, supported by strong manufacturing infrastructure.
- Continuous R&D and commercialization efforts will expand graphene’s role as a key material in next-generation technologies.


