Market Overview
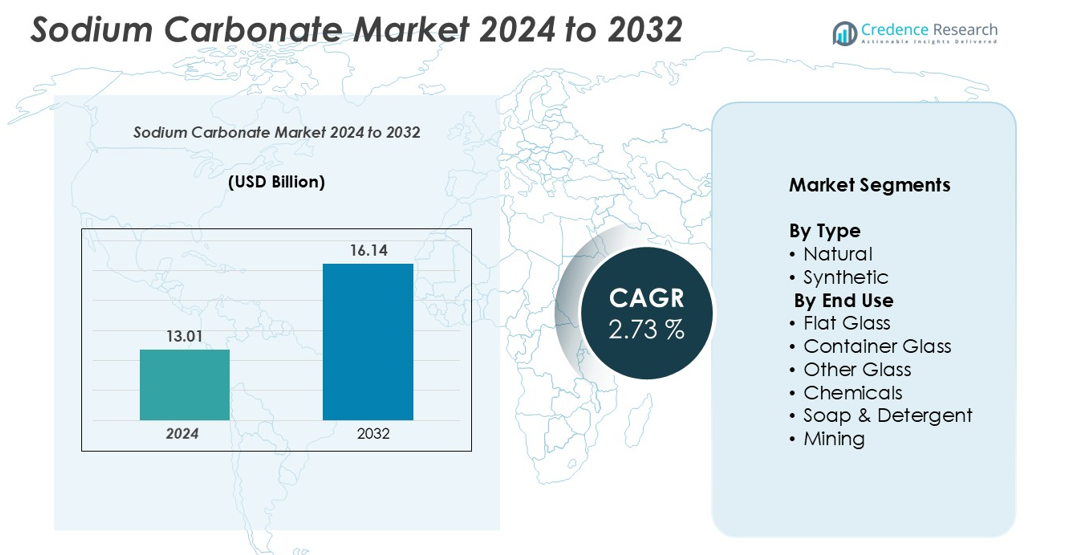
The Sodium Carbonate market size was valued at USD 13.01 billion in 2024 and is anticipated to reach USD 16.14 billion by 2032, at a CAGR of 2.73% during the forecast period.
| REPORT ATTRIBUTE |
DETAILS |
| Historical Period |
2020-2023 |
| Base Year |
2024 |
| Forecast Period |
2025-2032 |
| Sodium Carbonate market Size 2024 |
USD 13.01 billion |
| Sodium Carbonate market, CAGR |
2.73% |
| Sodium Carbonate market Size 2032 |
USD 16.14 billion |
The Sodium Carbonate market is led by major players such as GHCL, Tokuyama Corporation, Shandong Haihua Group, Solvay, Bashkir Soda Company, Tata Chemicals, CIECH SA, Genesis Energy, Keshariya Corporation, and DCW. These companies drive competition through capacity expansion, technological innovation, and sustainable production strategies. Asia Pacific leads the market with a 35% share, supported by strong glass, detergent, and chemical manufacturing bases. North America follows with 28%, benefiting from abundant natural soda ash reserves and cost advantages. Europe holds 23%, driven by advanced glass production and strict environmental standards. These regions collectively shape global market dynamics and supply leadership.
Market Insights
- The Sodium Carbonate market was valued at USD 13.01 billion in 2024 and is expected to reach USD 16.14 billion by 2032, growing at a CAGR of 2.73% during the forecast period.
- Rising demand from flat and container glass production remains the key growth driver, supported by expansion in construction, packaging, and renewable energy sectors.
- Increasing adoption of sustainable production technologies and growing use in solar glass and water treatment are shaping market trends, enhancing competitiveness.
- Strong presence of leading players such as GHCL, Solvay, and Tata Chemicals strengthens competition, while volatility in raw material costs and environmental regulations act as key restraints.
- Asia Pacific leads with a 35% share, followed by North America at 28% and Europe at 23%. Natural soda ash dominates by type, and flat glass holds the largest end-use segment share, driving stable global demand.
Access crucial information at unmatched prices!
Request your sample report today & start making informed decisions powered by Credence Research Inc.!
Download Sample
Market Segmentation Analysis:
By Type
The natural segment dominates the Sodium Carbonate market with a significant market share. Natural soda ash is preferred due to its cost efficiency, lower energy consumption, and reduced environmental impact. This advantage supports high adoption across glass and detergent manufacturing industries. The easy availability of trona deposits in major producing regions also strengthens supply stability. Synthetic soda ash continues to hold a steady share, mainly in areas with limited natural resources. The growing focus on sustainable and energy-efficient production processes further supports the dominance of the natural segment.
- For instance, Tata Chemicals Europe’s UK carbon capture and utilization (CCU) plant captures 40,000 tonnes of carbon dioxide each year, which is used in the manufacturing process for sodium bicarbonate.
By End Use
The flat glass segment holds the largest share among end uses. Flat glass production uses soda ash as a key raw material to reduce melting temperature, lower energy costs, and improve product quality. Demand from construction and automotive industries drives this segment’s strong position. Container glass follows with growing use in packaging for food, beverages, and pharmaceuticals. The increasing shift toward recyclable and durable packaging materials further boosts container glass demand, supporting steady soda ash consumption across these industries.
- For instance, Saint-Gobain operates multiple float glass facilities in the Chennai region. Its most recent addition, a float glass line announced in August 2025 for its Oragadam facility, has a daily melting capacity of 1,000 tons, where soda ash is used to enhance production efficiency and quality control.
Key Growth Drivers
Rising Demand from the Glass Industry
The growing use of flat and container glass is a major driver for the Sodium Carbonate market. Soda ash acts as a key fluxing agent in glass manufacturing, reducing the melting point of silica and cutting energy consumption. Rapid urbanization, infrastructure development, and increasing construction activities support higher demand for flat glass in windows, facades, and solar panels. The packaging industry also drives container glass consumption, particularly for food and beverage products. Additionally, the shift toward sustainable and recyclable packaging materials boosts soda ash demand. The automotive sector further adds momentum as flat glass remains essential in vehicle windshields and windows. Together, these applications strengthen the market’s growth outlook and sustain steady demand across multiple regions.
- For instance, Saint-Gobain’s expanded float glass facility in Oragadam, Chennai, is planned to have a daily capacity of 1,000 tonnes, using soda ash to enhance melt quality and energy efficiency.
Expanding Chemical and Detergent Applications
Sodium carbonate plays a critical role in producing chemicals such as sodium silicate, bicarbonate, and chromate. Its ability to neutralize acids and control pH levels makes it a core raw material in chemical manufacturing. The detergent industry also relies on soda ash for water softening and improving cleaning performance. Rising household income, population growth, and hygiene awareness support detergent consumption globally. Industrial cleaning products further add demand in commercial and institutional settings. The increasing focus on efficient and eco-friendly formulations boosts its use in advanced detergent blends. This growing demand across both household and industrial applications positions the chemical and detergent sectors as key growth pillars for the market.
- For instance, Solvay’s Rheinberg plant produces over 1,500 tons of soda ash daily, supplying major chemical manufacturers. The detergent industry also relies on soda ash to soften water and improve surfactant performance.
Availability of Natural Soda Ash and Cost Advantage
Abundant trona deposits in countries such as the U.S. provide a cost-effective and sustainable source of natural soda ash. Natural production requires less energy compared to synthetic processes, resulting in lower operational costs and reduced carbon emissions. This advantage supports the competitiveness of producers and ensures stable supply for key end-use industries. Many manufacturers are investing in expanding natural soda ash capacities to meet rising demand from glass, chemical, and detergent sectors. Global trade and logistics advancements further enable cost-efficient distribution. As sustainability becomes a central focus in industrial manufacturing, the preference for natural soda ash strengthens, positioning it as a major growth driver for the market over the forecast period.
Key Trends & Opportunities
Shift Toward Sustainable Production
Sustainability is becoming a defining trend in the Sodium Carbonate market. Producers are adopting cleaner technologies, energy-efficient processes, and waste reduction methods to lower environmental impact. This shift aligns with global climate policies and carbon reduction goals. Natural soda ash production, which requires fewer resources, is gaining preference over synthetic alternatives. Companies are also exploring carbon capture solutions and renewable energy integration in production facilities. This transition not only enhances environmental performance but also improves cost efficiency, offering a competitive edge. Rising demand for eco-friendly materials from end-user industries creates new growth opportunities for sustainable soda ash solutions.
- For instance, Ciner Group’s Kazan facility in Turkey operates with an annual capacity of 2.5 million tons, using trona ore extraction and low-energy calcination to minimize CO₂ emissions. Companies are also integrating carbon capture systems and renewable power in manufacturing units.
Rising Adoption in Solar Glass and Water Treatment
The increasing installation of solar panels and renewable energy projects creates new growth avenues for soda ash. Flat glass used in solar panels requires high-purity soda ash for improved clarity and durability. Government investments in solar energy infrastructure support this demand globally. Additionally, soda ash plays a role in water treatment applications, helping regulate pH levels and remove impurities. Rapid urbanization and population growth are increasing the need for clean water and wastewater treatment solutions. This dual demand from renewable energy and water treatment sectors offers significant opportunities for producers to expand into high-growth industries.
- For instance, Xinyi Solar’s production base in Malaysia currently produces 3,100 tons of solar glass daily, relying on soda ash for stable melting and clarity control.
Key Challenges
Volatility in Raw Material and Energy Costs
Fluctuating raw material and energy costs pose a major challenge to the Sodium Carbonate market. Energy-intensive production, especially for synthetic soda ash, increases exposure to price volatility in fuel and power. This directly impacts operating margins for manufacturers. Supply chain disruptions and geopolitical factors can further drive up transportation costs and reduce profit stability. While natural soda ash offers cost advantages, not all regions have access to trona deposits, forcing reliance on costlier synthetic methods. These fluctuations create pricing uncertainty for end-use industries and limit expansion plans for smaller producers. Addressing this challenge requires operational efficiency and strategic sourcing.
Environmental Regulations and Emission Constraints
Tightening environmental regulations regarding CO₂ emissions and industrial waste present significant hurdles for soda ash producers. Synthetic production emits large volumes of greenhouse gases, attracting strict compliance requirements. Adhering to emission norms often involves costly upgrades and technology investments. Non-compliance can lead to penalties, production delays, or restrictions. This regulatory pressure increases operational costs and affects profitability. Producers are investing in cleaner technologies to address these challenges, but transition costs remain high. As global climate policies strengthen, regulatory compliance will continue to be a key factor shaping the market’s competitive landscape and long-term growth strategies.
Regional Analysis
North America
North America holds 28% of the Sodium Carbonate market share, driven by strong demand from the glass, detergent, and chemical industries. The region benefits from abundant trona reserves, making the U.S. a key producer of natural soda ash. This cost advantage enhances the competitiveness of regional manufacturers in global trade. Flat glass demand in the construction and solar energy sectors further boosts market growth. Technological advancements and sustainable production practices strengthen market positioning. The expanding adoption of soda ash in water treatment applications also contributes to stable long-term growth across the region.
Europe
Europe accounts for 23% of the Sodium Carbonate market share, supported by advanced glass manufacturing and chemical processing industries. The region has a mature industrial base, particularly in flat and container glass production. Environmental regulations drive a strong focus on sustainable production and efficient resource use. Demand growth is steady, driven by renewable energy initiatives and water treatment applications. Key markets such as Germany, France, and Italy lead consumption. Technological innovation and process optimization help maintain competitiveness against imports from low-cost producers, sustaining Europe’s strong presence in the global soda ash market.
Asia Pacific
Asia Pacific dominates the global Sodium Carbonate market with a 35% share, led by rapid industrialization and high glass production. China and India drive regional demand through construction, automotive, and packaging sectors. Expanding solar power projects further boost flat glass consumption. The detergent and chemical industries also contribute to growing soda ash use. Competitive production costs and capacity expansions enhance the region’s supply position. Strong domestic demand and export potential support sustained growth. Rising investments in sustainable production technologies strengthen Asia Pacific’s leadership in the global market.
Latin America
Latin America represents 8% of the Sodium Carbonate market share, with growth driven by industrial expansion and increasing detergent consumption. Countries like Brazil and Mexico show rising demand from the construction and packaging industries. Container glass production for beverages plays a significant role in market development. Growing urbanization and infrastructure projects support steady demand for flat glass applications. Limited domestic production leads to higher reliance on imports, creating opportunities for global suppliers. Ongoing industrial modernization is expected to gradually strengthen the region’s market presence and improve supply chain efficiency.
Middle East & Africa
The Middle East & Africa region holds 6% of the Sodium Carbonate market share, supported by expanding construction and industrial activities. Demand is driven by growing use of flat glass in infrastructure and solar energy projects. Detergent and chemical industries are also key consumers in this region. Limited natural soda ash resources lead to import dependency, creating opportunities for global exporters. Strategic investments in infrastructure and renewable energy boost long-term demand potential. Regional governments are focusing on industrial diversification, which supports market expansion and increases the region’s participation in the global soda ash trade.
Shape Your Report to Specific Countries or Regions & Enjoy 30% Off!
Market Segmentations:
By Type
By End Use
- Flat Glass
- Container Glass
- Other Glass
- Chemicals
- Soap & Detergent
- Mining
By Geography
- North America
- Europe
- Germany
- France
- U.K.
- Italy
- Spain
- Rest of Europe
- Asia Pacific
- China
- Japan
- India
- South Korea
- South-east Asia
- Rest of Asia Pacific
- Latin America
- Brazil
- Mexico
- Rest of Latin America
- Middle East & Africa
- GCC Countries
- South Africa
- Rest of Middle East and Africa
Competitive Landscape
The competitive landscape of the Sodium Carbonate market is characterized by strong global and regional players focusing on capacity expansion, cost efficiency, and sustainable production. Leading companies include GHCL, Tokuyama Corporation, Shandong Haihua Group, Solvay, Bashkir Soda Company, Tata Chemicals, CIECH SA, Genesis Energy, Keshariya Corporation, and DCW. These companies strengthen their positions through strategic partnerships, technology upgrades, and global distribution networks. Many producers are shifting toward natural soda ash to reduce energy consumption and emissions, aligning with environmental regulations. Investments in modern production facilities enhance output quality and competitiveness. Market leaders also focus on expanding their presence in high-growth regions like Asia Pacific and the Middle East. Product differentiation, cost leadership, and strong customer relationships remain key competitive factors. The emphasis on sustainability, innovation, and operational excellence continues to shape the competitive dynamics of the global sodium carbonate industry.
Key Player Analysis
Recent Developments
- In February 2024, GHCL, India’s second-largest soda ash producer, is embarking on a greenfield expansion initiative. The company plans to establish a chemical complex to produce light and dense soda ash in Mandvi taluka of Kutch district. With an investment of Rs 4,000 crore, this expansion project signifies GHCL’s commitment to scaling up its manufacturing capabilities and meeting the growing demand for soda ash in the region.
- In December 2023, Solvay Company unveiled the Solvay Process, a cutting-edge technology for soda ash production. It offers remarkable improvements: 50% less CO2 emissions, 20% less energy, water, and salt consumption, and 30% less limestone usage, along with reduced limestone residues
Report Coverage
The research report offers an in-depth analysis based on Type, End-Use and Geography. It details leading market players, providing an overview of their business, product offerings, investments, revenue streams, and key applications. Additionally, the report includes insights into the competitive environment, SWOT analysis, current market trends, as well as the primary drivers and constraints. Furthermore, it discusses various factors that have driven market expansion in recent years. The report also explores market dynamics, regulatory scenarios, and technological advancements that are shaping the industry. It assesses the impact of external factors and global economic changes on market growth. Lastly, it provides strategic recommendations for new entrants and established companies to navigate the complexities of the market.
Future Outlook
- Demand from the glass industry will continue to drive steady market expansion.
- Natural soda ash will gain more share due to cost efficiency and lower emissions.
- Renewable energy growth will increase the use of soda ash in solar glass applications.
- Water treatment applications will emerge as a strong secondary growth area.
- Investments in sustainable production technologies will strengthen global supply chains.
- Asia Pacific will remain the largest and fastest-growing regional market.
- Strategic partnerships and capacity expansions will shape competitive strategies.
- Environmental regulations will accelerate the shift toward cleaner production methods.
- Product innovation will improve quality and support wider industrial applications.
- Global trade flows will expand as producers target emerging high-demand regions.


