
Aquaculture Fertilizer Market Overview:
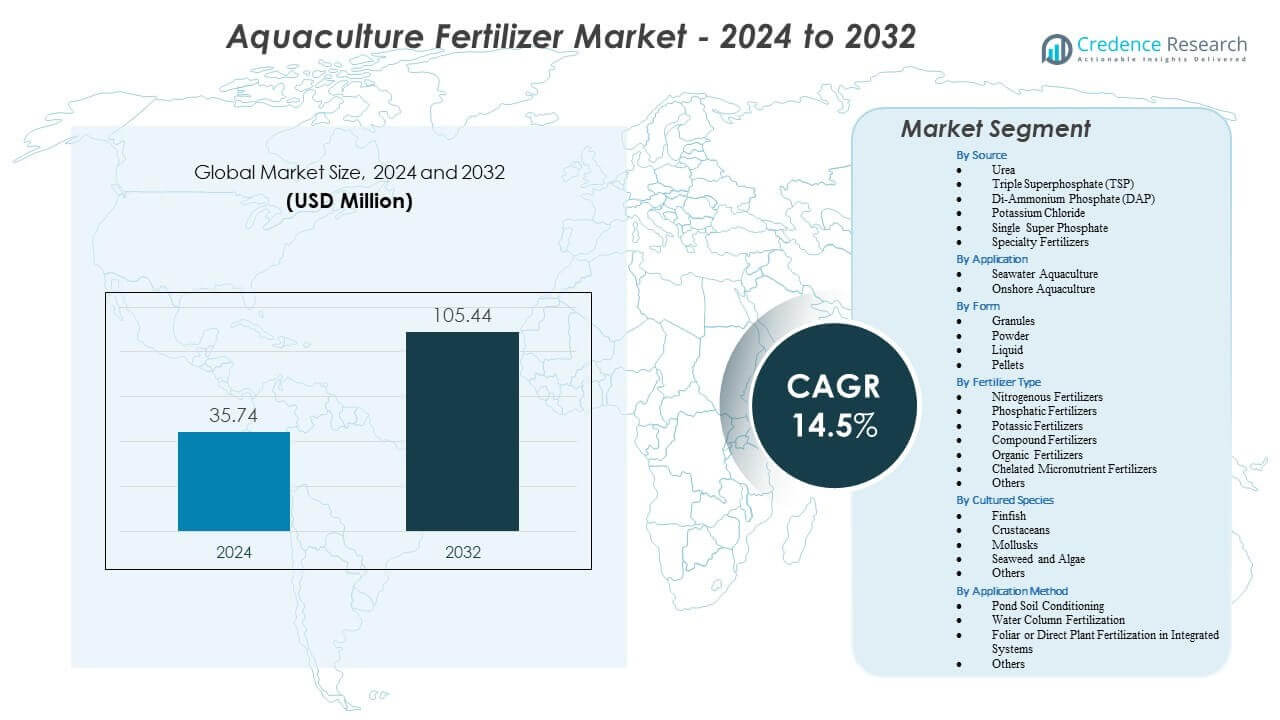
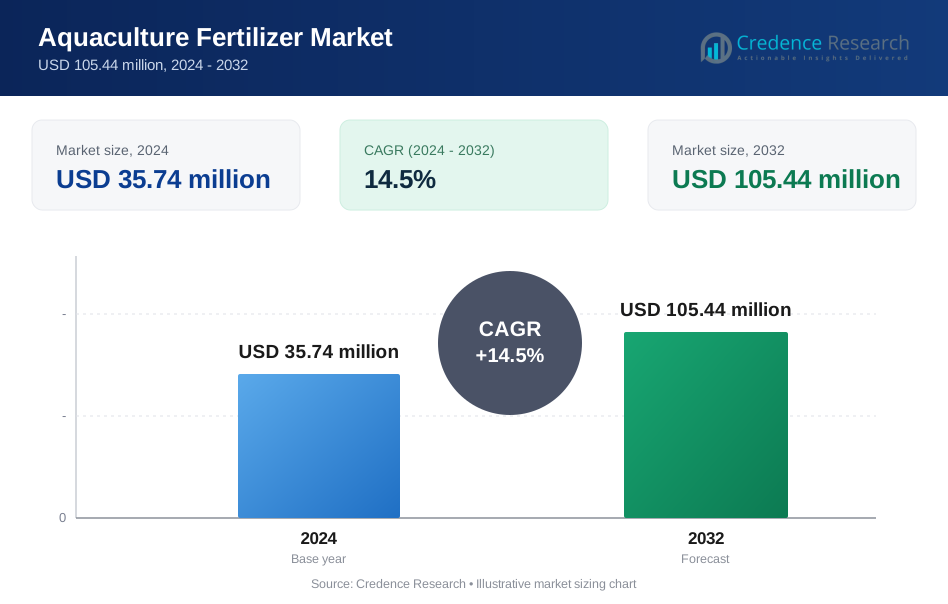
The Aquaculture Fertilizer Market is projected to grow from USD 35.74 million in 2024 to an estimated USD 105.44 million by 2032, with a compound annual growth rate (CAGR) of 14.5% from 2024 to 2032.
| REPORT ATTRIBUTE | DETAILS |
|---|---|
| Historical Period | 2020-2023 |
| Base Year | 2024 |
| Forecast Period | 2025-2032 |
| Aquaculture Fertilizer Market Size 2024 | USD 35.74 million |
| Aquaculture Fertilizer Market, CAGR | 14.5% |
| Aquaculture Fertilizer Market Size 2032 | USD 105.44 million |
Strong market drivers stem from the rising need for controlled nutrient programs that improve productivity and survival rates in fish and shrimp ponds. Farmers adopt water-soluble nutrient blends to support stable algal growth, reduce feed dependency, and maintain suitable pond conditions across growth cycles. Greater awareness of scientific water management encourages farms to monitor nutrient availability more precisely, creating steady demand for standardized formulations. Governments also expand training and advisory programs focused on improving pond fertility, which encourages better nutrient scheduling and more predictable outcomes. These combined dynamics strengthen long-term market expansion.
Regionally, Asia Pacific leads the market due to its dominant aquaculture production base and extensive network of freshwater and marine farms across major producing countries. North America and Europe show consistent growth supported by modern farming practices and a rising interest in controlled onshore systems. Latin America emerges as a fast-developing region driven by expanding shrimp and tilapia production, while parts of Africa gain traction through investments in local aquaculture capacity. Each region advances at a different pace depending on farming intensity, nutrient practices, and industry modernization efforts.
Aquaculture Fertilizer Market Insights:
- The Aquaculture Fertilizer Market is projected to grow from USD 35.74 million in 2024 to USD 105.44 million by 2032, reflecting a 14.5% CAGR driven by rising nutrient management needs in aquaculture.
- Strong market drivers include wider adoption of controlled nutrient programs that improve phytoplankton growth, reduce feed dependence, and stabilize pond conditions in high-density culture systems.
- Market restraints involve limited technical capacity among small-scale farmers, uneven nutrient application, and vulnerability to water-quality fluctuations that reduce fertilizer effectiveness.
- Asia Pacific dominates due to its extensive aquaculture base and structured nutrient practices, while Latin America and Africa show rapid growth linked to expanding shrimp and finfish farms.
- Shifting production models, improved water-management training, and growing demand for stable biological cycles continue to shape regional market demand worldwide.
Aquaculture Fertilizer Market Drivers
Rising Need for Controlled Nutrient Inputs Across Expanding Aquaculture Systems
The Aquaculture Fertilizer Market benefits from the rapid shift toward controlled pond nutrient management. Farmers adopt specialized fertilizers to strengthen phytoplankton growth and improve natural feed cycles. This trend supports higher stocking density without harming water quality. Demand grows in intensive ponds that require stable nutrient profiles. Many producers invest in products that stabilize pH and oxygen levels throughout production cycles. Governments support training programs that highlight the value of balanced nutrient application. The market gains traction in regions where fish and shrimp output rises each year. It helps many farms reduce feed dependency and strengthen crop efficiency.
- For instance, Yara International documents its YaraLiva® calcium nitrate with 15.5% nitrogen and 26.3% calcium, which stabilizes alkalinity and improves water buffering in intensive pond systems.
Increasing Focus on Yield Optimization Through Scientific Water Management Practices
Stronger awareness of modern pond management methods drives wider use of targeted nutrient inputs. The Aquaculture Fertilizer Market benefits from farmers choosing products that improve algal growth patterns and reduce unstable pond conditions. Many producers integrate scientific testing to adjust nutrient schedules more accurately. It helps farms create predictable harvest cycles with lower mortality. Manufacturers introduce blends that support primary productivity in various water types. Better access to advisory services helps smaller farms adopt structured nutrient programs. Farmers also strive to cut variability across batches by improving natural food availability. This shift supports more consistent annual output.
Expansion of Commercial Shrimp and Finfish Farming Operations Worldwide
Rising demand for shrimp and finfish strengthens interest in nutrient enhancement solutions. The Aquaculture Fertilizer Market gains scale as producers expand farm acreage and intensify production systems. Many operations adopt fertilizers that raise plankton levels and maintain steady water clarity. It supports healthy juvenile development and faster growth cycles. Governments promote aquaculture expansion through subsidy schemes and farm modernization projects. Larger farms adopt precise nutrient dosing tools to improve productivity. New investors also encourage standardized practices across regional clusters. These actions accelerate uptake of balanced nutrient inputs.
- For instance, water-quality data from YSI confirms that EXO2 multiparameter sondes detect nitrate, chlorophyll-a, and turbidity with high precision, allowing farms to fine-tune fertilizer dosing before productivity declines.
Growing Move Toward Input Efficiency and Lower Feed Cost Dependency
Producers seek fertilizers that enhance the natural food chain inside ponds. The Aquaculture Fertilizer Market benefits from farms reducing feed budgets by strengthening plankton-based nutrition. Many operators explore micronutrient blends that sustain algae levels for longer periods. It helps farms limit waste and reduce total production expenses. Better nutrient efficiency supports cleaner pond conditions during peak growth phases. Governments promote practices that reduce chemical load while keeping productivity high. Farmers recognize the value of inputs that improve biological cycles. This trend strengthens long-term fertilizer demand across multiple species.
Aquaculture Fertilizer Market Trends
Adoption of Precision Nutrient Management Tools Across Modern Aquaculture Units
Producers shift toward digital tools that support targeted nutrient delivery. The Aquaculture Fertilizer Market grows through wider use of sensors that track dissolved oxygen, turbidity, and nutrient shifts. Many farms apply fertilizers only when data indicates a drop in productive plankton levels. It builds a structured link between pond conditions and nutrient decisions. Cloud-based dashboards help operators standardize nutrient schedules. Adoption of automated mixers reduces uneven dosing. Rising interest in smart farm setups accelerates demand for compatible formulations. This trend improves operational control across varying pond sizes.
- For instance, OTT Hydromet’s HydroMet Cloud allows dashboards to automate nutrient scheduling based on pH, temperature, and chlorophyll-a data, updating every 15 minutes.
Rising Preference for Eco-Friendly and Biologically Derived Fertilizer Formulations
Producers move toward greener inputs that support sustainable pond environments. The Aquaculture Fertilizer Market reflects demand for bio-based nutrient blends with lower environmental stress. Many farms choose mild formulations that encourage healthy algal populations. It strengthens long-term soil and water quality in culture ponds. Manufacturers design products that support balanced nutrient release. Farmers explore organic inputs that align with eco-certification programs. Demand rises in regions promoting clean aquaculture practices. This trend highlights the shift toward long-term environmental resilience.
- For instance, OCP Group documents its soft-rock phosphate product with 10–12% P₂O₅ availability and low cadmium content (<7 ppm), supporting eco-safe pond fertilization.
Integration of Water Quality Monitoring Systems With Nutrient Application Strategies
Aquaculture operators combine monitoring equipment with fertilizer routines to improve consistency. The Aquaculture Fertilizer Market benefits from systems that alert farmers before nutrient decline affects stock growth. Many farms use remote monitoring units for timely adjustments. It supports better alignment between fertilizer type and pond condition. Producers reduce overuse by applying nutrients with more precision. Adoption of digital alarms and calibration tools expands across commercial clusters. Manufacturers create formulations that pair well with automated delivery units. This trend supports improved production stability.
Product Innovation Driven by Species-Specific Nutrient Requirements
Manufacturers release fertilizers designed for particular fish and shrimp species. The Aquaculture Fertilizer Market advances as producers demand inputs tailored to local ecology. Many blends support unique feeding cycles and water behavior patterns. It helps farms achieve better conversion rates without harming pond stability. Product lines now focus on species that dominate regional aquaculture. Research teams design solutions for varying salinity levels and climate zones. Farmers choose products based on species growth targets. This trend strengthens customization in nutrient management.
Aquaculture Fertilizer Market Challenges Analysis
Variability in Water Conditions and Limited Nutrient Knowledge Across Small-Scale Farms
Frequent shifts in pond conditions make nutrient management complex for many operators. The Aquaculture Fertilizer Market must address gaps in farmer understanding of optimal nutrient levels. Many farms struggle to apply fertilizers at the correct intervals. It reduces the consistency of pond productivity throughout cycles. Smaller producers often lack access to testing tools that guide nutrient adjustments. Limited training resources slow adoption of structured nutrient plans. Misapplication of inputs can reduce growth and harm water ecosystems. These issues create operational uncertainty.
Supply Chain Constraints and Price Sensitivity in Developing Aquaculture Regions
Many regions depend on imported nutrient blends that face logistical delays. The Aquaculture Fertilizer Market feels the impact of fluctuating raw material availability. Producers in remote areas face higher transport costs that limit product access. It increases sensitivity to price swings during seasonal peaks. Some farms reduce usage during tight financial periods, which hurts overall productivity. Manufacturers struggle to maintain stable distribution networks in isolated regions. Limited local production capacity increases vulnerability during high-demand seasons. These factors create supply-demand imbalance.
Aquaculture Fertilizer Market Opportunities
Growing Demand for Sustainable Aquaculture Inputs and Traceable Production Methods
Rising consumer interest in responsibly produced seafood creates new openings for eco-friendly inputs. The Aquaculture Fertilizer Market can expand by supporting farms that seek certification. Many producers look for nutrient solutions that improve environmental indicators. It strengthens opportunities for organic and low-impact product lines. Manufacturers can partner with regulators to promote sustainable pond management programs. Demand for traceable nutrient use grows in export-driven markets. Farms that adopt transparent input records gain stronger buyer confidence. These elements build long-term market potential.
Expansion of Intensive Farming Models and Investment in Modern Aquaculture Hubs
The shift toward intensive systems raises the need for controlled nutrient cycles. The Aquaculture Fertilizer Market can benefit from new farms that use advanced monitoring tools. Many investors support the development of well-planned aquaculture parks. It allows manufacturers to supply standardized input packages across large clusters. Growth in shrimp and finfish production increases demand for precision nutrients. Training centers promote structured dosing methods for better growth. Governments encourage integrated farm models that rely on strong nutrient management. These developments expand commercial adoption across regions.
Aquaculture Fertilizer Market Segmentation Analysis:
By Source
The Aquaculture Fertilizer Market benefits from a wide mix of nutrient sources that support varied pond conditions. Urea and DAP hold steady use across intensive units due to their strong nitrogen release. TSP and Single Super Phosphate support primary productivity where phosphorus levels stay low. Potassium-based inputs such as potassium chloride, potassium sulfate, and potassium nitrate help stabilize water quality. MAP gains traction in farms seeking more controlled nutrient delivery. Specialty fertilizers attract interest from producers seeking tailored blends. Other inputs find use in mixed systems where nutrient gaps differ across cycles.
- For instance, Mosaic’s MicroEssentials® (MES) granules contain 12% nitrogen, 40% phosphate, and 10% sulfur, providing uniform phosphorus release in systems with low baseline P₂O₅
By Application
Seawater aquaculture drives steady demand for inputs that maintain plankton growth in variable salinity. The Aquaculture Fertilizer Market also gains support from onshore aquaculture, where controlled pond ecosystems allow precise nutrient scheduling. Many farms adopt structured routines that improve survival rates. It increases reliance on balanced formulations. Growth in land-based units strengthens long-term product uptake.
- For instance, Haifa MKP (0-52-34) is documented to dissolve completely and support higher chlorophyll-a levels in marine ponds.
By Form
Granules support broad adoption due to easy application. Powder forms remain useful in smaller ponds with quick nutrient correction needs. Liquid fertilizers gain adoption in high-density farms seeking fast nutrient dispersion. Pellets serve producers who prefer slow-release options. Each form supports specific operational goals within the sector. The Aquaculture Fertilizer Market benefits from this diversity. It helps farms match product type with water behavior.
By Fertilizer Type
Nitrogenous fertilizers dominate high-intensity systems where natural food production needs strong support. Phosphatic and potassic fertilizers help maintain balanced nutrient cycles. Compound formulations appeal to farms seeking multi-nutrient blends. Organic fertilizers gain attention in regions prioritizing sustainable methods. Chelated micronutrients support ponds with trace element gaps. The Aquaculture Fertilizer Market benefits from this structured variety. It ensures flexibility across climates and species.
By Cultured Species
Finfish farming drives consistent nutrient demand due to higher stocking density. Crustaceans such as shrimp require fertilizers that support stable algal growth. Mollusk units rely on inputs that maintain phytoplankton availability. Seaweed and algae farms seek products that strengthen biomass output. Other species add moderate but stable demand. The Aquaculture Fertilizer Market supports each group through tailored nutrient offerings. It improves overall production outcomes.
By Application Method
Pond soil conditioning prepares the base layer for healthy algae growth cycles. Water column fertilization helps farms maintain productive plankton levels. Foliar or direct plant fertilization supports integrated systems that pair aquaculture with aquatic plant growth. Other methods serve niche setups with unique requirements. The Aquaculture Fertilizer Market adapts to each technique. It strengthens nutrient stability and overall farm performance.
Segmentation:
By Source
- Urea
- Triple Superphosphate (TSP)
- Di-Ammonium Phosphate (DAP)
- Potassium Chloride
- Single Super Phosphate
- Specialty Fertilizers
- Potassium Sulfate
- Potassium Nitrate
- Monoammonium Phosphate (MAP)
- Other Specialty Fertilizers
- Others
By Application
- Seawater Aquaculture
- Onshore Aquaculture
By Form
- Granules
- Powder
- Liquid
- Pellets
By Fertilizer Type
- Nitrogenous Fertilizers
- Phosphatic Fertilizers
- Potassic Fertilizers
- Compound Fertilizers
- Organic Fertilizers
- Chelated Micronutrient Fertilizers
- Others
By Cultured Species
- Finfish
- Crustaceans
- Mollusks
- Seaweed and Algae
- Others
By Application Method
- Pond Soil Conditioning
- Water Column Fertilization
- Foliar or Direct Plant Fertilization in Integrated Systems
- Others
By Region
- North America
- U.S.
- Canada
- Mexico
- Europe
- Germany
- France
- U.K.
- Italy
- Spain
- Rest of Europe
- Asia Pacific
- China
- Japan
- India
- South Korea
- South-east Asia
- Rest of Asia Pacific
- Latin America
- Brazil
- Argentina
- Rest of Latin America
- Middle East & Africa
- GCC Countries
- South Africa
- Rest of the Middle East and Africa
Regional Analysis:
The Aquaculture Fertilizer Market records its strongest presence in Asia Pacific, holding nearly 55% of global share due to large-scale production in China, India, Vietnam, and Indonesia. Farmers in the region adopt fertilizers that strengthen plankton cycles and support dense stocking units. Government programs encourage nutrient optimization, which increases structured product use. Many producers depend on region-specific nitrogen and phosphorus blends to support variable pond conditions. It gains steady growth in coastal clusters where shrimp farming expands rapidly. Strong infrastructure and high seafood demand maintain the region’s long-term lead.
North America secures roughly 15% of global share and demonstrates consistent demand driven by advanced aquaculture systems. Producers in the U.S. and Canada use fertilizers that meet strict quality controls and support high-value species. Many farms integrate precision nutrient tools that guide dosing decisions. It benefits from strong investments in land-based and recirculating systems. Manufacturers supply controlled-release formulations to help stabilize water conditions across seasons. The region’s regulatory environment supports sustained movement toward efficient nutrient inputs.
Europe holds close to 12% share and shows rising interest in sustainable fertilizer use across marine and onshore units. Producers focus on eco-friendly inputs that support balanced algae growth and lower nutrient discharge. Many operators adopt integrated methods that require predictable nutrient release. It benefits from research programs that highlight optimal balance across nitrogen, phosphorus, and potassium. Latin America captures about 10% share through strong shrimp and tilapia production, while the Middle East & Africa account for 8% as countries strengthen domestic aquaculture capacity. Each emerging region develops consistent demand through farm expansion and improving pond management.
Key Player Analysis:
- Yara International ASA
- Nutrien Ltd.
- The Mosaic Company
- URALCHEM JSC
- Sinofert Holdings Limited
- Koch Industries, Inc.
- OCP S.A.
- ICL Group Ltd.
- Luxi Chemical Group Co. Ltd.
- Saudi Basic Industries Corporation (SABIC)
- CF Industries Holdings, Inc.
- Haifa Group
Competitive Analysis:
The Aquaculture Fertilizer Market shows strong competition driven by fertilizer giants with established networks and advanced nutrient technologies. Global leaders invest in product innovation that supports consistent productivity across freshwater and marine systems. Many players focus on balanced nutrient blends that improve phytoplankton density and support sustainable water conditions. It encourages firms to differentiate through controlled-release formulations, precision dosing tools, and species-specific solutions. Companies increase competitiveness by partnering with aquaculture farms to improve field-level nutrient practices. Regional producers strengthen their presence with cost-effective formulations matched to local pond conditions. Global suppliers leverage scale advantages, while niche companies grow through specialized micronutrient products. Competition remains steady across regions as farms demand reliable nutrient performance and predictable growth outcomes.
Recent Developments:
- In May 2025, Tosoh Corporation partnered with local aquaculture cooperatives in Japan to provide trace-element-enriched fertilizers. The initiative supports sustainable seafood production and improves water quality in intensive aquaculture systems.
- In December 2024, ICAR-CIBA established a partnership with Agrocel Industries through a memorandum of understanding to evaluate AQUALAABH, a mineral mix derived from seawater. The research aims to improve productivity and sustainability in shrimp farming operations.
Report Coverage:
The research report offers an in-depth analysis based on Source, Application, Form, Fertilizer Type, Cultured Species, Application Method, and Region. It details leading market players, providing an overview of their business, product offerings, investments, revenue streams, and key applications. Additionally, the report includes insights into the competitive environment, SWOT analysis, current market trends, as well as the primary drivers and constraints. Furthermore, it discusses various factors that have driven market expansion in recent years. The report also explores market dynamics, regulatory scenarios, and technological advancements that are shaping the industry. It assesses the impact of external factors and global economic changes on market growth. Lastly, it provides strategic recommendations for new entrants and established companies to navigate the complexities of the market.
Future Outlook:
- Growing movement toward intensive aquaculture will lift demand for balanced nutrient formulations across diverse farming systems.
- Wider use of precision tools will push producers to rely on data-driven nutrient routines that improve pond productivity.
- Expansion of shrimp and finfish farming will increase the need for controlled nutrient delivery across coastal and inland clusters.
- Rising focus on sustainable inputs will strengthen interest in organic and low-impact fertilizer blends across multiple regions.
- Integration of sensors with fertilizer scheduling will help farms use nutrients more efficiently and maintain steady biological cycles.
- Growth in onshore systems will encourage adoption of fast-dispersing formulations suited for closed and semi-closed environments.
- Research into species-specific nutrient needs will guide manufacturers toward more specialized and targeted product lines.
- Expansion of aquaculture parks will create opportunities for standardized nutrient programs supported by technical advisory services.
- Increased demand for traceable production methods will support fertilizers that align with certification-driven farming models.
- Strengthening government support for aquaculture development will enable broader training on nutrient optimization and water stability.
Request a Free Sample
Fill in your details and we'll send you a free sample report.
- Sample data tables & charts
- Research methodology
Need a Custom Version of This Report?
Tailor the scope, geography, or segments to your exact requirements.
- Custom geography or segment scope
- Direct access to our analyst team
Frequently Asked Questions
What is the current market size for the Aquaculture Fertilizer Market, and what is its projected size in 2032?
At what Compound Annual Growth Rate is the Aquaculture Fertilizer Market projected to grow between 2024 and 2032?
Which Aquaculture Fertilizer Market segment held the largest share in 2024?
What are the primary factors fueling the growth of the Aquaculture Fertilizer Market?
Who are the leading companies in the Aquaculture Fertilizer Market?
Which region commanded the largest share of the Aquaculture Fertilizer Market in 2024?
Table of Content
Chapter 1. Report Introduction
- 1.1 Report Description & Purpose
- 1.1.1 Report Title & Market Definition
- 1.1.2 Unique Selling Propositions (USP) & Key Differentiators
- 1.1.3 Value Proposition for Stakeholders
- 1.2 Research Objectives
- 1.2.1 Market Sizing Objectives (Volume & Revenue)
- 1.2.2 Segmentation Objectives
- 1.2.3 Competitive Intelligence Objectives
- 1.2.4 Forecast & Scenario Objectives
- 1.3 Report Scope
- 1.3.1 Aquaculture Fertilizer Scope – Types & Subtypes Covered
- 1.3.2 Geographic Scope – Regions & Countries Covered
- 1.3.3 Historical Period, Base Year & Forecast Period (2024; forecast to 2032)
- 1.3.4 Inclusions & Exclusions
- 1.4 HS Code & Classification Framework
- 1.5 Currency, Units & Pricing Basis
- 1.6 Target Stakeholders
- 1.7 Limitations & Assumptions
Chapter 2. Executive Summary
- 2.1 Global Aquaculture Fertilizer Market Snapshot
- 2.1.1 Market Size – Historical (2024) & Forecast (2024-2032) (2024: USD 35.74 million → 2032: USD 105.44 million)
- 2.1.2 Volume & Revenue – Global Totals
- 2.1.3 Key Market Highlights – Top Five Facts
- 2.2 Aquaculture Fertilizer Market Segmentation Snapshot
- 2.2.1 Market Split by Region – 2024 vs. 2032
- 2.3 Competitive Snapshot
- 2.3.1 Top 10 Players by Revenue Share – 2024
- 2.3.2 Top 10 Players by Volume Share – 2024
- 2.3.3 Recent Strategic Developments (18-Month Summary)
- 2.4 Key Investment Highlights & Strategic Conclusions
Chapter 3. Aquaculture Fertilizer Market Dynamics & Industry Analysis
- 3.1 Market Overview & Context
- 3.1.1 Aquaculture Fertilizer Market Position in the Broader Automotive Value Chain
- 3.1.2 OEM vs. Replacement Market Dynamics
- 3.1.3 Market Maturity & Development Stage by Region
- 3.2 Aquaculture Fertilizer Market Drivers
- 3.3 Aquaculture Fertilizer Market Restraints & Challenges
- 3.4 Aquaculture Fertilizer Market Opportunities
- 3.5 Porter's Five Forces Analysis
- 3.5.1 Threat of New Entrants
- 3.5.2 Bargaining Power of Suppliers
- 3.5.3 Bargaining Power of Buyers
- 3.5.4 Threat of Substitutes
- 3.5.5 Competitive Rivalry – Intensity Assessment
- 3.6 Aquaculture Fertilizer Value Chain Analysis
- 3.6.1 Upstream – Raw Material/Input Suppliers
- 3.6.1.1 Raw Material/Input 1
- 3.6.1.2 Raw Material/Input 2
- 3.6.1.3 Raw Material/Input 3
- 3.6.2 Midstream – Production/Manufacturing/Service Delivery
- 3.6.2.1 Production/Process Overview
- 3.6.2.2 Key Facility Locations & Capacity by Manufacturer
- 3.6.3 Downstream – Distribution & End Consumer
- 3.6.3.1 Primary Channel – B2B/OEM
- 3.6.3.2 Secondary Channels – Dealer, Retail, Online, Direct
- 3.6.4 Value Chain Profitability Analysis
- 3.6.1 Upstream – Raw Material/Input Suppliers
- 3.7 PESTEL Analysis
- 3.7.1 Political Factors
- 3.7.2 Economic Factors
- 3.7.3 Social Factors
- 3.7.4 Technological Factors
- 3.7.5 Environmental Factors
- 3.7.6 Legal Factors
- 3.8 Aquaculture Fertilizer Supply Chain Analysis
- 3.8.1 Raw Material/Input Supply Risk Assessment
- 3.8.2 Manufacturing Concentration Risk (Geographic Exposure)
- 3.8.3 Trade Disruption Impact Analysis
- 3.9 Regulatory & Policy Landscape
Note: The regulatory and policy landscape section covers regulations based on their applicability to the market, Aquaculture Fertilizer category, geography, and scope of the study. Only regulatory frameworks with a material impact on operations, compliance, trade, sustainability, or market access are analyzed in detail.
Chapter 4. Key Investment Pockets & Opportunity Analysis
- 4.1 Aquaculture Fertilizer Market Attractiveness Analysis
- 4.1.1 By Region – Investment Attractiveness Matrix (Volume × CAGR)
- 4.2 Absolute Revenue Growth Opportunity
- 4.2.1 By Region – Absolute USD Growth Through 2032
- 4.3 Incremental Volume Opportunity
- 4.3.1 By Region – Incremental Volume Through 2032
- 4.3.2 Segment – Incremental Volume
- 4.4 Emerging Submarket Opportunity Deep Dive (Subject to Applicability)
- 4.5 Emerging Market Opportunity Scorecards
- 4.5.1 United States
- 4.5.2 Europe
- 4.5.3 Asia
- 4.5.4 Middle East & Africa
Note: Emerging Market Opportunity Scorecards will be included based on relevance and strategic importance. Regions listed are indicative and may vary depending on data availability and market dynamics.
Chapter 5. Aquaculture Fertilizer Import-Export Analysis & Trade Flows
- 5.1 Global Trade Overview
- 5.1.1 Global Export Value by Country (2024)
- 5.1.2 Global Export Volume by Country (2024)
- 5.1.3 Global Import Value by Country (2024)
- 5.1.4 Global Import Volume by Country (2024)
- 5.1.5 Net Trade Balance by Country (2024)
- 5.2 Export Analysis – Segment
- 5.2.1 Type 1 (HS Code)
- 5.2.2 Type 2 (HS Code)
- 5.2.3 Type 3 (HS Code)
- 5.2.4 Type 4 (HS Code)
- 5.2.5 Type 5 (HS Code)
- 5.3 Import Analysis – Segment
- 5.3.1 Type 1 (HS Code)
- 5.3.2 Type 2 (HS Code)
- 5.3.3 Type 3 (HS Code)
- 5.3.4 Type 4 (HS Code)
- 5.3.5 Type 5 (HS Code)
- 5.4 Average Unit Trade Prices
- 5.4.1 Average Export Price – Segment & Country
- 5.4.2 Average Import Price – Segment & Source Country
- 5.4.3 Price Trends (2024)
- 5.5 Key Trade Route Analysis
- 5.5.1 Trade Route 1
- 5.5.2 Trade Route 2
- 5.5.3 Trade Route 3
- 5.5.4 Trade Route 4
- 5.5.5 Trade Route 5
- 5.6 Trade Policy Impact Assessment
- 5.6.1 US Anti-Dumping & Section 301 Tariffs
- 5.6.2 EU Customs Union Impact
- 5.6.3 Major Free Trade Agreements
- 5.6.4 USMCA Rules of Origin
Note: Trade policy analysis will be included only where relevant to the Aquaculture Fertilizer market.
Chapter 6. Competitive Landscape & Company Benchmarking
- 6.1 Aquaculture Fertilizer Market Concentration & Structure
- 6.1.1 Herfindahl-Hirschman Index (HHI) – vs. 2024
- 6.1.2 Tier 1, Tier 2 & Tier 3 Market Structure
- 6.1.3 Global, Regional & Local Player Dynamics
- 6.2 Aquaculture Fertilizer Market Share Analysis – 2024
- 6.2.1 Global Revenue Share by Company
- 6.2.2 Global Volume Share by Company
- 6.2.3 Regional Revenue Share
- 6.2.4 Market Share Evolution ( vs. 2024)
- 6.2.5 OEM Segment Share by Company
- 6.2.6 Replacement Segment Share by Company
- 6.3 Production/Delivery Capacity & Facility Analysis
- 6.3.1 Global Installed Capacity
- 6.3.2 Capacity Utilization Rates
- 6.3.3 Production/Output Volume
- 6.3.4 Facility Locations & Capacity Map
- 6.3.5 Planned Capacity Additions
- 6.4 Aquaculture Fertilizer Competitive Benchmarking Matrix
- 6.4.1 Revenue, Volume, CAGR & Profitability Comparison
- 6.4.2 Channel Revenue Mix
- 6.4.3 Geographic Revenue Exposure
- 6.4.4 R&D Intensity
- 6.4.5 Sustainability Maturity
- 6.5 Strategic Developments in Aquaculture Fertilizer (Last 24 Months)
- 6.5.1 Mergers, Acquisitions & Divestments
- 6.5.2 New Aquaculture Fertilizer Launches
- 6.5.3 Facility Expansions
- 6.5.4 Strategic Alliances, Joint Ventures & Partnerships
- 6.5.5 Distribution Expansion & Market Entry
- 6.5.6 Sustainability & ESG Initiatives
- 6.6 Competitive Strategy Mapping
- 6.6.1 Leader, Challenger, Follower & Niche Classification
- 6.6.2 Pricing Strategy Comparison
- 6.6.3 Channel Strategy Matrix
Note: Strategic developments are included based on their materiality and the availability of reliable information.
Chapter 7. Global Aquaculture Fertilizer Market – By Distribution Channel
- 7.1 Segment Overview
- 7.1.1 Volume & Revenue Split by Channel (2024 & 2032)
- 7.1.2 Channel Mix Evolution (2024-2032)
Chapter 8. Regional Market Analysis – Global Overview
- 8.1 Global Regional Overview
- 8.1.1 Regional Volume Share
- 8.1.2 Regional Revenue Share
- 8.1.3 Regional Volume by Region
- 8.1.4 Regional Revenue by Region
- 8.1.5 Regional Forecast Through 2032
- 8.2 Cross-Regional Segment Analysis
- 8.2.1 By Distribution Channel
- 8.2.2 By Brand/Price Tier
Chapter 9. North America Aquaculture Fertilizer Market
- 9.1 United States
- 9.2 Canada
- 9.3 Mexico
Chapter 10. Europe Aquaculture Fertilizer Market
- 10.1 Germany
- 10.2 France
- 10.3 Italy
- 10.4 United Kingdom
- 10.5 Spain
- 10.6 Poland
- 10.7 Russia
- 10.8 Netherlands
- 10.9 Belgium
- 10.10 Sweden
- 10.11 Denmark
- 10.12 Norway
- 10.13 Rest of Europe
Chapter 11. Asia Pacific Aquaculture Fertilizer Market
- 11.1 China
- 11.2 India
- 11.3 Japan
- 11.4 South Korea
- 11.5 Thailand
- 11.6 Indonesia
- 11.7 Vietnam
- 11.8 Malaysia
- 11.9 Australia
- 11.10 Rest of Asia Pacific
Chapter 12. Latin America Aquaculture Fertilizer Market
- 12.1 Brazil
- 12.2 Argentina
- 12.3 Colombia
- 12.4 Chile
- 12.5 Rest of Latin America
Chapter 13. Middle East Aquaculture Fertilizer Market
- 13.1 Saudi Arabia
- 13.2 United Arab Emirates
- 13.3 Turkey
- 13.4 Israel
- 13.5 Iran
- 13.6 Rest of the Middle East
Chapter 14. Africa Aquaculture Fertilizer Market
- 14.1 South Africa
- 14.2 Egypt
- 14.3 Nigeria
- 14.4 Morocco
- 14.5 Rest of Africa
Chapter 15. Aquaculture Fertilizer Company Profiles
- 15.1 [Company 01]
- 15.1.1 Company Overview
- 15.1.2 Key Management Personnel
- 15.1.3 Products & Services Portfolio
- 15.1.4 Financial Performance
- 15.1.5 Key Market Focus & Geographic Presence
- 15.1.6 Recent Developments & Strategic Initiatives
Note: The company profile list is preliminary and may change based on research findings, market developments, data availability, and client requirements.
Chapter 16. Appendices
- Appendix A – List of Abbreviations & Acronyms
- Appendix B – Industry Classification Code Reference – Full Series
- Appendix C – Production & Capacity Data Tables
- Appendix D – End-Use & Demand Base Tables
- Appendix E – Consumption & Replacement Rate Assumptions
- Appendix F – ASP Reference Tables
- Appendix G – Manufacturing & Facility Database
- Appendix H – Import-Export Data Tables
- Appendix I – Regulatory Summary Tables
- Appendix J – Primary Research Participant List (Anonymized)
- Appendix K – Primary Research Questionnaire Framework
- Appendix L – Data Sources & Bibliography
- Appendix M – Market Size Divergence & Source Comparison
Chapter 17. Research Methodology
- 17.1 Research Framework & Philosophy
- 17.2 Secondary Research – Sources, Hierarchy & Data Extraction
- 17.3 Data Modeling – Bottom-Up & Top-Down Market Sizing
- 17.4 Primary Research – Stakeholder Framework, LOI & Sample Sizes
- 17.5 Forecast Methodology – Regression, Scenario & Sensitivity Analysis
- 17.6 Quality Control – Four-Layer Validation Framework
- 17.7 Limitations & Standard Assumptions
- 17.8 Disclaimer
