
Market Overview
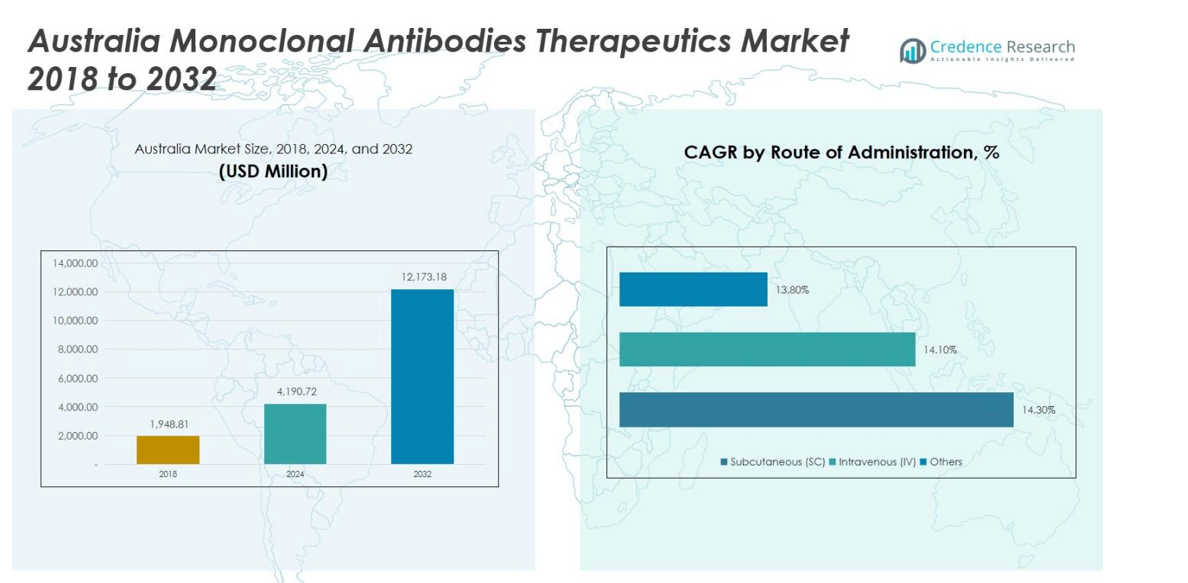
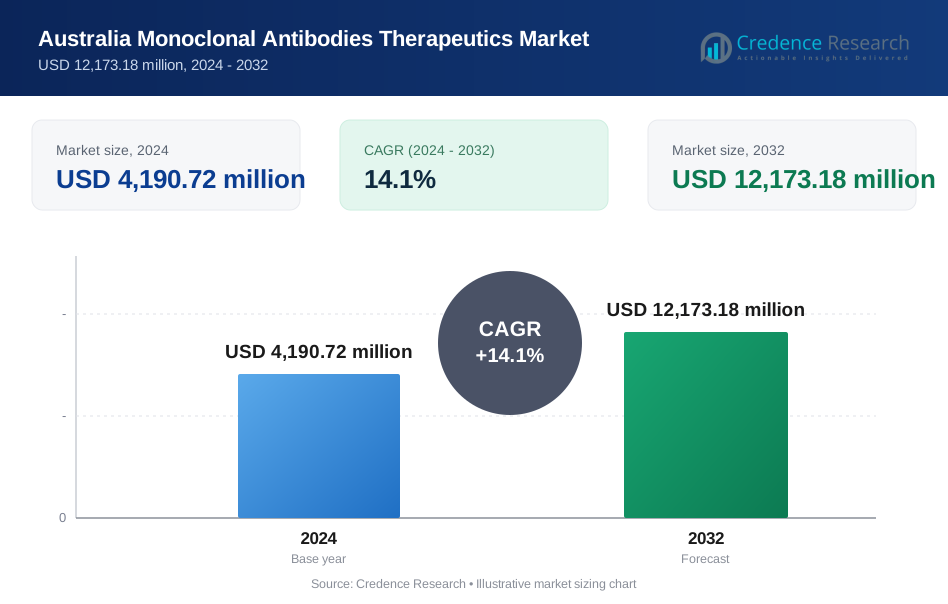
Australia Monoclonal Antibodies Therapeutics Market size was valued at USD 1,948.81 million in 2018, is expected to reach USD 4,190.72 million in 2024, and is anticipated to reach USD 12,173.18 million by 2032, growing at a CAGR of 14.1% during the forecast period.
| REPORT ATTRIBUTE | DETAILS |
|---|---|
| Historical Period | 2020-2023 |
| Base Year | 2024 |
| Forecast Period | 2025-2032 |
| Australia Monoclonal Antibodies Therapeutics Market Size 2024 | USD 4,190.72 million |
| Australia Monoclonal Antibodies Therapeutics Market, CAGR | 14.1% |
| Australia Monoclonal Antibodies Therapeutics Market Size 2032 | USD 12,173.18 million |
The Australia Monoclonal Antibodies Therapeutics Market is highly competitive, led by key players including F. Hoffmann-La Roche Ltd, AbbVie Inc., Sanofi, Bristol Myers Squibb, Novartis AG, Amgen Inc., AstraZeneca, Eli Lilly and Company, Takeda Pharmaceutical Company Limited, and Johnson & Johnson Services, Inc. These companies drive market growth through innovation, robust product portfolios, and strategic collaborations, particularly in oncology and autoimmune therapies. Geographically, New South Wales is the leading region, commanding a market share of 32%, supported by advanced healthcare infrastructure, specialized hospitals, and active clinical research. Victoria follows with 25%, benefiting from early adoption of biologics and strong research institutions. Queensland contributes 18% through expanding healthcare access and growing patient awareness, while Western Australia holds 12%, reflecting increasing uptake of targeted therapies. Together, these regions form the core of Australia’s monoclonal antibodies therapeutics market, enabling sustained growth and innovation.
Market Insights
- The Australia Monoclonal Antibodies Therapeutics Market was valued at USD 4,190.72 million in 2024 and is expected to reach USD 12,173.18 million by 2032, growing at a CAGR of 14.1%.
- Growth is driven by rising prevalence of cancer and autoimmune diseases, increasing adoption of humanized and fully human monoclonal antibodies, and supportive government reimbursement policies.
- Key trends include the growing use of personalized medicine, biomarker-driven targeted therapies, and expansion of home-based and subcutaneous administration for patient convenience.
- The market is highly competitive with major players such as F. Hoffmann-La Roche Ltd, AbbVie Inc., Sanofi, Bristol Myers Squibb, Novartis AG, Amgen Inc., and AstraZeneca focusing on R&D, collaborations, and product innovation.
- Regionally, New South Wales leads with 32% share, followed by Victoria at 25% and Queensland at 18%, while humanized mAbs dominate the sources segment with 55% market share.
Market Segmentation Analysis:
By Sources:
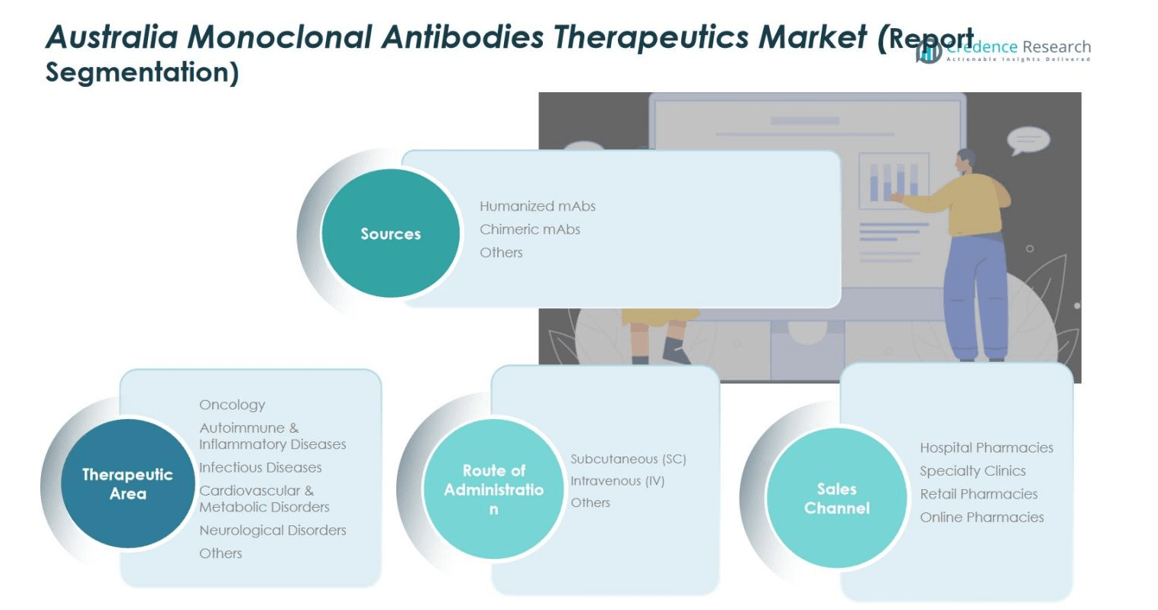
The Australia Monoclonal Antibodies Therapeutics Market by sources is dominated by Humanized mAbs, accounting for approximately 55% of the market share. Humanized antibodies have gained traction due to their higher efficacy and lower immunogenicity compared to chimeric and other antibodies. The growing prevalence of chronic diseases and cancer, along with increasing R&D investments in advanced biologics, are driving the adoption of humanized mAbs. Chimeric mAbs hold a 30% share, while other mAbs contribute 15%, primarily used in niche therapeutic applications and experimental therapies.
By Therapeutic Area:
Oncology leads the therapeutic area segment, representing around 50% of the market share, driven by the rising incidence of cancer in Australia and the development of targeted therapies. Autoimmune & inflammatory diseases account for 20%, supported by the increasing adoption of biologics for conditions such as rheumatoid arthritis and psoriasis. Infectious diseases, cardiovascular & metabolic disorders, and neurological disorders collectively contribute 30%, with growth propelled by expanding research pipelines, increasing awareness, and government initiatives promoting immunotherapy-based treatments.
- For instance, in autoimmune diseases, Biocon Biologics launched NEPEXTO, a biosimilar to Enbrel (etanercept), in Australia in July 2025 to treat conditions like rheumatoid arthritis, expanding affordable treatment options and enhancing market access for biologic therapies.
By Route of Administration:
In terms of administration, the market is dominated by Intravenous (IV) delivery, capturing 60% of the market share, owing to its rapid systemic delivery and established use in hospitals and specialty clinics. Subcutaneous (SC) administration holds about 30%, gaining popularity due to patient convenience and home-based treatment potential. The remaining 10% is occupied by other routes, which are primarily used in clinical trials and niche therapies. Rising demand for personalized treatment and advancements in formulation technologies continue to drive the segment.
- For instance, Argenx’s VYVGART Hytrulo, approved by the FDA in 2024, allows patients with generalized myasthenia gravis to self-inject a larger-volume formulation comfortably using hyaluronidase-mediated absorption.
Key Growth Drivers
Increasing Prevalence of Chronic and Cancerous Diseases
The rising incidence of chronic conditions and cancers in Australia is a primary growth driver for the monoclonal antibodies therapeutics market. Oncology and autoimmune disorders are contributing significantly to market demand, as targeted biologic therapies offer higher efficacy and improved patient outcomes compared to conventional treatments. Increasing disease burden, combined with early diagnosis and growing patient awareness, fuels the adoption of monoclonal antibody therapies. Hospitals, specialty clinics, and research centers are increasingly incorporating these therapies, expanding their use across both clinical and home-based treatment settings.
- For instance, Monoclonal antibodies such as daratumumab for multiple myeloma and trastuzumab for breast cancer are routinely used in major hospitals, and clinical trials are exploring combination regimens to enhance response rates and lower relapse risk.
Advancements in Biopharmaceutical Research and Development
Continuous innovation in biopharmaceutical research is driving the market, as companies focus on developing next-generation monoclonal antibodies with enhanced specificity and reduced side effects. Investments in R&D have led to humanized and fully human antibodies, boosting efficacy and patient compliance. Collaborations between pharmaceutical firms and research institutions accelerate clinical trials and regulatory approvals, while technology-driven approaches, such as antibody engineering and immunotherapy advancements, expand therapeutic applications. This focus on innovation strengthens the pipeline of novel therapies, sustaining long-term market growth.
- For instance, AstraZeneca’s Tezspire (tezepelumab), a human monoclonal antibody approved in 2022 for severe asthma, demonstrated a 56% reduction in annual asthma exacerbations during clinical trials.
Favorable Government Policies and Reimbursement Initiatives
Supportive regulatory frameworks and reimbursement policies in Australia are stimulating market expansion. Government initiatives promoting biologics, immunotherapy, and personalized medicine facilitate patient access to high-cost therapies, while public healthcare coverage reduces financial barriers. Accelerated approval pathways and funding programs encourage clinical development and commercialization of monoclonal antibodies. These measures not only attract domestic and international investments but also enable faster adoption in hospitals and specialty clinics, driving overall market growth and enhancing the availability of innovative therapies to a broader patient population.
Key Trends and Opportunities
Rising Adoption of Personalized and Targeted Therapies
The trend toward personalized medicine is reshaping the monoclonal antibodies therapeutics landscape. Targeted therapies are increasingly preferred for oncology and autoimmune treatments due to their precision and reduced adverse effects. Clinicians leverage biomarker-driven patient profiling to optimize therapy selection, improving treatment outcomes and patient compliance. Pharmaceutical companies are aligning pipelines with these trends, introducing therapies tailored to specific genetic and disease profiles. This approach enhances therapeutic efficiency and opens opportunities for expanding into niche patient segments and rare disease applications.
- For instance, AbbVie has developed Humira (adalimumab), a monoclonal antibody approved for multiple autoimmune conditions, which exemplifies targeted therapy by inhibiting tumor necrosis factor-alpha (TNF-α) to reduce inflammation.
Expansion of Home-Based and Subcutaneous Administration
The increasing acceptance of subcutaneous monoclonal antibody therapies supports market opportunities, particularly for home-based treatments. Patients benefit from convenience, reduced hospital visits, and improved quality of life, while healthcare providers optimize resource utilization. Pharmaceutical companies are innovating self-administration devices and user-friendly formulations, promoting adherence and expanding market reach. This trend aligns with the growing preference for patient-centric care and telemedicine services, creating opportunities to capture untapped market segments and support long-term sustainable growth in the monoclonal antibodies therapeutics market.
- For instance, trastuzumab (Herceptin®) has an approved subcutaneous formulation for HER2-positive breast cancer, simplifying long-term therapy and enabling home administration.
Key Challenges
High Cost of Monoclonal Antibody Therapies
The substantial cost associated with monoclonal antibody therapies remains a key challenge for market expansion. High treatment prices limit patient accessibility and create financial pressure on healthcare systems, especially for chronic and long-term conditions. Although reimbursement policies mitigate some barriers, cost-sensitive patients and smaller clinics may face challenges in adopting these therapies. Pricing pressures also affect market competition, compelling companies to balance innovation and affordability. Addressing these financial hurdles is crucial to ensure broader adoption and equitable access across diverse patient populations in Australia.
Stringent Regulatory and Approval Processes
Complex and rigorous regulatory requirements present challenges in the commercialization of monoclonal antibody therapies. Lengthy clinical trials, safety evaluations, and compliance with manufacturing standards can delay product launches and increase development costs. Navigating these processes requires substantial investment in regulatory expertise and documentation. Additionally, evolving guidelines and approvals for novel therapies may affect time-to-market, impacting competitive positioning. Companies must adopt proactive regulatory strategies and maintain high-quality standards to overcome these challenges while ensuring patient safety and sustaining market growth.
Regional Analysis
New South Wales
New South Wales dominates the Australia monoclonal antibodies therapeutics market, holding a market share of 32%. The region benefits from advanced healthcare infrastructure, a high concentration of hospitals and specialty clinics, and strong research facilities focusing on oncology and autoimmune diseases. Government support and active participation in clinical trials further accelerate adoption. Rising patient awareness and increasing prevalence of chronic diseases contribute to market growth. Investment in healthcare technology and collaborations between biopharmaceutical companies and research institutions also strengthen the region’s market position, making New South Wales a critical hub for monoclonal antibody therapies in Australia.
Victoria
Victoria accounts for 25% of the Australian monoclonal antibodies therapeutics market. The state demonstrates robust healthcare infrastructure with numerous hospitals, specialty clinics, and research institutions engaged in immunotherapy development. A high prevalence of cancer and autoimmune disorders, coupled with early adoption of advanced therapies, drives market growth. Government initiatives promoting biologics and patient-centric care enhance therapy accessibility. Collaboration between pharmaceutical companies and medical research centers accelerates the introduction of innovative monoclonal antibody treatments. Victoria’s focus on clinical trials, patient education, and technologically advanced healthcare delivery positions the state as a key contributor to Australia’s monoclonal antibodies market.
Queensland
Queensland contributes 18% of the market share in Australia’s monoclonal antibodies therapeutics segment. Growth in the region is driven by expanding healthcare infrastructure, rising incidence of oncology and autoimmune disorders, and increasing patient awareness. Specialty clinics and hospitals are adopting biologics, supported by government funding and reimbursement programs. Queensland is witnessing an increase in clinical trials and research collaborations, boosting the availability of targeted therapies. Rising demand for both intravenous and subcutaneous administration methods strengthens market adoption. The state’s investment in healthcare technology and innovative therapies ensures Queensland plays a significant role in the country’s monoclonal antibodies market.
Western Australia
Western Australia holds a 12% share of the monoclonal antibodies therapeutics market in Australia. The region’s growth is supported by advanced hospital networks, specialty care centers, and an increasing focus on oncology and autoimmune disease treatments. Rising patient preference for targeted therapies and subcutaneous administration fuels market adoption. Government-backed healthcare initiatives and reimbursement policies enhance access to biologics, encouraging wider utilization. Collaborative research programs with pharmaceutical companies facilitate the introduction of innovative monoclonal antibodies. With growing awareness of chronic disease management and increasing investments in healthcare infrastructure, Western Australia continues to strengthen its position in the national monoclonal antibodies therapeutics market.
South Australia
South Australia contributes 8% of the market share in the monoclonal antibodies therapeutics segment. The state’s growth is driven by the presence of specialized healthcare facilities and research institutions focused on biologics and immunotherapy. Rising prevalence of cancer and autoimmune disorders supports the adoption of monoclonal antibodies. Government initiatives and reimbursement programs improve patient accessibility to high-cost therapies. Hospitals and specialty clinics are increasingly integrating targeted monoclonal antibody treatments into their service offerings. Clinical research collaborations and technology adoption further strengthen the market. South Australia’s strategic initiatives and healthcare investment ensure steady growth in the monoclonal antibodies therapeutics market.
Tasmania
Tasmania accounts for 3% of Australia’s monoclonal antibodies therapeutics market. The region’s market is gradually expanding due to increasing patient awareness and growing prevalence of chronic diseases. Hospitals and specialty clinics are adopting targeted therapies, supported by government reimbursement initiatives. Limited population size constrains growth, but healthcare infrastructure improvements and regional research programs facilitate access to monoclonal antibody therapies. Subcutaneous administration is gaining traction due to patient convenience and home-based treatment options. Tasmania’s healthcare focus on immunotherapy and collaborations with larger pharmaceutical companies ensures consistent market development, contributing to Australia’s overall monoclonal antibodies therapeutics growth.
Australian Capital Territory
The Australian Capital Territory holds a 2% market share in the monoclonal antibodies therapeutics segment. The region benefits from advanced healthcare facilities and research centers specializing in immunotherapy and oncology treatments. Government support for biologics and early adoption of innovative therapies drive market growth. Hospitals and specialty clinics integrate monoclonal antibodies into treatment protocols, particularly for cancer and autoimmune disorders. Limited population size moderates the overall market size, but high per-capita adoption and patient awareness ensure steady growth. Research collaborations and healthcare investments continue to strengthen the region’s role in supporting monoclonal antibody therapy expansion across Australia.
Northern Territory
The Northern Territory contributes 2% of the Australian monoclonal antibodies therapeutics market. Market growth is supported by improving healthcare infrastructure, rising patient awareness, and government reimbursement initiatives. Specialty clinics and hospitals are gradually adopting monoclonal antibodies for oncology and autoimmune diseases. Population constraints and limited healthcare access in remote areas pose challenges, but targeted government programs and regional healthcare projects are increasing therapy availability. Subcutaneous administration and home-based treatment solutions are helping improve adoption. Strategic collaborations with pharmaceutical companies and investment in healthcare technology further support the Northern Territory’s gradual growth within the national monoclonal antibodies therapeutics market.
Market Segmentations:
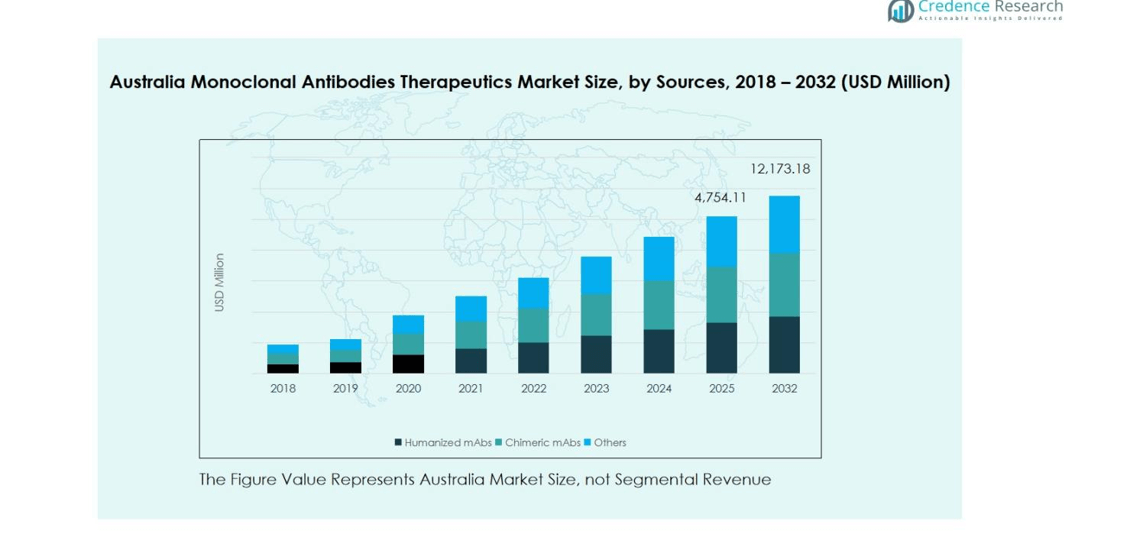
By Sources
- Humanized mAbs
- Chimeric mAbs
- Others
By Therapeutic Area
- Oncology
- Autoimmune & Inflammatory Diseases
- Infectious Diseases
- Cardiovascular & Metabolic Disorders
- Neurological Disorders
- Others
By Route of Administration
- Subcutaneous (SC)
- Intravenous (IV)
- Others
By Sales Channel
- Hospital Pharmacies
- Specialty Clinics
- Retail Pharmacies
- Online Pharmacies
By Region
- New Southwales
- Victoria
- Queensland
- Western Australia
- South Australia
- Tasmania
- Australian Capital Territory
- Northern Teritory
Competitive Landscape
The competitive landscape of the Australia Monoclonal Antibodies Therapeutics Market features key players including F. Hoffmann-La Roche Ltd, AbbVie Inc., Sanofi, Bristol Myers Squibb, Novartis AG, Amgen Inc., AstraZeneca, Eli Lilly and Company, Takeda Pharmaceutical Company Limited, and Johnson & Johnson Services, Inc. These companies lead the market through continuous innovation, robust product portfolios, and strategic collaborations. Intense competition is driven by the introduction of novel humanized and fully human monoclonal antibodies targeting oncology, autoimmune, and infectious diseases. Companies are focusing on enhancing manufacturing capabilities, expanding R&D pipelines, and forming partnerships with hospitals and research institutions to accelerate product launches. Regulatory compliance and adoption of patient-centric approaches further strengthen market positioning. The competitive intensity encourages innovation in formulation, administration methods, and targeted therapies, ensuring sustained growth while meeting evolving patient and healthcare provider demands in Australia.
Key Player Analysis
- Hoffmann-La Roche Ltd
- Sanofi
- AbbVie Inc.
- Bristol Myers Squibb Company
- Novartis AG
- AstraZeneca
- Amgen Inc.
- Eli Lilly and Company
- Takeda Pharmaceutical Company Limited
- Johnson & Johnson Services, Inc.
- Other Key Players
Recent Developments
- In September 2025, Eisai Co., Ltd. announced that LEQEMBI® (Lecanemab) was approved for the treatment of Alzheimer's disease in Australia.
- In 2025, Neuraxpharm Australia was established in Sydney to commercialize the prescription brands Nuvigil® (armodafinil) and Modavigil® (modafinil), both indicated for the treatment of excessive daytime sleepiness in adults with narcolepsy, which were acquired by Neuraxpharm in December 2024.
- In November 2024, HaemaLogiX, a biotech company focusing on blood cancer treatments, announced plans for an initial public offering (IPO) on the Australian Securities Exchange (ASX) in the second quarter of 2025.
Report Coverage
The research report offers an in-depth analysis based on Sources, Therapeutic Area, Route of Administration, Sales Channel and Region. It details leading market players, providing an overview of their business, product offerings, investments, revenue streams, and key applications. Additionally, the report includes insights into the competitive environment, SWOT analysis, current market trends, as well as the primary drivers and constraints. Furthermore, it discusses various factors that have driven market expansion in recent years. The report also explores market dynamics, regulatory scenarios, and technological advancements that are shaping the industry. It assesses the impact of external factors and global economic changes on market growth. Lastly, it provides strategic recommendations for new entrants and established companies to navigate the complexities of the market.
Future Outlook
- The market is expected to witness strong growth driven by rising prevalence of cancer and autoimmune disorders.
- Increasing adoption of humanized and fully human monoclonal antibodies will expand therapeutic applications.
- Advancements in biopharmaceutical research will accelerate the development of next-generation targeted therapies.
- Government support and reimbursement initiatives will enhance patient access to high-cost biologics.
- Subcutaneous and home-based administration methods will gain wider acceptance among patients.
- Personalized medicine and biomarker-driven treatments will become more prominent in clinical practice.
- Collaborations between pharmaceutical companies and research institutions will strengthen innovation pipelines.
- Growing patient awareness and early diagnosis will support higher therapy adoption rates.
- Expansion of specialty clinics and hospital networks will improve therapy accessibility across regions.
- Continuous investment in R&D and manufacturing capabilities will sustain long-term market competitiveness.
Request a Free Sample
Fill in your details and we'll send you a free sample report.
- Sample data tables & charts
- Research methodology
Need a Custom Version of This Report?
Tailor the scope, geography, or segments to your exact requirements.
- Custom geography or segment scope
- Direct access to our analyst team
Frequently Asked Questions
What is the current market size for Australia Monoclonal Antibodies Therapeutics Market, and what is its projected size in 2032?
At what Compound Annual Growth Rate is the Australia Monoclonal Antibodies Therapeutics Market projected to grow between 2025 and 2032?
Which Australia Monoclonal Antibodies Therapeutics Market segment held the largest share in 2024?
What are the primary factors fueling the growth of the Australia Monoclonal Antibodies Therapeutics Market?
Who are the leading companies in the Australia Monoclonal Antibodies Therapeutics Market?
Which region commanded the largest share of the Australia Monoclonal Antibodies Therapeutics Market in 2024?
Table of Content
Chapter 1. Report Introduction
- 1.1 Report Description & Purpose
- 1.1.1 Report Title & Market Definition
- 1.1.2 Unique Selling Propositions (USP) & Key Differentiators
- 1.1.3 Value Proposition for Stakeholders
- 1.2 Research Objectives
- 1.2.1 Market Sizing Objectives (Volume & Revenue) (Volume Where Applicable)
- 1.2.2 Segmentation Objectives
- 1.2.3 Competitive Intelligence Objectives
- 1.2.4 Forecast & Scenario Objectives
- 1.3 Report Scope
- 1.3.1 Australia Monoclonal Antibodies Therapeutics Scope – Segments & Subsegments Covered
- 1.3.2 Geographic Scope – Selected Country & Subnational Markets Covered
- 1.3.3 Historical Period, Base Year & Forecast Period (2024; forecast to 2032)
- 1.3.4 Inclusions & Exclusions
- 1.4 Industry Classification & Applicable Codes
- 1.5 Currency, Measurement Units & Valuation Basis
- 1.6 Target Stakeholders
- 1.7 Limitations & Assumptions
Chapter 2. Executive Summary
- 2.1 Australia Monoclonal Antibodies Therapeutics Snapshot
- 2.1.1 Market Size – Historical (2024) & Forecast (2024-2032) (2024: USD 4,190.72 million → 2032: USD 12,173.18 million)
- 2.1.2 Volume & Revenue – National Totals (Volume Where Applicable)
- 2.1.3 Key Market Highlights – Top Five Facts
- 2.2 Australia Monoclonal Antibodies Therapeutics Segmentation Snapshot
- 2.2.1 Market Split by Subnational Area – 2024 vs. 2032
- 2.3 Competitive Snapshot
- 2.3.1 Top 10 Players by Revenue Share – 2024
- 2.3.2 Top 10 Players by Volume Share – 2024 (Volume Where Applicable)
- 2.3.3 Recent Strategic Developments (18-Month Summary)
- 2.4 Key Investment Highlights & Strategic Conclusions
Chapter 3. Australia Monoclonal Antibodies Therapeutics Dynamics & Industry Analysis
- 3.1 Market Overview & Context
- 3.1.1 Australia Monoclonal Antibodies Therapeutics Position in the Broader Industry Value Chain
- 3.1.2 Demand Structure & Purchasing Dynamics
- 3.1.3 Market Maturity & Development Stage Across Domestic Markets
- 3.2 Australia Monoclonal Antibodies Therapeutics Drivers
- 3.3 Australia Monoclonal Antibodies Therapeutics Restraints & Challenges
- 3.4 Australia Monoclonal Antibodies Therapeutics Opportunities
- 3.5 Porter's Five Forces Analysis
- 3.5.1 Threat of New Entrants
- 3.5.2 Bargaining Power of Suppliers
- 3.5.3 Bargaining Power of Buyers
- 3.5.4 Threat of Substitutes
- 3.5.5 Competitive Rivalry – Intensity Assessment
- 3.6 Australia Monoclonal Antibodies Therapeutics Value Chain Analysis
- 3.6.1 Upstream – Key Inputs, Resources & Suppliers
- 3.6.1.1 Key Input/Resource 1
- 3.6.1.2 Key Input/Resource 2
- 3.6.1.3 Key Input/Resource 3
- 3.6.2 Midstream – Core Operations & Value Creation
- 3.6.2.1 Operating Model & Process Overview
- 3.6.2.2 Key Operating Locations & Capabilities by Company
- 3.6.3 Downstream – Market Channels & End Users
- 3.6.3.1 Direct Sales & Customer Engagement Channels
- 3.6.3.2 Indirect Sales, Intermediaries & Partner Channels
- 3.6.4 Value Chain Profitability Analysis
- 3.6.1 Upstream – Key Inputs, Resources & Suppliers
- 3.7 PESTEL Analysis
- 3.7.1 Political Factors
- 3.7.2 Economic Factors
- 3.7.3 Social Factors
- 3.7.4 Technological Factors
- 3.7.5 Environmental Factors
- 3.7.6 Legal Factors
- 3.8 Australia Monoclonal Antibodies Therapeutics Supply Chain Analysis
- 3.8.1 Critical Input & Resource Availability Risk Assessment
- 3.8.2 Supplier & Operational Concentration Risk (Geographic Exposure)
- 3.8.3 Supply & Service Disruption Impact Analysis
- 3.9 National & Subnational Regulatory Landscape
Note: The regulatory and policy landscape section covers regulations based on their applicability to the market, Australia Monoclonal Antibodies Therapeutics category, geography, and scope of the study. Only regulatory frameworks with a material impact on operations, compliance, trade, sustainability, or market access are analyzed in detail.
Chapter 4. Key Investment Pockets & Opportunity Analysis
- 4.1 Australia Monoclonal Antibodies Therapeutics Attractiveness Analysis
- 4.1.1 By Subnational Area – Investment Attractiveness Matrix (Market Size × CAGR)
- 4.2 Absolute Revenue Growth Opportunity
- 4.2.1 By Subnational Area – Absolute Revenue Growth Through 2032
- 4.3 Incremental Demand Opportunity
- 4.3.1 By Subnational Area – Incremental Demand Through 2032
- 4.3.2 Segment – Incremental Demand
- 4.4 Emerging Submarket Opportunity Deep Dive (Subject to Applicability)
- 4.5 Priority Domestic Market Opportunity Scorecards
- 4.5.1 Priority Domestic Market 1
- 4.5.2 Priority Domestic Market 2
- 4.5.3 Priority Domestic Market 3
- 4.5.4 Priority Domestic Market 4
Note: Domestic market scorecards cover relevant states, provinces, territories, cities, or economic zones within the selected country. Numbered entries are populated with market names suited to the national administrative structure and research scope. Geographic share tables use one consistent, nonoverlapping set of areas.
Chapter 5. Australia Monoclonal Antibodies Therapeutics Cross-Border Trade & Market Access Analysis
- 5.1 National Trade & International Partner Overview
- 5.1.1 Export Value by Destination Country (2024)
- 5.1.2 Export Volume by Destination Country (2024) (Where Applicable)
- 5.1.3 Import Value by Source Country (2024)
- 5.1.4 Import Volume by Source Country (2024) (Where Applicable)
- 5.1.5 National & Partner-Country Trade Balances (2024)
- 5.2 Export Analysis – Segment
- 5.2.1 Category 1 (Applicable Classification Code)
- 5.2.2 Category 2 (Applicable Classification Code)
- 5.2.3 Category 3 (Applicable Classification Code)
- 5.2.4 Category 4 (Applicable Classification Code)
- 5.2.5 Category 5 (Applicable Classification Code)
- 5.3 Import Analysis – Segment
- 5.3.1 Category 1 (Applicable Classification Code)
- 5.3.2 Category 2 (Applicable Classification Code)
- 5.3.3 Category 3 (Applicable Classification Code)
- 5.3.4 Category 4 (Applicable Classification Code)
- 5.3.5 Category 5 (Applicable Classification Code)
- 5.4 Cross-Border Pricing & Transaction Benchmarks
- 5.4.1 Export Pricing – Segment & Destination Country
- 5.4.2 Import Pricing – Segment & Source Country
- 5.4.3 Price Trends (2024)
- 5.5 Key Cross-Border Trade & Delivery Routes
- 5.5.1 Cross-Border Trade/Delivery Route 1
- 5.5.2 Cross-Border Trade/Delivery Route 2
- 5.5.3 Cross-Border Trade/Delivery Route 3
- 5.5.4 Cross-Border Trade/Delivery Route 4
- 5.5.5 Cross-Border Trade/Delivery Route 5
- 5.6 Trade Policy & Market Access Impact Assessment
- 5.6.1 Tariff & Non-Tariff Barriers
- 5.6.2 National Participation in Regional Trade & Economic Frameworks
- 5.6.3 Bilateral & Multilateral Trade Agreements
- 5.6.4 Cross-Border Operating, Licensing & Localization Requirements
Note: This chapter covers international trade relevant to Australia Monoclonal Antibodies Therapeutics in the selected country. Exports are analyzed by destination and imports by source. Domestic interregional flows are excluded from international trade totals. Goods, services, and digital offerings use applicable classifications; volume and route analyses apply only where meaningful.
Chapter 6. Competitive Landscape & Company Benchmarking
- 6.1 Australia Monoclonal Antibodies Therapeutics Concentration & Structure
- 6.1.1 Herfindahl-Hirschman Index (HHI) – vs. 2024
- 6.1.2 Leading, Mid-Sized & Emerging Player Structure
- 6.1.3 Multinational, National & Local Player Dynamics
- 6.2 Australia Monoclonal Antibodies Therapeutics Share Analysis – 2024
- 6.2.1 National Revenue Share by Company
- 6.2.2 National Volume Share by Company (Volume Where Applicable)
- 6.2.3 Company Revenue Share by Subnational Area
- 6.2.4 Market Share Evolution ( vs. 2024)
- 6.2.5 Company Market Share by Key Segment
- 6.2.6 Company Market Share by Customer Group
- 6.3 Operating Scale, Capacity & Infrastructure Analysis
- 6.3.1 National Operating Scale & Supply Capacity
- 6.3.2 Resource Utilization & Operating Efficiency
- 6.3.3 Output, Service Delivery & Activity Metrics
- 6.3.4 Operating Footprint & Infrastructure Map
- 6.3.5 Planned Operational & Capacity Expansion
- 6.4 Australia Monoclonal Antibodies Therapeutics Competitive Benchmarking Matrix
- 6.4.1 Revenue, Growth, Profitability & Operating Metric Comparison
- 6.4.2 Channel Revenue Mix
- 6.4.3 Revenue Exposure Across Domestic Markets
- 6.4.4 R&D Intensity
- 6.4.5 Sustainability Maturity
- 6.5 Strategic Developments in Australia Monoclonal Antibodies Therapeutics (Last 24 Months)
- 6.5.1 Mergers, Acquisitions & Divestments
- 6.5.2 New Products, Services & Solutions in Australia Monoclonal Antibodies Therapeutics
- 6.5.3 Operational & Infrastructure Expansions
- 6.5.4 Strategic Alliances, Joint Ventures & Partnerships
- 6.5.5 Distribution Expansion & Market Entry
- 6.5.6 Sustainability & ESG Initiatives
- 6.6 Competitive Strategy Mapping
- 6.6.1 Leader, Challenger, Follower & Niche Classification
- 6.6.2 Pricing Strategy Comparison
- 6.6.3 Channel Strategy Matrix
Note: Strategic developments are included based on their materiality and the availability of reliable information.
Chapter 7. Australia Monoclonal Antibodies Therapeutics – By Sales & Delivery Channel
- 7.1 Segment Overview
- 7.1.1 Volume & Revenue Split by Channel (2024 & 2032) (Volume Where Applicable)
- 7.1.2 Channel Mix Evolution (2024-2032)
Chapter 8. Subnational Market Analysis – Country Overview
- 8.1 Domestic Geographic Market Overview
- 8.1.1 Subnational Volume Share (Where Applicable)
- 8.1.2 Subnational Revenue Share
- 8.1.3 Market Volume by Subnational Area (Where Applicable)
- 8.1.4 Market Revenue by Subnational Area
- 8.1.5 Subnational Forecasts Through 2032
- 8.2 Cross-Area Segment Analysis Within the Country
- 8.2.1 By Sales & Delivery Channel
- 8.2.2 By Competitive Positioning & Price Tier
Chapter 9. Australia Monoclonal Antibodies Therapeutics – Priority Domestic Market 1
Chapter 10. Australia Monoclonal Antibodies Therapeutics – Priority Domestic Market 2
Chapter 11. Australia Monoclonal Antibodies Therapeutics – Priority Domestic Market 3
Chapter 12. Australia Monoclonal Antibodies Therapeutics – Priority Domestic Market 4
Chapter 13. Australia Monoclonal Antibodies Therapeutics Company Profiles
- 13.1 [Company 01]
- 13.1.1 Company Overview
- 13.1.2 Key Management Personnel
- 13.1.3 Products & Services Portfolio
- 13.1.4 Financial Performance
- 13.1.5 Domestic Market Focus & Local Operating Presence
- 13.1.6 Recent Developments & Strategic Initiatives
Note: The company profile list is preliminary and may change based on research findings, market developments, data availability, and client requirements.
Chapter 14. Appendices
- Appendix A – List of Abbreviations & Acronyms
- Appendix B – Industry Classification Code Reference – Full Series
- Appendix C – Supply, Output & Operating Capacity Data Tables
- Appendix D – End-Use & Demand Base Tables
- Appendix E – Demand, Adoption & Usage Assumptions
- Appendix F – Pricing & Revenue Metric Reference Tables
- Appendix G – Company Operations & Infrastructure Database
- Appendix H – Cross-Border Trade & Activity Data Tables (Where Applicable)
- Appendix I – Regulatory Summary Tables
- Appendix J – Primary Research Participant List (Anonymized)
- Appendix K – Primary Research Questionnaire Framework
- Appendix L – Data Sources & Bibliography
- Appendix M – Market Size Divergence & Source Comparison
Chapter 15. Research Methodology
- 15.1 Research Framework & Philosophy
- 15.2 Secondary Research – Sources, Hierarchy & Data Extraction
- 15.3 Data Modeling – National Market Sizing & Subnational Allocation
- 15.4 Primary Research – Stakeholder Framework, LOI & Sample Sizes
- 15.5 Forecast Methodology – Regression, Scenario & Sensitivity Analysis
- 15.6 Quality Control – Four-Layer Validation Framework
- 15.7 Limitations & Standard Assumptions
- 15.8 Disclaimer
