Market Overview
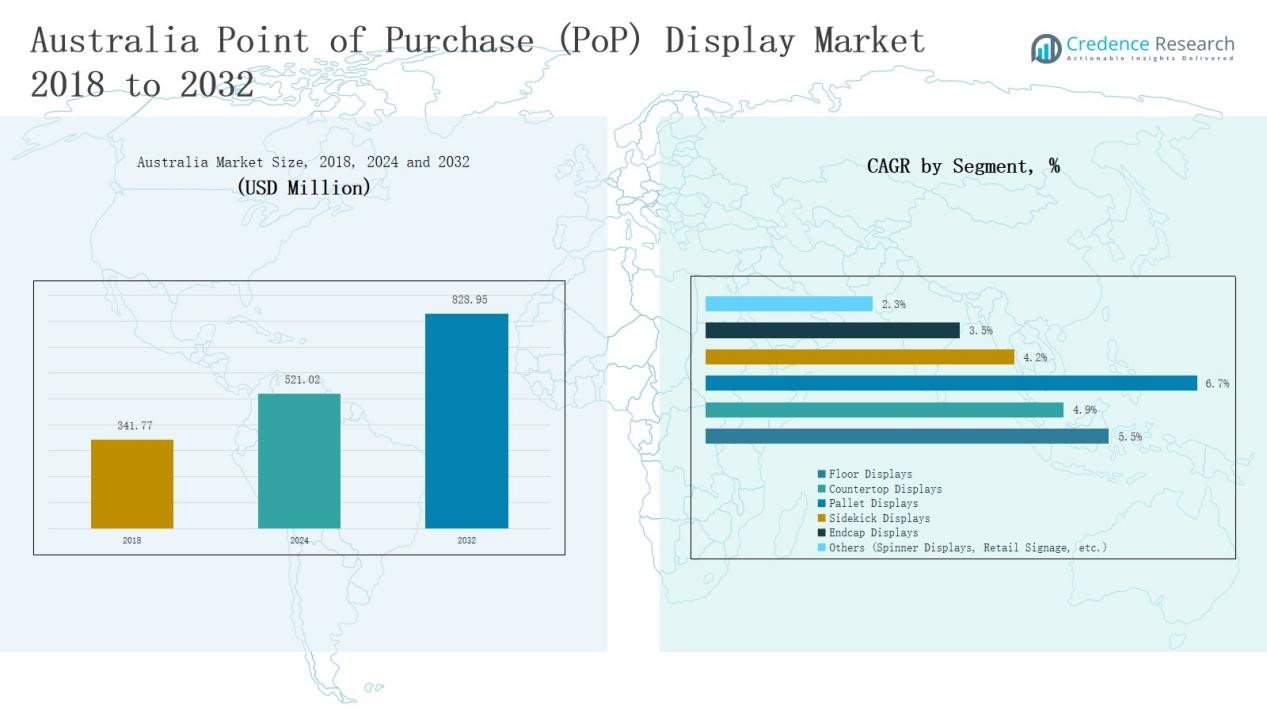
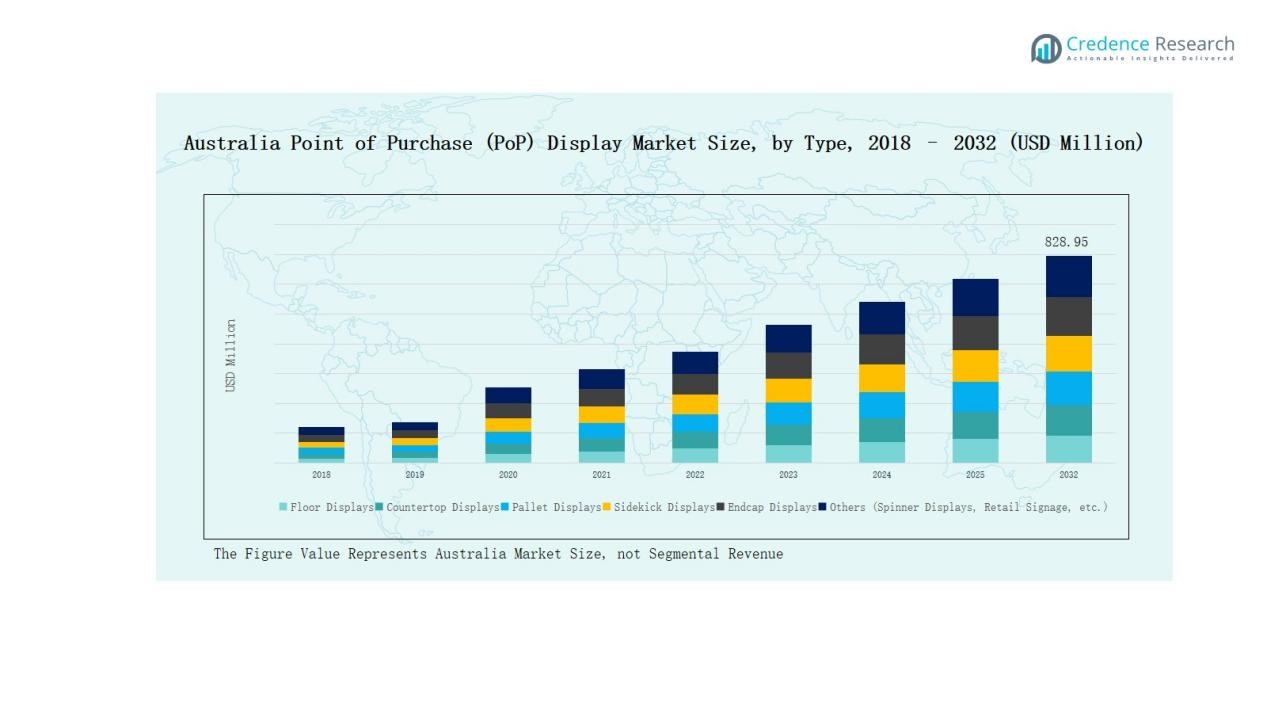
Australia Point of Purchase (PoP) Display Market size was valued at USD 341.77 million in 2018 to USD 521.02 million in 2024 and is anticipated to reach USD 828.95 million by 2032, at a CAGR of 5.56% during the forecast period.
| REPORT ATTRIBUTE |
DETAILS |
| Historical Period |
2020-2023 |
| Base Year |
2024 |
| Forecast Period |
2025-2032 |
| Australia Point of Purchase (PoP) Display Market Size 2024 |
USD 521.02 Million |
| Australia Point of Purchase (PoP) Display Market, CAGR |
5.56% |
| Australia Point of Purchase (PoP) Display Market Size 2032 |
USD 828.95 Million |
The Australia Point of Purchase (PoP) Display Market features strong competition among key domestic players, including POP Group Australia, Genesis Retail Displays, Visual Max, Poppin Display, Exhibit Systems, Retailquip, TDC The Display Co., Blue Sky Displays, Hi-Tech Display Systems, and Expo Direct. These companies strengthen their positions through diverse portfolios spanning floor, countertop, and permanent displays, while also focusing on customization, sustainability, and digital integration. Among regions, New South Wales led the market with a 34% share in 2024, supported by Sydney’s dense retail infrastructure, extensive supermarket networks, and growing adoption of eco-friendly and premium display solutions. This regional dominance, combined with the presence of leading players, underscores New South Wales as the central hub for innovation and growth within the national PoP display market.
Access crucial information at unmatched prices!
Request your sample report today & start making informed decisions powered by Credence Research Inc.!
Download Sample
Market Insights
- The Australia Point of Purchase (PoP) Display Market grew from USD 341.77 million in 2018 to USD 521.02 million in 2024 and will reach USD 828.95 million by 2032.
- Floor displays dominated with 32% share in 2024, supported by supermarkets and retail chains, while countertop and pallet displays gained traction in pharmacies, convenience stores, and warehouse-style outlets.
- Food and beverage led applications with 41% share in 2024, driven by supermarket promotions and FMCG launches, followed by pharmaceuticals, cosmetics, electronics, and automotive segments.
- Temporary PoP displays held 58% share in 2024, offering cost-effective and flexible promotional solutions, while permanent displays expanded steadily in electronics, cosmetics, and premium retail.
- New South Wales led regionally with 34% share in 2024, supported by Sydney’s dense retail infrastructure, while Victoria and Queensland followed with strong contributions from food, cosmetics, and tourism-linked retail.
Market Segment Insights
By Type
Floor displays accounted for 32% of the Australia PoP display market share in 2024, making them the dominant sub-segment. Their wide adoption is supported by high visibility, capacity to hold bulk products, and strong use in supermarkets and retail chains. Countertop displays followed, driven by demand in pharmacies and convenience stores for compact solutions. Pallet and sidekick displays are gaining traction due to promotions in warehouse-style outlets. Endcap displays continue to serve as critical merchandising tools in grocery stores, while other formats like spinner displays and signage provide niche support for specialized retail campaigns.
- For instance, DS Smith launched a series of sustainable floor displays tailored for Australian supermarket chains, capable of holding up to 75 kg of assorted products, enhancing visibility while reducing environmental impact through recyclable materials.
By Application
Food & beverage led the market with 41% share in 2024, maintaining dominance in Australia’s PoP display segment. Rising supermarket promotions, beverage launches, and FMCG brand competition are the key drivers. Pharmaceuticals ranked second, supported by point-of-sale advertising in pharmacies and health stores. Cosmetics and personal care displays benefit from rising consumer preference for premium beauty products. Electronics and automotive segments use specialized displays for new product launches and accessories. Home furnishings and niche categories like wine & spirits also add incremental demand, reflecting diversification across retail verticals.
- For instance, Coca‑Cola Australia partnered with Coles to roll out branded point‑of‑purchase displays for its Y3000 limited‑edition soft drink, targeting supermarket shoppers with immersive experiential stands.
By Style
Temporary PoP displays held a 58% share in 2024, establishing themselves as the leading style in Australia’s market. Their popularity stems from cost-effectiveness, adaptability, and suitability for seasonal or promotional campaigns across FMCG and retail sectors. Permanent displays, while smaller in share, are steadily expanding in categories like electronics, cosmetics, and automotive where durability and long-term brand visibility are prioritized. The balance between temporary and permanent formats highlights retailers’ dual focus on short-term sales boosts and long-term brand-building strategies.
Key Growth Drivers
Rising Retail Expansion and FMCG Promotions
Australia’s growing supermarket chains, convenience outlets, and specialty retail stores drive strong demand for PoP displays. FMCG brands increasingly invest in visually engaging floor and countertop displays to influence impulse buying and differentiate products. Seasonal promotions, new launches, and competitive in-store marketing fuel continuous adoption. As retailers expand formats and modernize layouts, PoP displays remain critical for product visibility and brand recall, positioning them as indispensable sales tools in an evolving retail environment.
- For instance, Woolworths installed sustainability-focused PoP displays across 150 stores to highlight eco-friendly packaging and local produce.
Increasing Demand for Temporary Displays
Temporary PoP displays dominate with a significant share due to their flexibility and cost efficiency. Retailers and FMCG players prefer these displays for short-term campaigns, product launches, and festival-driven sales surges. Their recyclable nature and quick adaptability support sustainability and operational convenience. The rise of promotional retailing and shifting consumer preferences toward new product trials boost the popularity of temporary formats. This trend aligns with Australia’s dynamic retail promotions landscape, ensuring steady growth for cost-effective, eco-conscious display solutions.
- For instance, Coca-Cola Australia introduced recyclable temporary PoP displays across supermarkets during its FIFA Women’s World Cup campaign, driving higher shopper engagement with limited-edition packs.
Expansion in Premium and Specialty Products
The cosmetics, personal care, and electronics sectors increasingly rely on premium PoP displays to highlight value-added products. Permanent displays in glass, metal, and wood dominate high-traffic retail zones where durability and aesthetic appeal are vital. Specialty retailers use these displays for long-term brand reinforcement and customer engagement. Growing demand for luxury goods, health products, and consumer electronics fuels investment in premium displays. This strategic shift enhances consumer perception and strengthens positioning for brands targeting Australia’s higher-income demographics.
Key Trends & Opportunities
Sustainable and Eco-Friendly Display Materials
Sustainability is emerging as a central trend in the Australian PoP display market. Retailers and brands are replacing traditional plastic with corrugated boards, recycled wood, and biodegradable materials. Eco-conscious consumers increasingly prefer products displayed on environmentally responsible platforms, driving adoption. Manufacturers that integrate green design practices gain a competitive edge by aligning with corporate ESG goals and consumer values. This trend creates opportunities for innovation in eco-friendly material sourcing, display design, and waste reduction strategies.
- For instance, DS Smith offers Point of Purchase (POP) displays that are 100% recyclable and designed using Circular Design Principles, which emphasize the use of recycled paper-based materials and reducing landfill waste.
Digital Integration and Interactive Displays
Technological advancements are opening new opportunities for PoP displays in Australia. Retailers are experimenting with interactive screens, motion sensors, and QR codes to create engaging consumer experiences. Integration of digital elements enables brands to track consumer engagement and personalize promotions in real time. Electronics, cosmetics, and luxury product retailers benefit the most from this transformation. As omnichannel strategies evolve, combining physical displays with digital touchpoints strengthens consumer engagement, offering a new growth pathway for Australian PoP display providers.
- For instance, smart PoP displays from Tokinomo’s Visibubble activate via motion sensors. They engage shoppers upon approach with product info and messaging.
Key Challenges
Rising Material and Production Costs
The PoP display market in Australia faces pressure from rising raw material costs, particularly for corrugated boards, plastics, and metals. Supply chain disruptions and global inflation increase production expenses, directly impacting margins for manufacturers. Retailers are often reluctant to absorb these added costs, creating pricing challenges for display producers. To remain competitive, companies must balance affordability with quality, while adopting lean manufacturing practices. This challenge underscores the need for efficient sourcing and sustainable production to manage volatility.
Competition from Digital Retail Channels
E-commerce continues to expand in Australia, diverting consumer spending away from physical stores. Online platforms reduce the necessity for traditional in-store displays, limiting market growth opportunities. While physical retail remains important, especially for FMCG and impulse products, digital alternatives are reshaping consumer purchasing behavior. Brands are compelled to diversify marketing budgets toward online advertising, challenging the role of PoP displays. This shift requires innovative strategies to demonstrate in-store display value and maintain relevance amid growing online retail competition.
Environmental Regulations and Waste Concerns
Australia’s regulatory environment emphasizes sustainability, placing pressure on display producers to adopt eco-friendly practices. Single-use plastics and non-recyclable materials face scrutiny, increasing compliance burdens for manufacturers. Retailers demand recyclable or biodegradable solutions, but switching to greener materials often raises costs and complicates design flexibility. Managing waste disposal and lifecycle impacts adds operational challenges. Companies unable to align with sustainability expectations risk losing market share to competitors prioritizing eco-compliant, innovative display formats. This makes environmental adaptation both a challenge and necessity.
Regional Analysis
New South Wales
New South Wales accounted for 34% share of the Australia Point of Purchase (PoP) Display Market in 2024. The state’s large retail infrastructure, including supermarkets, hypermarkets, and specialty stores, strongly supports demand for PoP displays. Food and beverage companies dominate with high promotional activity across Sydney’s dense retail hubs. Cosmetics and electronics sectors also adopt premium display solutions to target urban consumers. Sustainability initiatives and growing adoption of corrugated displays reinforce market growth. Retail chains in the region continue investing in innovative formats to strengthen consumer engagement.
Victoria
Victoria held 27% share of the market in 2024, led by Melbourne’s expanding retail centers and shopping complexes. The food and beverage sector maintains the highest share, with cosmetics and personal care following closely. Seasonal campaigns and temporary displays drive consistent demand across FMCG outlets. Retailers are shifting toward recyclable materials, aligning with consumer preferences for eco-friendly formats. Electronics and lifestyle brands deploy permanent displays to highlight premium offerings. Victoria’s dynamic retail landscape makes it a critical growth hub.
Queensland
Queensland captured 18% share of the market in 2024, driven by supermarket expansion and tourism-linked retail activity. Temporary PoP displays are widely used during holiday seasons to support promotional campaigns. Food and beverage brands remain the largest contributors, while wine and spirits benefit from tourism demand. Rising adoption of permanent displays in urban centers highlights electronics and personal care products. Retailers emphasize sustainability by incorporating corrugated and recyclable formats. Queensland demonstrates growing potential with balanced adoption across segments.
Western Australia
Western Australia contributed 12% share of the market in 2024, with Perth serving as the main retail hub. Mining-linked economic activity supports strong purchasing power, fueling demand for both FMCG and specialty retail displays. Temporary displays dominate due to ongoing promotional activity, but permanent displays are gaining presence in electronics and automotive outlets. Food and beverage brands lead adoption, supported by competitive supermarket chains. Retailers in Western Australia increasingly invest in eco-conscious solutions to align with state sustainability policies.
South Australia and Others
South Australia and other regions together represented 9% share of the market in 2024. The state benefits from stable demand across food and beverage, cosmetics, and healthcare displays. Retail infrastructure remains smaller than larger states but provides steady opportunities for regional suppliers. Adoption of corrugated and wood-based displays is rising as retailers prioritize sustainability. Promotional campaigns during local events and festivals contribute to consistent display usage. It continues to reflect incremental but stable growth in the national market.
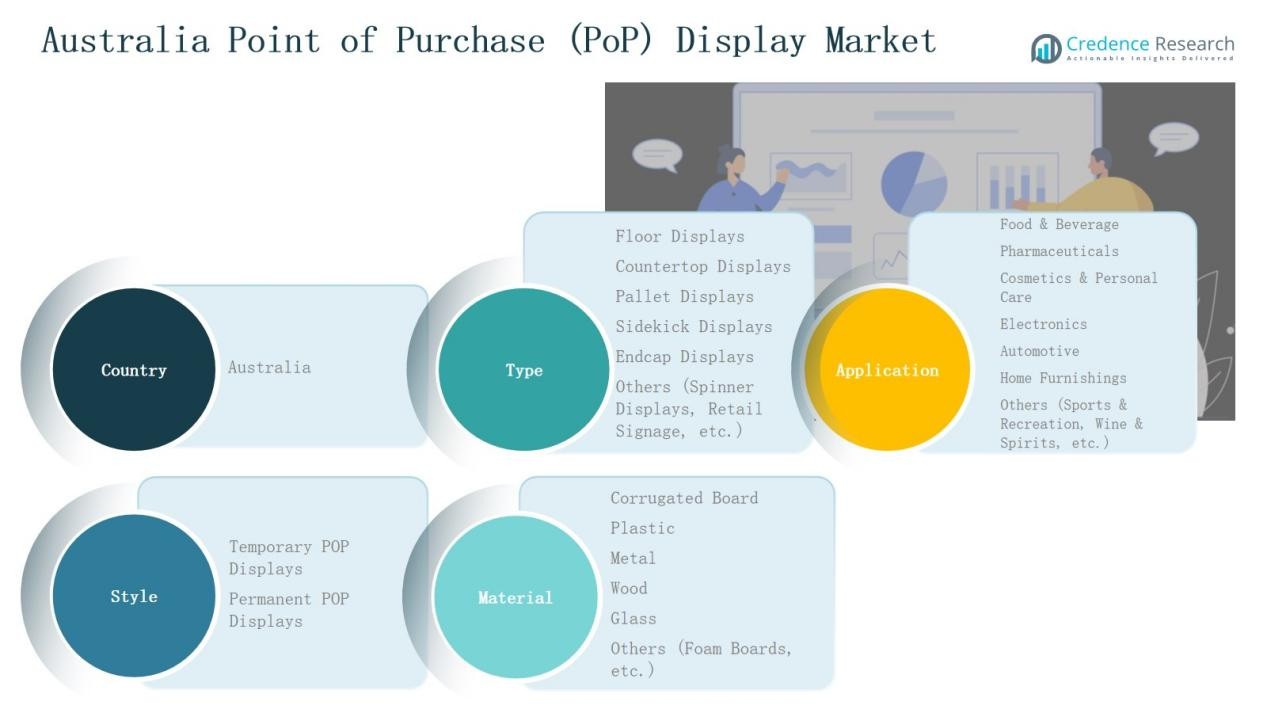
Market Segmentations:
By Type
- Floor Displays
- Countertop Displays
- Pallet Displays
- Sidekick Displays
- Endcap DisplaysOthers (Spinner Displays, Retail Signage, etc.)
By Application
- Pharmaceuticals
- Cosmetics & Personal Care
- Electronics
- Automotive
- Home Furnishings
- Others (Sports & Recreation, Wine & Spirits, etc.)
By Style
- Temporary POP Displays
- Permanent POP Displays
By Material
- Corrugated Board
- Plastic
- Metal
- Wood
- Glass
- Others (Foam Boards, etc.)
By Region
- New South Wales
- Victoria
- Queensland
- Western Australia
- South Australia
- Others
Competitive Landscape
The Australia Point of Purchase (PoP) Display Market is characterized by a mix of established domestic players and specialized regional firms that cater to diverse retail needs. Key companies such as POP Group Australia, Genesis Retail Displays, Visual Max, and Poppin Display dominate through their strong portfolios in floor and countertop displays, with a focus on cost-effective and customizable solutions. Exhibit Systems, Retailquip, and TDC The Display Co. strengthen their positions by offering innovative and durable permanent displays targeting electronics, cosmetics, and automotive segments. Blue Sky Displays and Hi-Tech Display Systems emphasize eco-friendly formats by integrating corrugated and recyclable materials into their product lines. Expo Direct adds competitive depth with its strong presence in trade show and promotional display services. Competition is shaped by sustainability demands, digital integration, and customer-focused design, pushing players to innovate and align with both retailer expectations and consumer trends.
Shape Your Report to Specific Countries or Regions & Enjoy 30% Off!
Key Players
- POP Group Australia
- Genesis Retail Displays
- Visual Max
- Poppin Display
- Exhibit Systems
- Retailquip
- TDC The Display Co.
- Blue Sky Displays
- Hi-Tech Display Systems
- Expo Direct
Recent Developments
- In February 2025, Entain Venues launched a large-format commercial-grade LED display solution across Australia to enhance retail and entertainment venue experiences, marking a significant technology-focused product launch in the commercial display segment.
- In July 2024, Smurfit Kappa completed the acquisition of WestRock, forming one of the largest global sustainable packaging companies.
- In January 2025, Genesis opened its flagship Sydney showcase, establishing its largest retail presence and strengthening its role in premium PoP display and retail solutions.
Report Coverage
The research report offers an in-depth analysis based on Type, Application, Style, Material and Region. It details leading market players, providing an overview of their business, product offerings, investments, revenue streams, and key applications. Additionally, the report includes insights into the competitive environment, SWOT analysis, current market trends, as well as the primary drivers and constraints. Furthermore, it discusses various factors that have driven market expansion in recent years. The report also explores market dynamics, regulatory scenarios, and technological advancements that are shaping the industry. It assesses the impact of external factors and global economic changes on market growth. Lastly, it provides strategic recommendations for new entrants and established companies to navigate the complexities of the market.
Future Outlook
- Retailers will expand the use of floor and countertop displays to drive in-store sales.
- Temporary displays will remain dominant as FMCG brands continue seasonal and promotional campaigns.
- Permanent displays will grow steadily in cosmetics, electronics, and premium product categories.
- Sustainability will shape material choices, with corrugated board and recyclable formats gaining wider adoption.
- Digital integration such as QR codes and interactive screens will enhance consumer engagement.
- Food and beverage will sustain its leading application share with strong supermarket promotions.
- Pharmaceuticals and personal care products will increase adoption of compact countertop displays.
- Regional players will compete on customization, while national firms will focus on scalable solutions.
- Rising competition from e-commerce will push retailers to invest more in in-store experiences.
- Innovation in eco-design and customer-centric formats will define long-term market growth strategies.


