1. Preface
1.1. Report Description
1.1.1. Purpose of the Report
1.1.2. Target Audience
1.1.3. USP and Key Offerings
1.2. Research Scope
1.3. Research Methodology
1.3.1. Phase I – Secondary Research
1.3.2. Phase II – Primary Research
1.3.3. Phase III – Expert Panel Review
1.3.4. Approach Adopted
1.3.4.1. Top-Down Approach
1.3.4.2. Bottom-Up Approach
1.3.5. Assumptions
1.4. Market Segmentation
2. Executive Summary
2.1. Market Snapshot: Global Automated Microbiology Market
2.2. Global Automated Microbiology Market, By Technology
2.3. Global Automated Microbiology Market, By End Use
3. Market Dynamics & Factors Analysis
3.1. Introduction
3.1.1. Global Automated Microbiology Market Value, 2016-2028, (US$ Bn)
3.2. Market Dynamics
3.2.1. Key Growth Trends
3.2.2. Major Industry Challenges
3.2.3. Key Growth Pockets
3.3. Attractive Investment Proposition,2021
3.3.1. Technology
3.3.2. End Use
3.3.3. Geography
3.4. Porter’s Five Forces Analysis
3.4.1. Threat of New Entrants
3.4.2. Bargaining Power of Buyers/Consumers
3.4.3. Bargaining Power of Suppliers
3.4.4. Threat of Substitute Types
3.4.5. Intensity of Competitive Rivalry
3.5. Value Chain Analysis
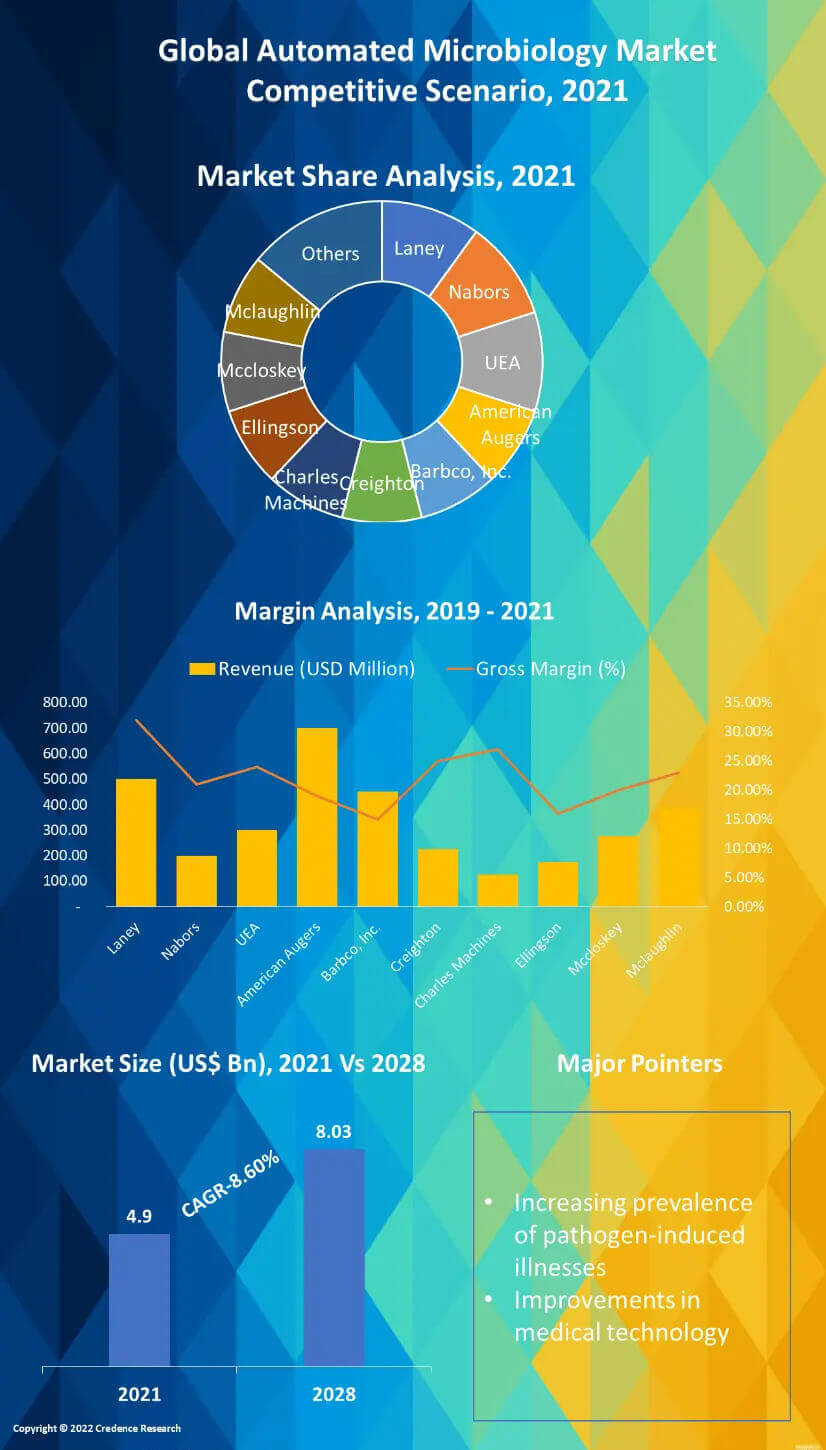
4. Market Positioning of Key Players, 2021
4.1. Company market share of key players, 2021
4.2. Competitive Benchmarking
4.3. Geographical Presence Analysis
4.4. Major Strategies Adopted by Key Players
4.4.1. Key Strategies Analysis
4.4.2. Mergers and Acquisitions
4.4.3. Partnerships
4.4.4. Product Launch
4.4.5. Geographical Expansion
4.4.6. Others
5. COVID 19 Impact Analysis
5.1. Global Automated Microbiology Market Pre Vs Post COVID 19, 2019 – 2028
5.2. Impact on Import & Export
5.3. Impact on Demand & Supply
6. Global
6.1. Global Automated Microbiology Market, by Technology , 2016-2028(US$ Bn)
6.1.1. Overview
6.1.2. DNA Sequencing
6.1.3. DNA and RNA Probe Technology
6.1.4. Detection Techniques
6.2. Global Automated Microbiology Market, by End Use, 2016-2028(US$ Bn)
6.2.1. Overview
6.2.2. Clinical Laboratories
6.2.3. Biotechnology Industries
6.2.4. Others
7. North America
7.1. North America Automated Microbiology Market, by Country, 2016-2028(US$ Bn)
7.1.1. U.S.
7.1.2. Canada
7.2. North America Automated Microbiology Market, by Technology , 2016-2028(US$ Bn)
7.2.1. Overview
7.2.2. DNA Sequencing
7.2.3. DNA and RNA Probe Technology
7.2.4. Detection Techniques
7.3. North America Automated Microbiology Market, by End Use, 2016-2028(US$ Bn)
7.3.1. Overview
7.3.2. Clinical Laboratories
7.3.3. Biotechnology Industries
7.3.4. Others
7.4. North America Automated Microbiology Market, by Country, 2016-2028 (US$ Bn)
7.4.1.1. U.S. Automated Microbiology Market Estimates and Forecast, 2016-2028 (US$ Bn)
7.4.1.2. U.S. Automated Microbiology, By Technology, 2016-2028 (US$ Bn)
7.4.1.3. U.S. Automated Microbiology, By End Uses, 2016-2028 (US$ Bn)
7.4.2. Canada
7.4.2.1. Canada Automated Microbiology Market Estimates and Forecast, 2016-2028 (US$ Bn)
7.4.2.2. Canada Automated Microbiology, By Technology, 2016-2028 (US$ Bn)
7.4.2.3. Canada Automated Microbiology, By End Uses, 2016-2028 (US$ Bn)
8. Europe
8.1. Europe Automated Microbiology Market, by Country, 2016-2028(US$ Bn)
8.1.1. UK
8.1.2. France
8.1.3. Germany
8.1.4. Italy
8.1.5. Spain
8.1.6. Rest of Europe
8.2. Europe Automated Microbiology Market, by Technology , 2016-2028(US$ Bn)
8.2.1. Overview
8.2.2. DNA Sequencing
8.2.3. DNA and RNA Probe Technology
8.2.4. Detection Techniques
8.3. Europe Automated Microbiology Market, by End Use, 2016-2028(US$ Bn)
8.3.1. Overview
8.3.2. Clinical Laboratories
8.3.3. Biotechnology Industries
8.3.4. Others
8.4. Europe Automated Microbiology Market, by Country, 2016-2028 (US$ Bn)
8.4.1. Germany
8.4.1.1. Germany Automated Microbiology Market Estimates and Forecast, 2016-2028 (US$ Bn)
8.4.1.2. Germany Automated Microbiology, By Technology, 2016-2028 (US$ Bn)
8.4.1.3. Germany Automated Microbiology, By End Uses, 2016-2028 (US$ Bn)
8.4.2. France
8.4.2.1. France Automated Microbiology Market Estimates and Forecast, 2016-2028 (US$ Bn)
8.4.2.2. France Automated Microbiology, By Technology, 2016-2028 (US$ Bn)
8.4.2.3. France Automated Microbiology, By End Uses, 2016-2028 (US$ Bn)
8.4.3. UK
8.4.3.1. UK Automated Microbiology Market Estimates and Forecast, 2016-2028 (US$ Bn)
8.4.3.2. UK Automated Microbiology, By Technology, 2016-2028 (US$ Bn)
8.4.3.3. UK Automated Microbiology, By End Uses, 2016-2028 (US$ Bn)
8.4.4. Italy
8.4.4.1. Italy Automated Microbiology Market Estimates and Forecast, 2016-2028 (US$ Bn)
8.4.4.2. Italy Automated Microbiology, By Technology, 2016-2028 (US$ Bn)
8.4.4.3. Italy Automated Microbiology, By End Uses, 2016-2028 (US$ Bn)
8.4.5. Spain
8.4.5.1. Spain Automated Microbiology Market Estimates and Forecast, 2016-2028 (US$ Bn)
8.4.5.2. Spain Automated Microbiology, By Technology, 2016-2028 (US$ Bn)
8.4.5.3. Spain Automated Microbiology, By End Uses, 2016-2028 (US$ Bn)
8.4.6. Rest of Europe
8.4.6.1. Rest of Europe Automated Microbiology Market Estimates and Forecast, 2016-2028 (US$ Bn)
8.4.6.2. Rest of Europe Automated Microbiology, By Technology, 2016-2028 (US$ Bn)
8.4.6.3. Rest of Europe Automated Microbiology, By End Uses, 2016-2028 (US$ Bn)
9. Asia Pacific
9.1. Asia Pacific Automated Microbiology Market, by Country, 2016-2028(US$ Bn)
9.1.1. China
9.1.2. Japan
9.1.3. South Korea
9.1.4. India
9.1.5. South East Asia
9.1.6. Rest of Asia Pacific
9.2. Asia Pacific Automated Microbiology Market, by Technology , 2016-2028(US$ Bn)
9.2.1. Overview
9.2.2. DNA Sequencing
9.2.3. DNA and RNA Probe Technology
9.2.4. Detection Techniques
9.3. Asia Pacific Automated Microbiology Market, by End Use, 2016-2028(US$ Bn)
9.3.1. Overview
9.3.2. Clinical Laboratories
9.3.3. Biotechnology Industries
9.3.4. Others
9.4. Asia Pacific Automated Microbiology Market, by Country, 2016-2028 (US$ Bn)
9.4.1. China
9.4.1.1. China Automated Microbiology Market Estimates and Forecast, 2016-2028 (US$ Bn)
9.4.1.2. China Automated Microbiology, By Technology, 2016-2028 (US$ Bn)
9.4.1.3. China Automated Microbiology, By End Uses, 2016-2028 (US$ Bn)
9.4.2. Japan
9.4.2.1. Japan Automated Microbiology Market Estimates and Forecast, 2016-2028 (US$ Bn)
9.4.2.2. Japan Automated Microbiology, By Technology, 2016-2028 (US$ Bn)
9.4.2.3. Japan Automated Microbiology, By End Uses, 2016-2028 (US$ Bn)
9.4.3. India
9.4.3.1. India Automated Microbiology Market Estimates and Forecast, 2016-2028 (US$ Bn)
9.4.3.2. India Automated Microbiology, By Technology, 2016-2028 (US$ Bn)
9.4.3.3. India Automated Microbiology, By End Uses, 2016-2028 (US$ Bn)
9.4.4. South Korea
9.4.4.1. South Korea Automated Microbiology Market Estimates and Forecast, 2016-2028 (US$ Bn)
9.4.4.2. South Korea Automated Microbiology, By Technology, 2016-2028 (US$ Bn)
9.4.4.3. South Korea Automated Microbiology, By End Uses, 2016-2028 (US$ Bn)
9.4.5. South-East Asia
9.4.5.1. South-East Asia Automated Microbiology Market Estimates and Forecast, 2016-2028 (US$ Bn)
9.4.5.2. South-East Asia Automated Microbiology, By Technology, 2016-2028 (US$ Bn)
9.4.5.3. South-East Asia Automated Microbiology, By End Uses, 2016-2028 (US$ Bn)
9.4.6. Rest of Asia Pacific
9.4.6.1. Rest of Asia Pacific Automated Microbiology Market Estimates and Forecast, 2016-2028 (US$ Bn)
9.4.6.2. Rest of Asia Pacific Automated Microbiology, By Technology, 2016-2028 (US$ Bn)
9.4.6.3. Rest of Asia Pacific Automated Microbiology, By End Uses, 2016-2028 (US$ Bn)
10. Latin America
10.1. Latin America Automated Microbiology Market, by Country, 2016-2028(US$ Bn)
10.1.1. Brazil
10.1.2. Mexico
10.1.3. Rest of Latin America
10.2. Latin America Automated Microbiology Market, by Technology , 2016-2028(US$ Bn)
10.2.1. Overview
10.2.2. DNA Sequencing
10.2.3. DNA and RNA Probe Technology
10.2.4. Detection Techniques
10.3. Latin America Automated Microbiology Market, by End Use, 2016-2028(US$ Bn)
10.3.1. Overview
10.3.2. Clinical Laboratories
10.3.3. Biotechnology Industries
10.3.4. Others
10.4. Latin America Automated Microbiology Market, by Country, 2016-2028 (US$ Bn)
10.4.1. Brazil
10.4.1.1. Brazil Automated Microbiology Market Estimates and Forecast, 2016-2028 (US$ Bn)
10.4.1.2. Brazil Automated Microbiology, By Technology, 2016-2028 (US$ Bn)
10.4.1.3. Brazil Automated Microbiology, By End Uses, 2016-2028 (US$ Bn)
10.4.2. Mexico
10.4.2.1. Mexico Automated Microbiology Market Estimates and Forecast, 2016-2028 (US$ Bn)
10.4.2.2. Mexico Automated Microbiology, By Technology, 2016-2028 (US$ Bn)
10.4.2.3. Mexico Automated Microbiology, By End Uses, 2016-2028 (US$ Bn)
10.4.3. Rest of Latin America
10.4.3.1. Rest of Latin America Automated Microbiology Market Estimates and Forecast, 2016-2028 (US$ Bn)
10.4.3.2. Rest of Latin America Automated Microbiology, By Technology, 2016-2028 (US$ Bn)
10.4.3.3. Rest of Latin America Automated Microbiology, By End Uses, 2016-2028 (US$ Bn)
11. Middle East & Africa
11.1. Middle East & Africa Automated Microbiology Market, by Country, 2016-2028(US$ Bn)
11.1.1. GCC Countries
11.1.2. South Africa
11.1.3. Rest of Middle East & Africa
11.2. Middle East & Africa Automated Microbiology Market, by Technology , 2016-2028(US$ Bn)
11.2.1. Overview
11.2.2. DNA Sequencing
11.2.3. DNA and RNA Probe Technology
11.2.4. Detection Techniques
11.3. Middle East & Africa Automated Microbiology Market, by End Use, 2016-2028(US$ Bn)
11.3.1. Overview
11.3.2. Clinical Laboratories
11.3.3. Biotechnology Industries
11.3.4. Others
11.4. Middle East & Africa & Africa and Africa Automated Microbiology Market, by Country, 2016-2028 (US$ Bn)
11.4.1. GCC Countries
11.4.1.1. GCC Countries il Automated Microbiology Market Estimates and Forecast, 2016-2028 (US$ Bn)
11.4.1.2. GCC Countries Automated Microbiology, By Technology, 2016-2028 (US$ Bn)
11.4.1.3. GCC Countries Automated Microbiology, By End Uses, 2016-2028 (US$ Bn)
11.4.1.4. GCC Countries Automated Microbiology, By Deployment, 2016-2028 (US$ Bn)
11.4.1.5. GCC Countries Automated Microbiology, By Platform, 2016-2028 (US$ Bn)
11.4.1.6. GCC Countries Automated Microbiology, By End Use, 2016-2028 (US$ Bn)
11.4.2. South Africa
11.4.2.1. South Africa Automated Microbiology Market Estimates and Forecast, 2016-2028 (US$ Bn)
11.4.2.2. South Africa Automated Microbiology, By Technology, 2016-2028 (US$ Bn)
11.4.2.3. South Africa Automated Microbiology, By End Uses, 2016-2028 (US$ Bn)
11.4.2.4. South Africa Automated Microbiology, By Deployment, 2016-2028 (US$ Bn)
11.4.2.5. South Africa Automated Microbiology, By Platform, 2016-2028 (US$ Bn)
11.4.2.6. South Africa Automated Microbiology, By End Use, 2016-2028 (US$ Bn)
11.4.3. Rest of Middle East & Africa & Africa and Africa
11.4.3.1. Rest of Middle East & Africa & Africa and Africa Automated Microbiology Market Estimates and Forecast, 2016-2028 (US$ Bn)
11.4.3.2. Rest of Middle East & Africa & Africa and Africa Automated Microbiology, By Technology, 2016-2028 (US$ Bn)
11.4.3.3. Rest of Middle East & Africa & Africa and Africa Automated Microbiology, By End Uses, 2016-2028 (US$ Bn)
11.4.3.4. Rest of Middle East & Africa & Africa and Africa Automated Microbiology, By Deployment, 2016-2028 (US$ Bn)
11.4.3.5. Rest of Middle East & Africa & Africa and Africa Automated Microbiology, By Platform, 2016-2028 (US$ Bn)
11.4.3.6. Rest of Middle East & Africa & Africa and Africa Respiratory Syncytial Virus
12. Company Profiles
12.1. Becton Dickinson and Company
12.2. Bio-Rad Laboratories
12.3. bioMeriux, Inc.
12.4. QIAGEN GmbH
12.5. Beckman Coulter
12.6. Agilent Technologies, Inc
12.7. Gene-Probe, Inc
12.8. Affymetrix, Inc
12.9. Abbott Laboratories
12.10. Others
List of Figures
FIG. 1 Global Automated Microbiology Market: Research Methodology
FIG. 2 Market Size Estimation – Top Down & Bottom up Approach
FIG. 3 Global Automated Microbiology Market Segmentation
FIG. 4 Global Automated Microbiology Market, by Technology, 2021 (US$ Bn)
FIG. 5 Global Automated Microbiology Market, by End Use, 2021 (US$ Bn)
FIG. 6 Global Automated Microbiology Market, by Geography, 2021 (US$ Bn)
FIG. 7 Attractive Investment Proposition, by Technology, 2021
FIG. 8 Attractive Investment Proposition, by End Use, 2021
FIG. 9 Attractive Investment Proposition, by Geography, 2021
FIG. 10 Global Market Positioning of Key Automated Microbiology Market Manufacturers, 2019
FIG. 11 Global Automated Microbiology Market Value Contribution, By Technology, 2021 & 2028 (Value %)
FIG. 12 Global Automated Microbiology Market, by DNA Sequencing, Value, 2016-2028 (US$ Bn)
FIG. 13 Global Automated Microbiology Market, by DNA and RNA Probe Technology, Value, 2016-2028 (US$ Bn)
FIG. 14 Global Automated Microbiology Market, by Detection Techniques, Value, 2016-2028 (US$ Bn)
FIG. 15 Global Automated Microbiology Market Value Contribution, By End Use, 2021 & 2028 (Value %)
FIG. 16 Global Automated Microbiology Market, by Clinical Laboratories, Value, 2016-2028 (US$ Bn)
FIG. 17 Global Automated Microbiology Market, by Biotechnology Industries, Value, 2016-2028 (US$ Bn)
FIG. 18 Global Automated Microbiology Market, by Others, Value, 2016-2028 (US$ Bn)
FIG. 19 U.S. Automated Microbiology Market, 2016-2028 (US$ Bn)
FIG. 20 Canada Automated Microbiology Market, 2016-2028 (US$ Bn)
FIG. 21 U.K. Automated Microbiology Market, 2016-2028 (US$ Bn)
FIG. 22 Germany Automated Microbiology Market, 2016-2028 (US$ Bn)
FIG. 23 France Automated Microbiology Market, 2016-2028 (US$ Bn)
FIG. 24 Italy Automated Microbiology Market, 2016-2028 (US$ Bn)
FIG. 25 Spain Automated Microbiology Market, 2016-2028 (US$ Bn)
FIG. 26 Rest of Europe Automated Microbiology Market, 2016-2028 (US$ Bn)
FIG. 27 Japan Automated Microbiology Market, 2016-2028 (US$ Bn)
FIG. 28 China Automated Microbiology Market, 2016-2028 (US$ Bn)
FIG. 29 India Automated Microbiology Market, 2016-2028 (US$ Bn)
FIG. 30 South Korea Automated Microbiology Market, 2016-2028 (US$ Bn)
FIG. 31 Southeast Asia Automated Microbiology Market, 2016-2028 (US$ Bn)
FIG. 32 Rest of Asia Pacific Automated Microbiology Market, 2016-2028 (US$ Bn)
FIG. 33 Middle East & Africa & Africa Automated Microbiology Market, 2016-2028 (US$ Bn)
FIG. 34 South Africa Automated Microbiology Market, 2016-2028 (US$ Bn)
FIG. 35 GCC Automated Microbiology Market, 2016-2028 (US$ Bn)
FIG. 36 Rest of Middle East & Africa Automated Microbiology Market, 2016-2028 (US$ Bn)
FIG. 37 Latin America Automated Microbiology Market, 2016-2028 (US$ Bn)
FIG. 38 Brazil Automated Microbiology Market, 2016-2028 (US$ Bn)
FIG. 39 Mexico Automated Microbiology Market, 2016-2028 (US$ Bn)
FIG. 40 Rest of Latin AMerica Automated Microbiology Market, 2016-2028 (US$ Bn)
List of Tables
TABLE 1 Market Snapshot: Global Automated Microbiology Market
TABLE 2 Global Automated Microbiology Market, by Competitive Benchmarking, 2021
TABLE 3 Global Automated Microbiology Market, by Geographical Presence Analysis, 2021
TABLE 4 Global Automated Microbiology Market, by Key Strategies Analysis, 2021
TABLE 5 Global Automated Microbiology Market, by Technology, 2016-2028 (US$ Mn)
TABLE 6 Global Automated Microbiology Market, by End Uses, 2016-2028 (US$ Mn)
TABLE 7 Global Automated Microbiology Market, by Geography, 2016-2028 (US$ Mn)
TABLE 8 North America Automated Microbiology Market, by Technology, 2016-2028 (US$ Mn)
TABLE 9 North America Automated Microbiology Market, by End Uses, 2016-2028 (US$ Mn)
TABLE 10 North America Automated Microbiology Market, by Country, 2016-2028 (US$ Mn)
TABLE 11 US Automated Microbiology Market, by Technology, 2016-2028 (US$ Bn)
TABLE 12 US Automated Microbiology Market, by End Use, 2016-2028 (US$ Bn)
TABLE 13 Canada Automated Microbiology Market, by Technology, 2016-2028 (US$ Bn)
TABLE 14 Canada Automated Microbiology Market, by End Use, 2016-2028 (US$ Bn)
TABLE 15 Europe Automated Microbiology Market, by Technology, 2016-2028 (US$ Mn)
TABLE 16 Europe Automated Microbiology Market, by End Uses, 2016-2028 (US$ Mn)
TABLE 17 Europe Automated Microbiology Market, by Country/Region, 2016-2028 (US$ Mn)
TABLE 18 Germany Automated Microbiology Market, by Technology, 2016-2028 (US$ Bn)
TABLE 19 Germany Automated Microbiology Market, by End Use, 2016-2028 (US$ Bn)
TABLE 20 France Automated Microbiology Market, by Technology, 2016-2028 (US$ Bn)
TABLE 21 France Automated Microbiology Market, by End Use, 2016-2028 (US$ Bn)
TABLE 22 UK Automated Microbiology Market, by Technology, 2016-2028 (US$ Bn)
TABLE 23 UK Automated Microbiology Market, by End Use, 2016-2028 (US$ Bn)
TABLE 24 Italy Automated Microbiology Market, by Technology, 2016-2028 (US$ Bn)
TABLE 25 Italy Automated Microbiology Market, by End Use, 2016-2028 (US$ Bn)
TABLE 26 Spain Automated Microbiology Market, by Technology, 2016-2028 (US$ Bn)
TABLE 27 Spain Automated Microbiology Market, by End Use, 2016-2028 (US$ Bn)
TABLE 28 Rest of Europe Automated Microbiology Market, by Technology, 2016-2028 (US$ Bn)
TABLE 29 Rest of Europe Automated Microbiology Market, by End Use, 2016-2028 (US$
TABLE 30 Asia Pacific Automated Microbiology Market, by Country/Region, 2016-2028 (US$ Mn)
TABLE 31 Asia Pacific Automated Microbiology Market, by Country/Region, 2016-2028 (US$ Bn)
TABLE 32 China Automated Microbiology Market, by Technology, 2016-2028 (US$ Bn)
TABLE 33 China Automated Microbiology Market, by End Use, 2016-2028 (US$ Bn)
TABLE 34 Japan Automated Microbiology Market, by Technology, 2016-2028 (US$ Bn)
TABLE 35 Japan Automated Microbiology Market, by End Use, 2016-2028 (US$ Bn)
TABLE 36 India Automated Microbiology Market, by Technology, 2016-2028 (US$ Bn)
TABLE 37 India Automated Microbiology Market, by End Use, 2016-2028 (US$ Bn)
TABLE 38 South Korea Automated Microbiology Market, by Technology, 2016-2028 (US$ Bn)
TABLE 39 South Korea Automated Microbiology Market, by End Use, 2016-2028 (US$ Bn)
TABLE 40 South East Asia Automated Microbiology Market, by End Use, 2016-2028 (US$ Bn)
TABLE 41 Rest of Asia Pacific Automated Microbiology Market, by Technology, 2016-2028 (US$ Bn)
TABLE 42 Rest of Asia Pacific Automated Microbiology Market, by End Use, 2016-2028 (US$ Bn)
TABLE 43 Latin America Automated Microbiology Market, by Technology, 2016-2028 (US$ Mn)
TABLE 44 Latin America Automated Microbiology Market, by End Uses, 2016-2028 (US$ Mn)
TABLE 45 Latin America Automated Microbiology Market, by Country/Region, 2016-2028 (US$ Mn)
TABLE 46 Brazil Automated Microbiology Market, by Technology, 2016-2028 (US$ Bn)
TABLE 47 Brazil Automated Microbiology Market, by End Use, 2016-2028 (US$ Bn)
TABLE 48 Mexico Automated Microbiology Market, by Technology, 2016-2028 (US$ Bn)
TABLE 49 Mexico Automated Microbiology Market, by End Use, 2016-2028 (US$ Bn)
TABLE 50 Rest of Latin America Automated Microbiology Market, by Technology, 2016-2028 (US$ Bn)
TABLE 51 Rest of Latin America Automated Microbiology Market, by End Use, 2016-2028 (US$ Bn)
TABLE 52 Middle East & Africa Automated Microbiology Market, by Technology, 2016-2028 (US$ Mn)
TABLE 53 Middle East & Africa Automated Microbiology Market, by End Uses, 2016-2028 (US$ Mn)
TABLE 54 Middle East & Africa Automated Microbiology Market, by Country/Region, 2016-2028 (US$ Mn)
TABLE 55 GCC Countries Automated Microbiology Market, by Technology, 2016-2028 (US$ Bn)
TABLE 56 GCC Countries Automated Microbiology Market, by Deployment, 2016-2028 (US$ Bn)
TABLE 57 GCC Countries Automated Microbiology Market, by Platform, 2016-2028 (US$ Bn)
TABLE 58 GCC Countries Automated Microbiology Market, by End Use, 2016-2028 (US$ Bn)
TABLE 59 South Africa Automated Microbiology Market, by Technology, 2016-2028 (US$ Bn)
TABLE 60 South Africa Automated Microbiology Market, by End Use, 2016-2028 (US$ Bn)
TABLE 61 Rest of Middle East and Africa Automated Microbiology Market, by Technology, 2016-2028 (US$ Bn)
TABLE 62 Rest of Middle East and Africa Automated Microbiology Market, by End Use, 2016-2028 (US$ Bn)