| REPORT ATTRIBUTE |
DETAILS |
| Historical Period |
2020-2023 |
| Base Year |
2024 |
| Forecast Period |
2025-2032 |
| Automotive Rear Lights Market Size 2024 |
USD 14,066.63 Million |
| Automotive Rear Lights Market, CAGR |
5.3% |
| Automotive Rear Lights Market Size 2032 |
USD 21,217.77 Million |
Market Overview:
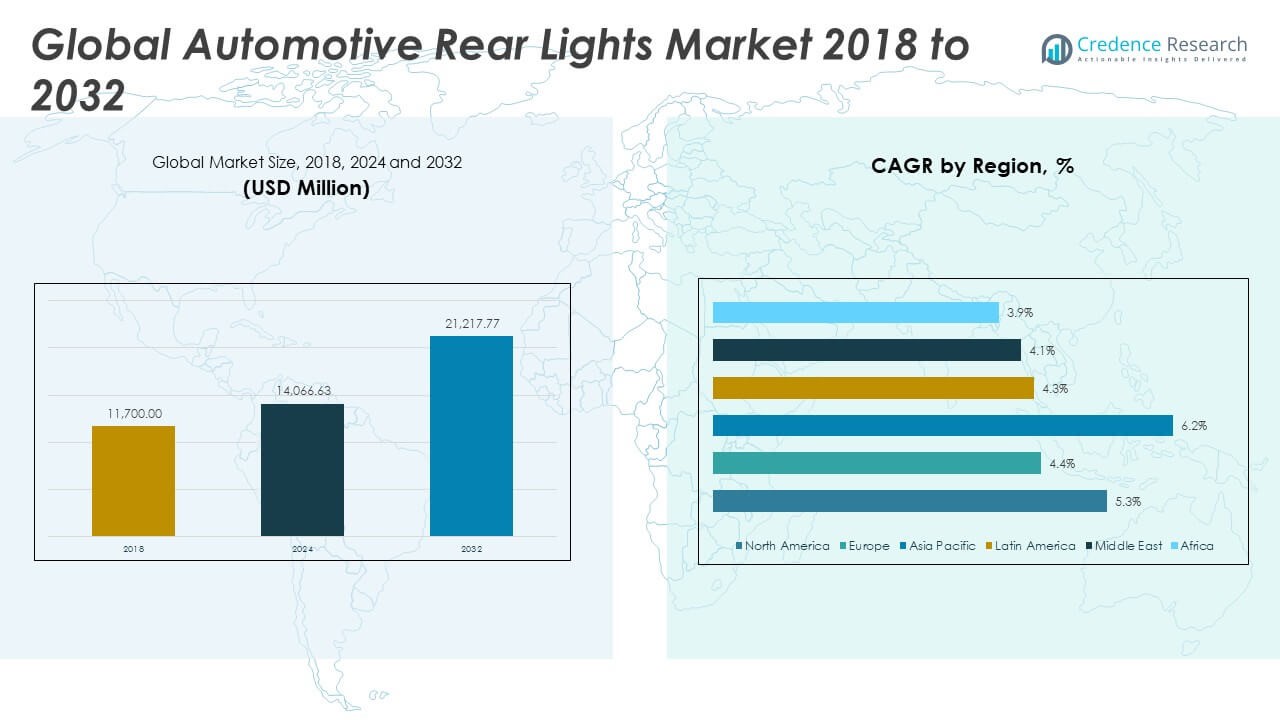
The Global Automotive Rear Lights Market size was valued at USD 11,700.00 million in 2018 to USD 14,066.63 million in 2024 and is anticipated to reach USD 21,217.77 million by 2032, at a CAGR of 5.3% during the forecast period.
The Global Automotive Rear Lights Market is primarily driven by the convergence of safety regulations, evolving consumer preferences, and rapid advancements in lighting technologies. Governments across North America, Europe, and Asia-Pacific have introduced stringent regulations that mandate higher standards for vehicle lighting to reduce accidents and improve road visibility. In parallel, the rise in electric and hybrid vehicles has heightened demand for power-efficient lighting systems, particularly LED-based rear lights that align with the energy conservation goals of EV manufacturers. Consumer demand for sleek, futuristic vehicle designs has also prompted automakers to focus on aesthetics, further supporting the adoption of integrated, stylized lighting units. Additionally, advancements in smart lighting technologies and connected vehicle ecosystems are pushing manufacturers to incorporate adaptive lighting systems that respond to driving conditions and vehicle behavior in real time.
Regionally, the Global Automotive Rear Lights Market demonstrates varying dynamics. North America and Europe currently dominate the market in terms of revenue, supported by stringent safety standards, high per capita vehicle ownership, and robust demand for premium vehicles. The United States and Germany serve as key hubs for innovation and early adoption of advanced rear-lighting solutions. Meanwhile, the Asia-Pacific region is expected to witness the fastest growth, driven by rapid urbanization, expanding vehicle production, and rising disposable incomes in countries such as China and India. OEM expansion, coupled with a thriving aftermarket segment, supports strong demand in this region. Latin America, the Middle East, and Africa are also gradually contributing to global market growth, spurred by growing automotive penetration and increasing government focus on vehicle safety standards. These regions offer untapped potential, particularly for cost-efficient and energy-saving rear-lighting solutions.
Access crucial information at unmatched prices!
Request your sample report today & start making informed decisions powered by Credence Research Inc.!
Download Sample
Market Insights:
- The Global Automotive Rear Lights Market grew from USD 11,700.00 million in 2018 to USD 14,066.63 million in 2024 and is projected to reach USD 21,217.77 million by 2032, registering a CAGR of 5.3%.
- Stringent road safety regulations in North America, Europe, and Asia-Pacific are compelling automakers to adopt high-performance rear lighting systems with faster response and better visibility.
- The rapid shift from halogen to LED and OLED rear lights offers manufacturers opportunities for energy efficiency, extended durability, and advanced styling features.
- Rising vehicle ownership and commercial fleet expansion are generating sustained demand for rear light units, both in OEM production lines and the aftermarket segment.
- The emergence of electric and autonomous vehicles is driving innovation in rear lights, with demand for smart, animated, and communicative lighting systems to enhance road interaction.
- High costs of advanced lighting technologies and the complexity of evolving designs limit adoption in budget vehicle segments, especially across cost-sensitive emerging markets.
- Regional variation in rear lighting regulations and ongoing supply chain disruptions increase development complexity and delay time-to-market, creating operational challenges for global manufacturers.
Market Drivers:
Enforcement of Road Safety Regulations and Lighting Mandates:
Governments across key automotive regions are tightening safety regulations and emphasizing proper vehicle lighting to reduce road accidents. Regulatory authorities in the United States, Europe, and Asia Pacific are mandating the adoption of high-visibility, fast-responding rear lighting systems. This is propelling OEMs and suppliers to develop technologically advanced lighting solutions that meet these evolving standards. The Global Automotive Rear Lights Market is experiencing increased R&D investments in compliance-oriented rear light systems.
- For instance, in October 2024, China introduced new mandatory national GB standards for automotive lighting devices, including “GB 4599-2024,” which covers automobile road lighting devices, requiring CCC certification for market access.
Shift Towards LED and Advanced Illumination Technologies:
The transition from traditional halogen to LED and OLED technologies is accelerating across vehicle segments. LED rear lights offer advantages such as lower power consumption, longer lifespan, faster illumination, and enhanced design flexibility. Automakers are increasingly adopting these technologies to align with consumer expectations and sustainability goals. The Global Automotive Rear Lights Market is seeing increased production volumes and declining costs of LED components, making them more accessible.
- For instance, Volkswagen reports using LED lights rated at up to 100 lumens per watt, with high-quality automotive LEDs typically lasting between 25,000 and 50,000 hours under normal operating conditions.
Growth in Global Vehicle Ownership and Fleet Expansion:
Expanding vehicle ownership, both in developed and developing economies, is directly contributing to the rising demand for rear lights. Increased demand from commercial fleet operators and ride-sharing companies is driving OEM production and aftermarket sales. The Global Automotive Rear Lights Market is leveraging this growth by offering scalable lighting systems that can be customized across vehicle platforms.
Surge in Electric and Autonomous Vehicles Supporting Rear Light Innovation:
Electric and autonomous vehicle platforms require modern lighting solutions that match their unique design and functional requirements. Rear lights in such vehicles must not only ensure visibility but also communicate intentions to other road users. This is prompting manufacturers to integrate features such as animated signals and smart control systems. The Global Automotive Rear Lights Market is actively developing adaptive rear lights tailored for EV and AV applications.
Market Trends:
Emergence of OLED Rear Lighting in Premium Vehicles:
OEMs are introducing OLED rear lighting systems in premium models to differentiate their brand identity and improve vehicle appeal. OLEDs offer uniform brightness, thin profiles, and design flexibility. These attributes are ideal for luxury segments that emphasize aesthetics and advanced features. The Global Automotive Rear Lights Market is observing early adoption of OLEDs in vehicles by brands such as Audi, BMW, and Mercedes-Benz.
- For instance, Audi was the first automaker to debut OLED rear lights in production vehicles, launching this innovation in the Audi TT RS in 2016. The OLED lighting panel in these models is just 1 millimeter thick—significantly thinner than conventional LED units, which often range from 20 to 30 millimeters in thickness.
Aesthetic Customization Becoming a Key Purchase Driver:
Automotive lighting is increasingly viewed as an element of vehicle personalization. Consumers seek vehicles with rear lighting that reflects brand identity and individual taste. Automakers are responding by offering dynamic lighting sequences, signature light bars, and customization options. The Global Automotive Rear Lights Market is capitalizing on this demand by expanding product portfolios that support programmable lighting and visual effects.
- For instance, BMW offers select models featuring programmable OLED rear lights, which allow for customizable light signatures and animated welcome or goodbye sequences. Audi’s digital OLED technology in the Q5 enables drivers to choose from multiple rear light configurations, providing a new degree of personalization while maintaining safety standards.
Smart Lighting Integration with Connected Vehicle Ecosystems:
Rear lights are evolving into active components within connected vehicle platforms. These systems support Vehicle-to-Vehicle (V2V) and Vehicle-to-Infrastructure (V2I) communication, improving road safety and traffic efficiency. Smart rear lights can alert surrounding vehicles about braking, lane changes, or hazards. The Global Automotive Rear Lights Market is prioritizing innovation in communication-enabled lighting systems for autonomous and semi-autonomous vehicles.
Use of Lightweight and Recyclable Materials in Light Housings:
Sustainability is a growing focus across the automotive sector, influencing component design and materials. Rear lights are now being developed using recyclable plastics and lightweight composites to reduce vehicle weight and environmental impact. The Global Automotive Rear Lights Market is supporting these trends by adopting eco-friendly materials that meet performance, safety, and regulatory standards.
Market Challenges Analysis:
High Cost of Advanced Technologies and Design Complexity Limits Adoption in Price-Sensitive Markets:
The Global Automotive Rear Lights Market faces a significant challenge due to the high production cost of advanced lighting technologies such as LED, OLED, and laser-based systems. While these innovations offer enhanced energy efficiency, design flexibility, and safety, their integration often increases the overall cost of vehicles. This restricts adoption in entry-level and budget vehicle segments, particularly in emerging economies where cost sensitivity remains high. Manufacturers must also invest heavily in R&D and tooling to accommodate evolving lighting formats, increasing the financial burden on suppliers and OEMs. The design complexity of modern rear lights, including adaptive and dynamic features, further drives up engineering and compliance costs. It creates barriers for smaller manufacturers who struggle to meet regulatory demands without inflating product prices.
Supply Chain Disruptions and Regulatory Variations Impact Consistency and Market Entry:
The Global Automotive Rear Lights Market also faces supply chain instability and inconsistent global regulations that challenge uniform product development. Global semiconductor shortages and material sourcing issues disrupt the timely manufacturing and delivery of lighting components. It creates delays in OEM production schedules and increases the risk of inventory backlogs. Regulatory standards for rear lighting differ widely across regions, requiring manufacturers to tailor products to specific country codes, increasing production complexity and limiting economies of scale. Certification processes in Europe, North America, and parts of Asia are particularly stringent, lengthening product rollout timelines. This fragmented regulatory landscape deters market entry for new players and complicates the global expansion strategies of established companies. Meeting performance, durability, and environmental compliance simultaneously remains an ongoing challenge for the industry.
Market Opportunities:
Expansion of Electric Vehicles and Demand for Energy-Efficient Lighting Create Growth Potential:
The Global Automotive Rear Lights Market has strong opportunities tied to the accelerating adoption of electric vehicles (EVs) and hybrid vehicles worldwide. EV manufacturers are prioritizing lightweight, energy-efficient components, creating increased demand for LED and OLED rear lighting systems. These technologies consume less power, align with EV performance goals, and offer flexible design capabilities. The trend toward vehicle electrification opens new avenues for suppliers to develop compact, modular lighting units optimized for electric platforms. Governments offering EV subsidies further strengthen this shift, expanding the market base. The focus on sustainability also supports interest in recyclable and low-power lighting materials.
Integration of Smart Technologies and Customization Supports Premium Segment Growth:
The Global Automotive Rear Lights Market also benefits from rising consumer interest in vehicle personalization and connected technologies. Automakers and suppliers are developing rear lights with adaptive functions, programmable light signatures, and communication features integrated into vehicle networks. It enables real-time responses such as dynamic turn signals or safety alerts, increasing functionality and brand differentiation. The luxury and premium vehicle segments are driving this trend, offering higher margins and broader innovation scope. Smart rear-light systems also align with autonomous driving advancements, where lighting plays a critical role in external signaling. These developments create new value streams for both OEMs and component manufacturers.
Market Segmentation Analysis:
By Type of Product
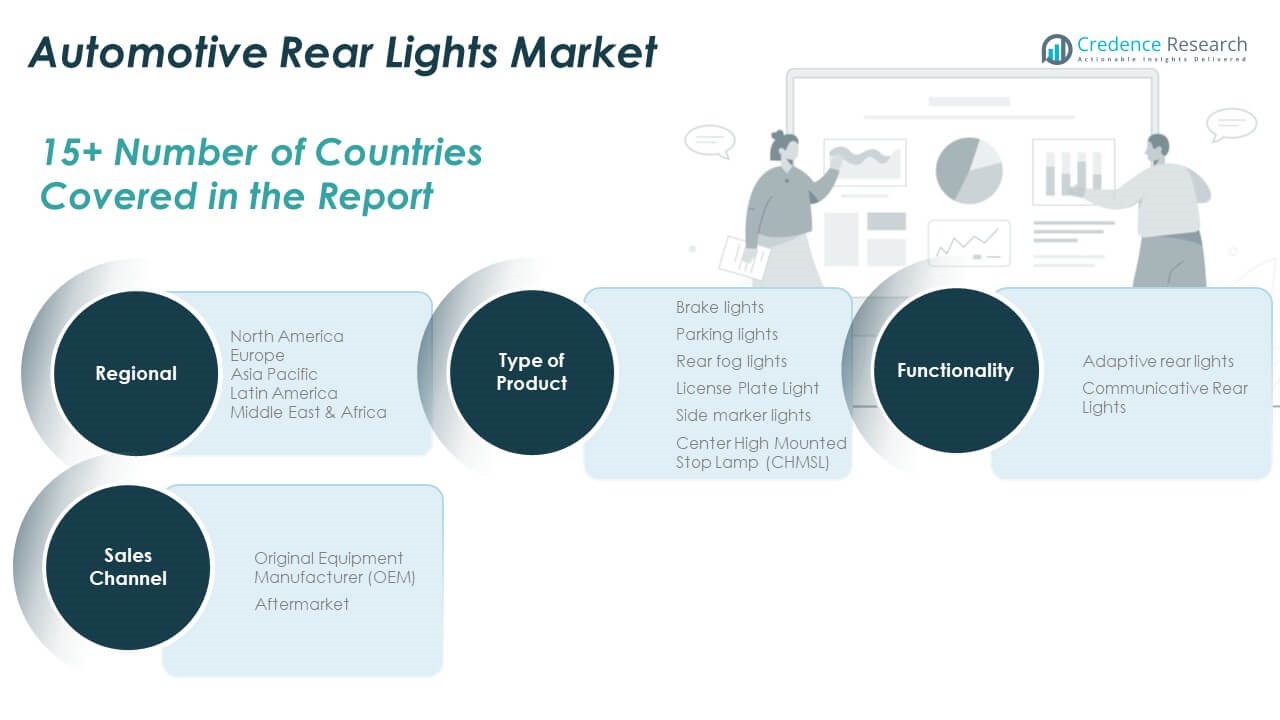
The Global Automotive Rear Lights Market includes a diverse range of product types, each serving critical visibility and safety functions. Brake lights dominate the segment due to regulatory requirements and their role in preventing rear-end collisions. Parking lights and rear fog lights contribute to enhanced vehicle visibility in stationary and low-visibility conditions. License plate lights remain mandatory for compliance with road safety standards. Side marker lights improve lateral visibility and are increasingly used in both passenger and commercial vehicles. Center High Mounted Stop Lamps (CHMSLs) are gaining adoption across vehicle classes due to their effectiveness in enhancing brake signaling.
- For instance, research by the National Highway Traffic Safety Administration (NHTSA) in the US has shown that the introduction of CHMSLs led to a significant reduction in rear-end collisions, emphasizing the effectiveness of such requirements in improving road safety.
By Functionality
Rear light systems are evolving beyond basic illumination to include advanced functionalities. Adaptive rear lights are gaining traction with their ability to adjust brightness, beam pattern, or response based on driving conditions, vehicle speed, or load. This segment reflects rising consumer demand for intelligent safety features. Communicative rear lights, designed for vehicle-to-vehicle signaling and integration into connected mobility ecosystems, are seeing increased attention, especially in electric and autonomous vehicle applications.
- For instance, the Audi Q5 with digital OLED rear lights incorporates proximity-based lighting warnings, changing the light signature if another vehicle approaches within two meters of the rear, providing real-time visual alerts to other road users. Adaptive rear lighting control modules from leading suppliers, such as Hella, adjust beam intensity and direction based on real-time inputs from vehicle sensors, optimizing visibility and driver communication.
By Sales Channel
The sales channel segment comprises Original Equipment Manufacturers (OEMs) and the Aftermarket. OEMs account for the largest share due to their integration of advanced lighting during vehicle production. It allows for close alignment with regulatory standards and brand aesthetics. The aftermarket remains active, driven by replacement needs and growing interest in retrofitting older vehicles with modern LED and adaptive lighting technologies.
Segmentation:
By Type of Product
- Brake Lights
- Parking Lights
- Rear Fog Lights
- Licence Plate Light
- Side Marker Lights
- Center High Mounted Stop Lamp (CHMSL)
By Functionality
- Adaptive Rear Lights
- Communicative Rear Lights
By Sales Channel
- Original Equipment Manufacturer (OEM)
- Aftermarket
By Region and Country
- North America:
- Europe:
- UK
- France
- Germany
- Italy
- Spain
- Russia
- Rest of Europe
- Asia Pacific:
- China
- Japan
- South Korea
- India
- Australia
- Southeast Asia
- Rest of Asia Pacific
- Latin America:
- Brazil
- Argentina
- Rest of Latin America
- Middle East:
- GCC Countries
- Israel
- Turkey
- Rest of Middle East
- Africa:
- South Africa
- Egypt
- Rest of Africa
Regional Analysis:
North America
The North America Automotive Rear Lights Market size was valued at USD 3,100.50 million in 2018, reaching USD 3,665.68 million in 2024, and is expected to hit USD 5,518.78 million by 2032, at a CAGR of 5.3%. The Global Automotive Rear Lights Market in this region is driven by strong demand for high-performance vehicles, LED lighting integration, and regulatory compliance with DOT and FMVSS standards. OEM investments in advanced lighting and EV growth are also boosting regional demand.
Europe
The Europe Automotive Rear Lights Market size was valued at USD 2,609.10 million in 2018, rising to USD 2,993.00 million in 2024, and forecasted to reach USD 4,217.09 million by 2032, at a CAGR of 4.4%. The market benefits from premium vehicle production, innovation in smart lighting, and adherence to ECE regulations. The Global Automotive Rear Lights Market in Europe emphasizes safety, design excellence, and brand differentiation.
Asia Pacific
The Asia Pacific Automotive Rear Lights Market size was valued at USD 4,305.60 million in 2018, reaching USD 5,329.09 million in 2024, and projected to hit USD 8,599.58 million by 2032, at a CAGR of 6.2%. It holds the largest market share due to high automotive production and strong aftermarket activity. The Global Automotive Rear Lights Market in this region benefits from rapid urbanization, economic growth, and increasing vehicle ownership.
Latin America
The Latin America Automotive Rear Lights Market size was valued at USD 726.57 million in 2018, increased to USD 864.96 million in 2024, and is expected to reach USD 1,208.78 million by 2032, at a CAGR of 4.3%. Brazil and Mexico lead demand, supported by local assembly plants and expanding road infrastructure. The Global Automotive Rear Lights Market in Latin America is gaining momentum due to OEM localization strategies.
Middle East
The Middle East Automotive Rear Lights Market size was USD 505.44 million in 2018, rose to USD 573.83 million in 2024, and is anticipated to reach USD 791.54 million by 2032, at a CAGR of 4.1%. Luxury vehicle imports and highway expansions drive regional demand. The Global Automotive Rear Lights Market is supported by partnerships between OEMs and regional distributors.
Africa
The Africa Automotive Rear Lights Market size was USD 452.79 million in 2018, reaching USD 640.09 million in 2024, and projected to reach USD 882.01 million by 2032, at a CAGR of 3.9%. The market is emerging, driven by imported vehicles and increasing urban mobility. The Global Automotive Rear Lights Market in Africa presents long-term growth opportunities as automotive infrastructure develops.
Shape Your Report to Specific Countries or Regions & Enjoy 30% Off!
Key Player Analysis:
- Stanley Electric
- HELLA GmbH & Co. KGaA
- Koito Manufacturing Co., Ltd.
- Valeo S.A.S.
- Faurecia
- Varroc Group
- OSRAM Automotive
- Koninklijke Philips N.V.
- Infineon Technologies AG
- Samsung Electronics
- LG Electronics
Competitive Analysis:
The Global Automotive Rear Lights Market features a concentrated competitive landscape dominated by established automotive lighting manufacturers. Key players include Stanley Electric, HELLA GmbH & Co. KGaA, Koito Manufacturing Co., Ltd., Valeo S.A.S., and OSRAM Automotive. These companies maintain strong OEM partnerships and invest heavily in R&D to advance LED, OLED, and adaptive lighting technologies. It fosters innovation in energy efficiency, design flexibility, and safety compliance. Competitive differentiation is driven by technological capabilities, product customization, regulatory alignment, and integration with connected vehicle systems. Emerging players and regional suppliers are entering the market with cost-effective solutions, targeting aftermarket and budget vehicle segments. Strategic mergers, acquisitions, and collaborations are common, allowing companies to expand geographic reach and accelerate product development. The market remains dynamic, with innovation speed and global supply chain efficiency determining long-term competitive advantage.
Recent Developments:
- In April 2025, Stanley Electric and Mitsubishi Electric Mobility officially signed an integration agreement to establish a new joint venture focused on lamp systems for next-generation vehicles. The collaboration will combine Stanley Electric’s expertise in automotive lamp systems with Mitsubishi Electric Mobility’s control components, aiming to enhance innovations in both four- and two-wheel vehicle lighting. This joint venture is expected to commence operations in the first half of fiscal year 2025.
- In January 2025, Koito Manufacturing Co., Ltd. completed a significant acquisition by purchasing all remaining outstanding shares of Cepton, Inc., a key provider of lidar-based solutions for automotive lighting and safety. The transaction makes Cepton a wholly owned subsidiary of Koito, expanding Koito’s capabilities in advanced sensor integration and automotive rear lighting innovation.
- In March 2025, Valeo S.A.S. announced a global collaboration with TactoTek to integrate In-Mold Structural Electronics (IMSE®) into new automotive lighting solutions. This partnership will enable Valeo to offer OEMs unique interior and exterior lighting options with dynamic displays and enhanced safety features, marking a step forward in modular and customizable rear lighting technology for vehicles.
Market Concentration & Characteristics:
The Global Automotive Rear Lights Market exhibits moderate to high market concentration, with a few dominant players controlling a significant share of global revenue. It is characterized by strong OEM alliances, continuous innovation in lighting technologies, and strict regulatory compliance. Leading manufacturers focus on LED, OLED, and adaptive systems to meet evolving safety and energy efficiency standards. The market shows high entry barriers due to the capital-intensive nature of R&D, complex design requirements, and certification processes. Product differentiation revolves around performance, durability, design integration, and smart functionalities. The aftermarket segment remains fragmented, offering growth opportunities for regional and price-competitive players. It supports both standardized replacements and customized upgrades for vehicle owners.
Report Coverage:
The research report offers an in-depth analysis based on product, functionality, and sales channel. It details leading market players, providing an overview of their business, product offerings, investments, revenue streams, and key applications. Additionally, the report includes insights into the competitive environment, SWOT analysis, current market trends, as well as the primary drivers and constraints. Furthermore, it discusses various factors that have driven market expansion in recent years. The report also explores market dynamics, regulatory scenarios, and technological advancements that are shaping the industry. It assesses the impact of external factors and global economic changes on market growth. Lastly, it provides strategic recommendations for new entrants and established companies to navigate the complexities of the market.
Future Outlook:
- Increasing EV production will drive demand for energy-efficient LED and OLED rear lighting systems.
- Integration of adaptive and smart rear lights will align with autonomous vehicle developments.
- Regulatory harmonization across regions may streamline product design and certification.
- Growing vehicle personalization trends will boost demand for customizable rear light designs.
- Advancements in connected car technology will expand adoption of communicative rear lights.
- OEM collaborations with lighting specialists will accelerate innovation and time-to-market.
- Aftermarket segment will expand through LED retrofit kits and performance upgrades.
- Emerging markets will offer growth opportunities through rising vehicle ownership and safety regulations.
- Declining cost of advanced lighting components will support broader adoption across segments.
- Sustainability goals will push development of recyclable materials and energy-saving technologies.


