
Bio-Degradable Polymer Coated NPK Market Overview
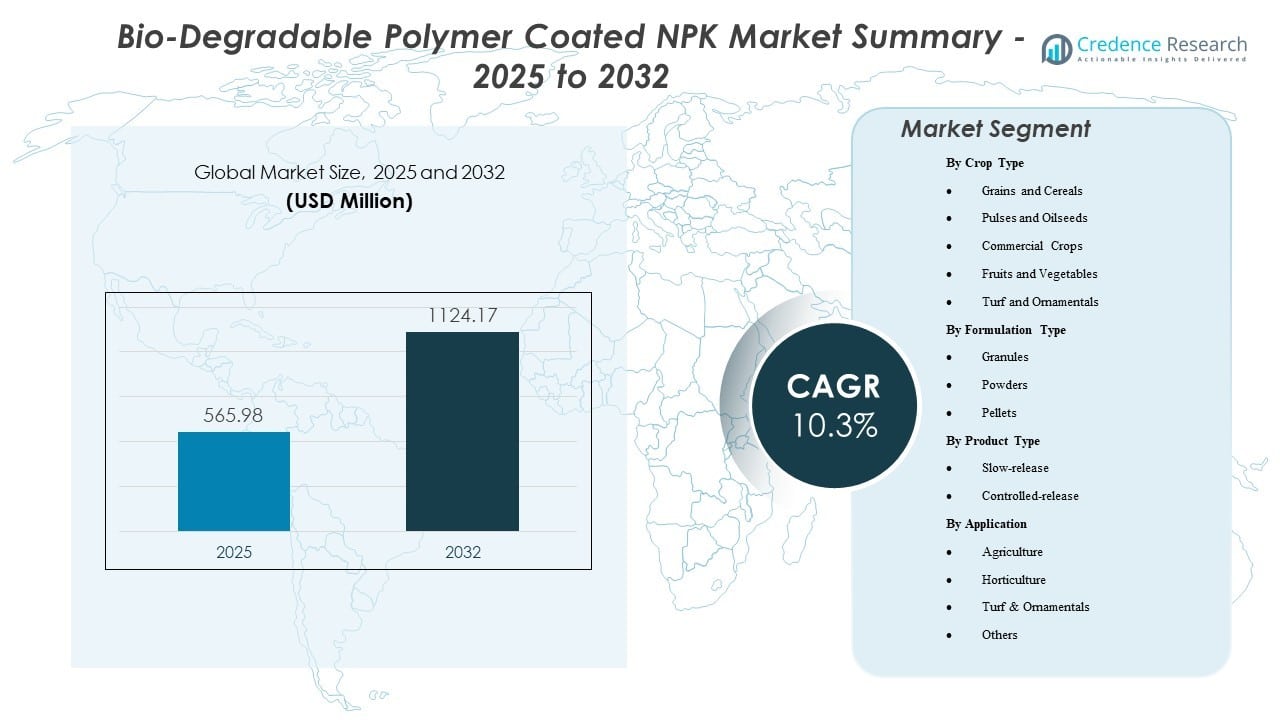
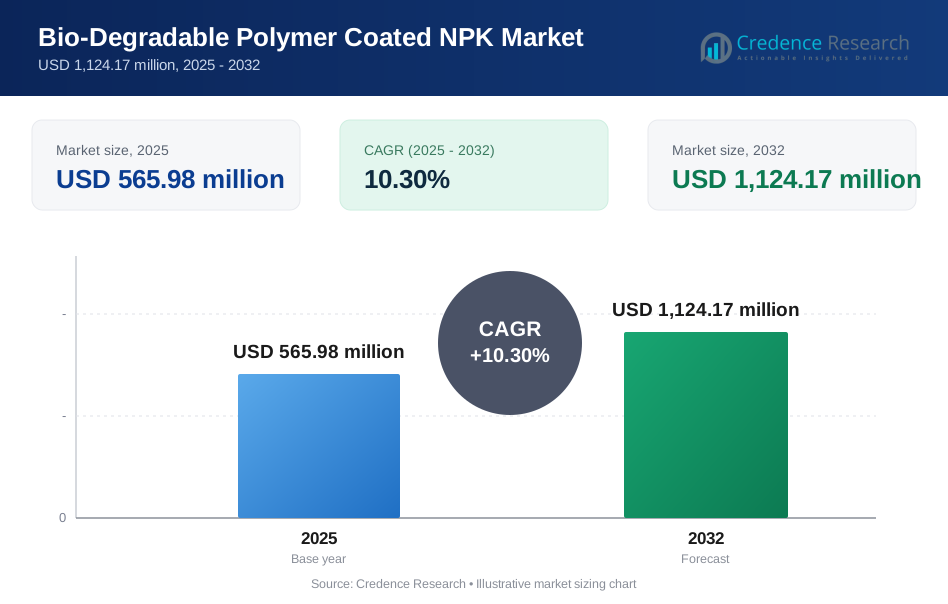
The Global Bio-Degradable Polymer Coated NPK market size was valued at USD 565.98 million in 2025 and is expected to reach USD 1,124.17 million by 2032, growing at a 10.3% CAGR during 2025–2032.
| REPORT ATTRIBUTE | DETAILS |
|---|---|
| Historical Period | 2020-2023 |
| Base Year | 2024 |
| Forecast Period | 2025-2032 |
| Bio-Degradable Polymer Coated NPK Market Size 2025 | USD 565.98 million |
| Bio-Degradable Polymer Coated NPK Market, CAGR | 10.3% |
| Bio-Degradable Polymer Coated NPK Market Size 2032 | USD 1,124.17 million |
Increasing adoption of efficiency fertilizers in broad-acre agriculture, along with rising focus on nutrient stewardship and precision application practices, is supporting demand for coated NPK that delivers controlled nutrient release and reduces operational disruptions from multiple fertilizer applications.
Key Market Insights
- North America led with 32% revenue share in 2025, supported by large-scale row-crop adoption and established specialty fertilizer distribution.
- Asia-Pacific represented 28% share in 2025, driven by expanding commercial agriculture and rising input-efficiency focus.
- Europe captured 24% share in 2025, aided by nutrient stewardship programs and stricter environmental compliance across intensive farming systems.
- South America (9%) and Middle East & Africa (7%) held smaller shares in 2025, with adoption linked to plantation/export crops and efficiency-led fertilization in water-stressed regions.
- Category demand concentrated in Grains & Cereals (42% share, 2025), Granules (66% share), Controlled-release (58% share), and Agriculture (74% share) due to fewer field passes, equipment compatibility, and season-long nutrient delivery.
Segment Analysis
Demand concentrates in high-acreage systems where labor availability, fuel exposure, and application timing constraints push growers toward fewer-pass fertilization programs. Coated NPK adoption is strongest where nutrient losses materially impact yields or compliance outcomes, which increases the economic value of controlled nutrient release. Buyers typically evaluate products through on-farm performance consistency, operational simplicity, and compatibility with existing equipment and seasonal calendars. The market also benefits where distributors can provide guidance on matching release profiles to crop cycles and climatic conditions.
Segment behavior indicates that scale economics and predictable agronomic outcomes drive repeat purchasing. Large commodity farms use coated NPK to stabilize nutrient availability and reduce re-application events, while premium crop producers prioritize quality and uniformity. Over time, adoption expands as field demonstrations and advisory programs reduce switching resistance. This structure supports steady volume growth across staple crops while enabling faster growth in specialty crop and turf programs.
By Crop Type Insights
Grains and Cereals accounted for the largest share of 42% in 2025. Large-acreage grain systems favor coated NPK due to fewer application rounds and reduced operational disruption during narrow field windows. Growers value predictable nutrient delivery across key growth stages, which supports yield stability and improves fertilizer-use efficiency. Adoption is supported by the ability to standardize nutrition programs across wide farm footprints while lowering labor and fuel intensity.
By Formulation Type Insights
Granules accounted for the largest share of 66% in 2025. Granular formats align well with mainstream spreading equipment and enable uniform field coverage at scale. They also support consistent handling and storage practices across distributor networks, which improves last-mile execution. Granules remain preferred for broad-acre cropping where application speed and field coverage efficiency drive buying decisions.
By Product Type Insights
Controlled-release accounted for the largest share of 58% in 2025. Controlled-release products lead due to stronger timing control and more consistent performance across growth stages. Buyers select these products where agronomic programs emphasize nutrient-use efficiency and measurable reduction in losses. Controlled-release offerings also fit better with fewer-pass nutrition strategies, which strengthens adoption in both commodity and high-value crop systems.
By Application Insights
Agriculture accounted for the largest share of 74% in 2025. Agriculture dominates because coated NPK is most widely deployed in large-scale crop production where operational efficiencies create clear payback. Broad-acre systems benefit from reduced re-application requirements and more predictable nutrient availability. Adoption is reinforced by mechanized farm practices and distributor availability of standard coated formulations.
Market Drivers
Yield Stability And Nutrient-Use Efficiency
Adoption rises where growers must protect yields under tighter agronomic targets and variable weather conditions. Bio-degradable polymer-coated NPK supports more consistent nutrient availability and improves nutrient-use efficiency, which strengthens fertilizer ROI in high-input cropping systems. It also reduces the risk of under- or over-feeding during critical growth stages by smoothing nutrient supply across the season.
Reduced Nutrient Losses And Compliance Pressure
Coated formulations help limit nutrient losses linked to leaching and volatilization by regulating release timing closer to crop demand. Demand increases in production areas where nutrient stewardship programs and sustainability metrics influence input selection and on-farm reporting. This creates stronger pull from growers and distributors looking to align fertilizer programs with compliance and environmental performance goals.
- For instance, polymer‑coated urea (PCU) applications reduced cumulative nitrous oxide emissions by 43.5–52.7% and ammonia emissions by 20.7–40.9% compared to conventional urea at 260 kg N per hectare, while maintaining comparable yields, directly supporting environmental performance metrics without sacrificing productivity.
Operational Savings From Fewer Applications
Large farms benefit from fewer fertilizer application cycles per season, which reduces labor requirements, fuel exposure, and field interruptions. This operational advantage is especially valuable during narrow application windows and in large-acreage grain and cereal cultivation. Reduced field traffic also supports better soil structure management, which improves long-term productivity in intensive systems.
Precision Farming Integration And Repeat Purchasing
Compatibility with variable-rate application and data-led nutrient planning strengthens adoption, as coated NPK fits programs focused on yield stability and input efficiency. Growers increasingly buy coated NPK alongside soil testing, advisory services, and sensor-driven planning, while supply reliability and consistent product performance support repeat purchasing. Wider integration with dealer agronomy platforms and crop-specific recommendations is also improving decision confidence and accelerating broader use.
- For instance, a GPS‑guided variable‑rate fertilization program on a large wheat enterprise reduced fertilizer use by 30% and increased wheat yield per hectare by 12%, with the operator reporting 25% shorter application times, illustrating how coated and precision‑applied fertilizers support repeat purchasing by delivering measurable efficiency and performance gains.
Market Challenges
Cost remains the most persistent restraint, as polymer-coated formulations typically carry a premium versus conventional NPK, making payback sensitive to crop prices and seasonal weather conditions. Adoption slows in regions with limited extension support, where growers may lack confidence in selecting release profiles aligned to soil temperature, irrigation practices, and crop calendars. Performance variability can emerge when storage and handling conditions are suboptimal, especially in humid climates where product stability and coating integrity require better logistics discipline. These factors create a higher decision threshold for small and mid-sized farms.
Market penetration is also constrained by product education gaps, switching reluctance, and inconsistent access to tailored formulations across distributor networks. In mature farm belts, demand can plateau when conventional fertilizer programs already achieve acceptable yields at lower upfront cost. Competitive intensity further pressures margins, as suppliers attempt to defend share through pricing or bundling strategies. These constraints keep adoption uneven across regions and crop systems despite favorable long-term growth fundamentals.
- For instance, a 2025 vegetable-field trial in China using polymer-coated urea showed nitrogen use efficiency improvements of about 48–50% and reductions in nitrous oxide emissions by up to 53% versus conventional urea, yet adoption remains localized because such quantified benefits are not widely communicated through retailer and extension channels.
Market Trends and Opportunities
Product innovation trends center on coatings that balance biodegradability with predictable release behavior across diverse soil temperatures and irrigation methods. Suppliers increasingly position coated NPK in fewer-application nutrition programs, supported by improved field guidance, decision tools, and compatibility with mainstream spreading equipment. Distribution strategies are shifting toward tighter coordination with agronomy services, where product selection aligns to soil testing and field prescriptions. The market is also seeing wider pairing with precision platforms, which strengthens the “inputs + advisory” value proposition.
Opportunities are strongest in regions where fertilizer efficiency is becoming a procurement priority and where higher-value crops justify premium nutrition programs. Growth potential remains under-tapped in horticulture and export-oriented supply chains, where quality consistency and nutrient timing have direct economic impact. Expansion into emerging farm clusters with improving mechanization can broaden granule and pellet volumes, while customized blends can deepen penetration in specialty crops. These trends support continued upside in both developed markets and high-growth agricultural economies through 2032.
- For instance, biodegradable polymer‑coated NPK formulations deployed in intensive European systems can extend nutrient release up to 180 days, allowing 15–25% fertilizer rate reductions in high‑value crops without compromising yields under EU stewardship requirements.
Regional Insights
North America
North America held 32% revenue share in 2025. Demand is supported by large-scale row-crop operations that value fewer field passes, predictable nutrient timing, and compatibility with mechanized application. The region benefits from mature specialty fertilizer distribution and agronomy support that improves product selection and confidence. Growth remains steady as coated products expand into more farm programs focused on efficiency and sustainability reporting.
Europe
Europe held 24% revenue share in 2025. Adoption is driven by stronger nutrient stewardship expectations and environmental compliance focus in intensive farming regions. Growers increasingly prioritize inputs that reduce nutrient losses while maintaining yield consistency, particularly in high-input cropping systems. Product uptake strengthens where advisory ecosystems can translate field data into release-profile selection.
Asia-Pacific
Asia-Pacific is expected to register the fastest growth from 2025 to 2032. Expansion is supported by scaling commercial agriculture, improving mechanization, and rising focus on input efficiency across major producing countries. Demand growth is strongest where farm intensification and higher-value cropping increase the benefit of controlled nutrient delivery. Distribution expansion and agronomy-led programs continue to widen the addressable market.
South America
South America held 9% revenue share in 2025. Adoption is supported by commercial farming systems and export-linked crops that emphasize yield reliability and consistent nutrition. Coated NPK penetration grows where plantation-style operations value fewer application cycles and labor efficiency. Wider uptake depends on distributor coverage, pricing accessibility, and extension support.
Middle East and Africa
Middle East and Africa held 7% revenue share in 2025. Efficiency-focused fertilization is a key driver, particularly in water-stressed and input-constrained farming environments. Adoption increases where growers prioritize maximizing nutrient uptake per unit of fertilizer applied. Market growth depends on improving access to specialized products and stronger agronomy enablement.
Competitive Landscape
The market shows a mix of global fertilizer majors and specialized controlled-release players competing on coating performance, release consistency, product portfolio breadth, and distributor relationships. Scale advantages matter in manufacturing, sourcing, and channel reach, while niche participants compete through agronomy support and crop-specific positioning. Differentiation increasingly extends beyond product to service-linked strategies such as advisory support, field programs, and precision application alignment. Competitive intensity remains elevated as suppliers balance premium pricing with the need to expand adoption across cost-sensitive farm segments.
Haifa Group – The company specializes in controlled-release fertilizers based on polymer-coated granules designed to regulate nutrient diffusion for season-long feeding. The approach emphasizes single-application nutrition programs that match nutrient availability to crop demand across growth stages. It positions controlled-release solutions to reduce re-application frequency and improve nutrient-use efficiency in both broad-acre and specialty cropping systems. The portfolio strategy supports standardized nutrition scheduling and operational simplicity for growers managing large acreages.
The industry research and growth report includes detailed analyses of the competitive landscape of the market and information about key companies, including:
- Haifa Group
- DeltaChem GmbH
- Florikan ESA LLC
- ICL Group Ltd / ICL Specialty Fertilizers
- J.R. Simplot Company
- Nutrien Ltd.
- Yara International ASA
- BASF
- The Mosaic Company
- COMPO EXPERT GmbH
Qualitative and quantitative analysis of companies has been conducted to help clients understand the wider business environment as well as the strengths and weaknesses of key industry players. Data is qualitatively analyzed to categorize companies as pure play, category-focused, industry-focused, and diversified; it is quantitatively analyzed to categorize companies as dominant, leading, strong, tentative, and weak.
Recent Developments
- In February 2026, BASF extended a fertilizer technology partnership through 2030, reinforcing continued investment in efficiency-enabling fertilizer solutions aligned with emissions reduction goals.
- In March 2025, Haifa Group confirmed a €30 million investment to build a new Multicote™ production plant in South France to manufacture controlled-release fertilizers using a newly developed biodegradable coating aligned with upcoming EU rules on microplastic residues.
- In August 2024, ICL Group Ltd / ICL Specialty Fertilizers signed a multi-year distribution agreement in China extending through 2028, strengthening channel reach in a fast-growing regional market.
- In April 2024, Haifa Group expanded collaboration activity in India to support innovation and sustainability in plant nutrition, improving access to efficiency fertilizers across a high-growth adoption landscape.
Report Scope
| Report Attribute | Details |
| Market size value in 2025 | USD 565.98 million |
| Revenue forecast in 2032 | USD 1,124.17 million |
| Growth rate (CAGR) | 10.3% (2025–2032) |
| Base year | 2025 |
| Forecast period | 2026–2032 |
| Quantitative units | USD million |
| Segments covered | By Crop Type (Grains and Cereals, Pulses and Oilseeds, Commercial Crops, Fruits and Vegetables, Turf and Ornamentals); By Formulation Type (Granules, Powders, Pellets); By Product Type (Slow-release, Controlled-release); By Application (Agriculture, Horticulture, Turf & Ornamentals, Others); By Region (North America, Europe, Asia-Pacific, South America, Middle East and Africa) |
| Regional scope | North America, Europe, Asia Pacific, Latin America, Middle East & Africa |
| Key companies profiled | Haifa Group; DeltaChem GmbH; Florikan ESA LLC; ICL Group Ltd / ICL Specialty Fertilizers; J.R. Simplot Company; Nutrien Ltd.; Yara International ASA; BASF; The Mosaic Company; COMPO EXPERT GmbH |
Segmentation
By Crop Type
- Grains and Cereals
- Pulses and Oilseeds
- Commercial Crops
- Fruits and Vegetables
- Turf and Ornamentals
By Formulation Type
- Granules
- Powders
- Pellets
By Product Type
- Slow-release
- Controlled-release
By Application
- Agriculture
- Horticulture
- Turf & Ornamentals
- Others
By Region
- North America
- Europe
- Asia-Pacific
- South America
- Middle East and Africa
Request a Free Sample
Fill in your details and we'll send you a free sample report.
- Sample data tables & charts
- Research methodology
Need a Custom Version of This Report?
Tailor the scope, geography, or segments to your exact requirements.
- Custom geography or segment scope
- Direct access to our analyst team
Frequently Asked Questions
What is the market size of the bio-degradable polymer coated NPK market in 2025 and what is the 2032 forecast?
What is the expected growth rate of the market during 2025–2032?
Which region leads the market in 2025?
Which region is expected to grow the fastest through 2032?
Which crop type segment holds the largest share in 2025?
Who are the key players operating in this market?
Table of Content
Chapter 1. Report Introduction
- 1.1 Report Description & Purpose
- 1.1.1 Report Title & Market Definition
- 1.1.2 Unique Selling Propositions (USP) & Key Differentiators
- 1.1.3 Value Proposition for Stakeholders
- 1.2 Research Objectives
- 1.2.1 Market Sizing Objectives (Volume & Revenue)
- 1.2.2 Segmentation Objectives
- 1.2.3 Competitive Intelligence Objectives
- 1.2.4 Forecast & Scenario Objectives
- 1.3 Report Scope
- 1.3.1 Bio-Degradable Polymer Coated NPK Scope – Types & Subtypes Covered
- 1.3.2 Geographic Scope – Regions & Countries Covered
- 1.3.3 Historical Period, Base Year & Forecast Period (2025; forecast to 2032)
- 1.3.4 Inclusions & Exclusions
- 1.4 HS Code & Classification Framework
- 1.5 Currency, Units & Pricing Basis
- 1.6 Target Stakeholders
- 1.7 Limitations & Assumptions
Chapter 2. Executive Summary
- 2.1 Global Bio-Degradable Polymer Coated NPK Market Snapshot
- 2.1.1 Market Size – Historical (2025) & Forecast (2025-2032) (2025: USD 565.98 million → 2032: USD 1,124.17 million)
- 2.1.2 Volume & Revenue – Global Totals
- 2.1.3 Key Market Highlights – Top Five Facts
- 2.2 Bio-Degradable Polymer Coated NPK Market Segmentation Snapshot
- 2.2.1 Market Split by Region – 2025 vs. 2032
- 2.3 Competitive Snapshot
- 2.3.1 Top 10 Players by Revenue Share – 2025
- 2.3.2 Top 10 Players by Volume Share – 2025
- 2.3.3 Recent Strategic Developments (18-Month Summary)
- 2.4 Key Investment Highlights & Strategic Conclusions
Chapter 3. Bio-Degradable Polymer Coated NPK Market Dynamics & Industry Analysis
- 3.1 Market Overview & Context
- 3.1.1 Bio-Degradable Polymer Coated NPK Market Position in the Broader Automotive Value Chain
- 3.1.2 OEM vs. Replacement Market Dynamics
- 3.1.3 Market Maturity & Development Stage by Region
- 3.2 Bio-Degradable Polymer Coated NPK Market Drivers
- 3.3 Bio-Degradable Polymer Coated NPK Market Restraints & Challenges
- 3.4 Bio-Degradable Polymer Coated NPK Market Opportunities
- 3.5 Porter's Five Forces Analysis
- 3.5.1 Threat of New Entrants
- 3.5.2 Bargaining Power of Suppliers
- 3.5.3 Bargaining Power of Buyers
- 3.5.4 Threat of Substitutes
- 3.5.5 Competitive Rivalry – Intensity Assessment
- 3.6 Bio-Degradable Polymer Coated NPK Value Chain Analysis
- 3.6.1 Upstream – Raw Material/Input Suppliers
- 3.6.1.1 Raw Material/Input 1
- 3.6.1.2 Raw Material/Input 2
- 3.6.1.3 Raw Material/Input 3
- 3.6.2 Midstream – Production/Manufacturing/Service Delivery
- 3.6.2.1 Production/Process Overview
- 3.6.2.2 Key Facility Locations & Capacity by Manufacturer
- 3.6.3 Downstream – Distribution & End Consumer
- 3.6.3.1 Primary Channel – B2B/OEM
- 3.6.3.2 Secondary Channels – Dealer, Retail, Online, Direct
- 3.6.4 Value Chain Profitability Analysis
- 3.6.1 Upstream – Raw Material/Input Suppliers
- 3.7 PESTEL Analysis
- 3.7.1 Political Factors
- 3.7.2 Economic Factors
- 3.7.3 Social Factors
- 3.7.4 Technological Factors
- 3.7.5 Environmental Factors
- 3.7.6 Legal Factors
- 3.8 Bio-Degradable Polymer Coated NPK Supply Chain Analysis
- 3.8.1 Raw Material/Input Supply Risk Assessment
- 3.8.2 Manufacturing Concentration Risk (Geographic Exposure)
- 3.8.3 Trade Disruption Impact Analysis
- 3.9 Regulatory & Policy Landscape
Note: The regulatory and policy landscape section covers regulations based on their applicability to the market, Bio-Degradable Polymer Coated NPK category, geography, and scope of the study. Only regulatory frameworks with a material impact on operations, compliance, trade, sustainability, or market access are analyzed in detail.
Chapter 4. Key Investment Pockets & Opportunity Analysis
- 4.1 Bio-Degradable Polymer Coated NPK Market Attractiveness Analysis
- 4.1.1 By Region – Investment Attractiveness Matrix (Volume × CAGR)
- 4.2 Absolute Revenue Growth Opportunity
- 4.2.1 By Region – Absolute USD Growth Through 2032
- 4.3 Incremental Volume Opportunity
- 4.3.1 By Region – Incremental Volume Through 2032
- 4.3.2 Segment – Incremental Volume
- 4.4 Emerging Submarket Opportunity Deep Dive (Subject to Applicability)
- 4.5 Emerging Market Opportunity Scorecards
- 4.5.1 United States
- 4.5.2 Europe
- 4.5.3 Asia
- 4.5.4 Middle East & Africa
Note: Emerging Market Opportunity Scorecards will be included based on relevance and strategic importance. Regions listed are indicative and may vary depending on data availability and market dynamics.
Chapter 5. Bio-Degradable Polymer Coated NPK Import-Export Analysis & Trade Flows
- 5.1 Global Trade Overview
- 5.1.1 Global Export Value by Country (2025)
- 5.1.2 Global Export Volume by Country (2025)
- 5.1.3 Global Import Value by Country (2025)
- 5.1.4 Global Import Volume by Country (2025)
- 5.1.5 Net Trade Balance by Country (2025)
- 5.2 Export Analysis – Segment
- 5.2.1 Type 1 (HS Code)
- 5.2.2 Type 2 (HS Code)
- 5.2.3 Type 3 (HS Code)
- 5.2.4 Type 4 (HS Code)
- 5.2.5 Type 5 (HS Code)
- 5.3 Import Analysis – Segment
- 5.3.1 Type 1 (HS Code)
- 5.3.2 Type 2 (HS Code)
- 5.3.3 Type 3 (HS Code)
- 5.3.4 Type 4 (HS Code)
- 5.3.5 Type 5 (HS Code)
- 5.4 Average Unit Trade Prices
- 5.4.1 Average Export Price – Segment & Country
- 5.4.2 Average Import Price – Segment & Source Country
- 5.4.3 Price Trends (2025)
- 5.5 Key Trade Route Analysis
- 5.5.1 Trade Route 1
- 5.5.2 Trade Route 2
- 5.5.3 Trade Route 3
- 5.5.4 Trade Route 4
- 5.5.5 Trade Route 5
- 5.6 Trade Policy Impact Assessment
- 5.6.1 US Anti-Dumping & Section 301 Tariffs
- 5.6.2 EU Customs Union Impact
- 5.6.3 Major Free Trade Agreements
- 5.6.4 USMCA Rules of Origin
Note: Trade policy analysis will be included only where relevant to the Bio-Degradable Polymer Coated NPK market.
Chapter 6. Competitive Landscape & Company Benchmarking
- 6.1 Bio-Degradable Polymer Coated NPK Market Concentration & Structure
- 6.1.1 Herfindahl-Hirschman Index (HHI) – vs. 2025
- 6.1.2 Tier 1, Tier 2 & Tier 3 Market Structure
- 6.1.3 Global, Regional & Local Player Dynamics
- 6.2 Bio-Degradable Polymer Coated NPK Market Share Analysis – 2025
- 6.2.1 Global Revenue Share by Company
- 6.2.2 Global Volume Share by Company
- 6.2.3 Regional Revenue Share
- 6.2.4 Market Share Evolution ( vs. 2025)
- 6.2.5 OEM Segment Share by Company
- 6.2.6 Replacement Segment Share by Company
- 6.3 Production/Delivery Capacity & Facility Analysis
- 6.3.1 Global Installed Capacity
- 6.3.2 Capacity Utilization Rates
- 6.3.3 Production/Output Volume
- 6.3.4 Facility Locations & Capacity Map
- 6.3.5 Planned Capacity Additions
- 6.4 Bio-Degradable Polymer Coated NPK Competitive Benchmarking Matrix
- 6.4.1 Revenue, Volume, CAGR & Profitability Comparison
- 6.4.2 Channel Revenue Mix
- 6.4.3 Geographic Revenue Exposure
- 6.4.4 R&D Intensity
- 6.4.5 Sustainability Maturity
- 6.5 Strategic Developments in Bio-Degradable Polymer Coated NPK (Last 24 Months)
- 6.5.1 Mergers, Acquisitions & Divestments
- 6.5.2 New Bio-Degradable Polymer Coated NPK Launches
- 6.5.3 Facility Expansions
- 6.5.4 Strategic Alliances, Joint Ventures & Partnerships
- 6.5.5 Distribution Expansion & Market Entry
- 6.5.6 Sustainability & ESG Initiatives
- 6.6 Competitive Strategy Mapping
- 6.6.1 Leader, Challenger, Follower & Niche Classification
- 6.6.2 Pricing Strategy Comparison
- 6.6.3 Channel Strategy Matrix
Note: Strategic developments are included based on their materiality and the availability of reliable information.
Chapter 7. Global Bio-Degradable Polymer Coated NPK Market – By Distribution Channel
- 7.1 Segment Overview
- 7.1.1 Volume & Revenue Split by Channel (2025 & 2032)
- 7.1.2 Channel Mix Evolution (2025-2032)
Chapter 8. Regional Market Analysis – Global Overview
- 8.1 Global Regional Overview
- 8.1.1 Regional Volume Share
- 8.1.2 Regional Revenue Share
- 8.1.3 Regional Volume by Region
- 8.1.4 Regional Revenue by Region
- 8.1.5 Regional Forecast Through 2032
- 8.2 Cross-Regional Segment Analysis
- 8.2.1 By Distribution Channel
- 8.2.2 By Brand/Price Tier
Chapter 9. North America Bio-Degradable Polymer Coated NPK Market
- 9.1 United States
- 9.2 Canada
- 9.3 Mexico
Chapter 10. Europe Bio-Degradable Polymer Coated NPK Market
- 10.1 Germany
- 10.2 France
- 10.3 Italy
- 10.4 United Kingdom
- 10.5 Spain
- 10.6 Poland
- 10.7 Russia
- 10.8 Netherlands
- 10.9 Belgium
- 10.10 Sweden
- 10.11 Denmark
- 10.12 Norway
- 10.13 Rest of Europe
Chapter 11. Asia Pacific Bio-Degradable Polymer Coated NPK Market
- 11.1 China
- 11.2 India
- 11.3 Japan
- 11.4 South Korea
- 11.5 Thailand
- 11.6 Indonesia
- 11.7 Vietnam
- 11.8 Malaysia
- 11.9 Australia
- 11.10 Rest of Asia Pacific
Chapter 12. Latin America Bio-Degradable Polymer Coated NPK Market
- 12.1 Brazil
- 12.2 Argentina
- 12.3 Colombia
- 12.4 Chile
- 12.5 Rest of Latin America
Chapter 13. Middle East Bio-Degradable Polymer Coated NPK Market
- 13.1 Saudi Arabia
- 13.2 United Arab Emirates
- 13.3 Turkey
- 13.4 Israel
- 13.5 Iran
- 13.6 Rest of the Middle East
Chapter 14. Africa Bio-Degradable Polymer Coated NPK Market
- 14.1 South Africa
- 14.2 Egypt
- 14.3 Nigeria
- 14.4 Morocco
- 14.5 Rest of Africa
Chapter 15. Bio-Degradable Polymer Coated NPK Company Profiles
- 15.1 [Company 01]
- 15.1.1 Company Overview
- 15.1.2 Key Management Personnel
- 15.1.3 Products & Services Portfolio
- 15.1.4 Financial Performance
- 15.1.5 Key Market Focus & Geographic Presence
- 15.1.6 Recent Developments & Strategic Initiatives
Note: The company profile list is preliminary and may change based on research findings, market developments, data availability, and client requirements.
Chapter 16. Appendices
- Appendix A – List of Abbreviations & Acronyms
- Appendix B – Industry Classification Code Reference – Full Series
- Appendix C – Production & Capacity Data Tables
- Appendix D – End-Use & Demand Base Tables
- Appendix E – Consumption & Replacement Rate Assumptions
- Appendix F – ASP Reference Tables
- Appendix G – Manufacturing & Facility Database
- Appendix H – Import-Export Data Tables
- Appendix I – Regulatory Summary Tables
- Appendix J – Primary Research Participant List (Anonymized)
- Appendix K – Primary Research Questionnaire Framework
- Appendix L – Data Sources & Bibliography
- Appendix M – Market Size Divergence & Source Comparison
Chapter 17. Research Methodology
- 17.1 Research Framework & Philosophy
- 17.2 Secondary Research – Sources, Hierarchy & Data Extraction
- 17.3 Data Modeling – Bottom-Up & Top-Down Market Sizing
- 17.4 Primary Research – Stakeholder Framework, LOI & Sample Sizes
- 17.5 Forecast Methodology – Regression, Scenario & Sensitivity Analysis
- 17.6 Quality Control – Four-Layer Validation Framework
- 17.7 Limitations & Standard Assumptions
- 17.8 Disclaimer
