Bioprocess Validation Market Overview:
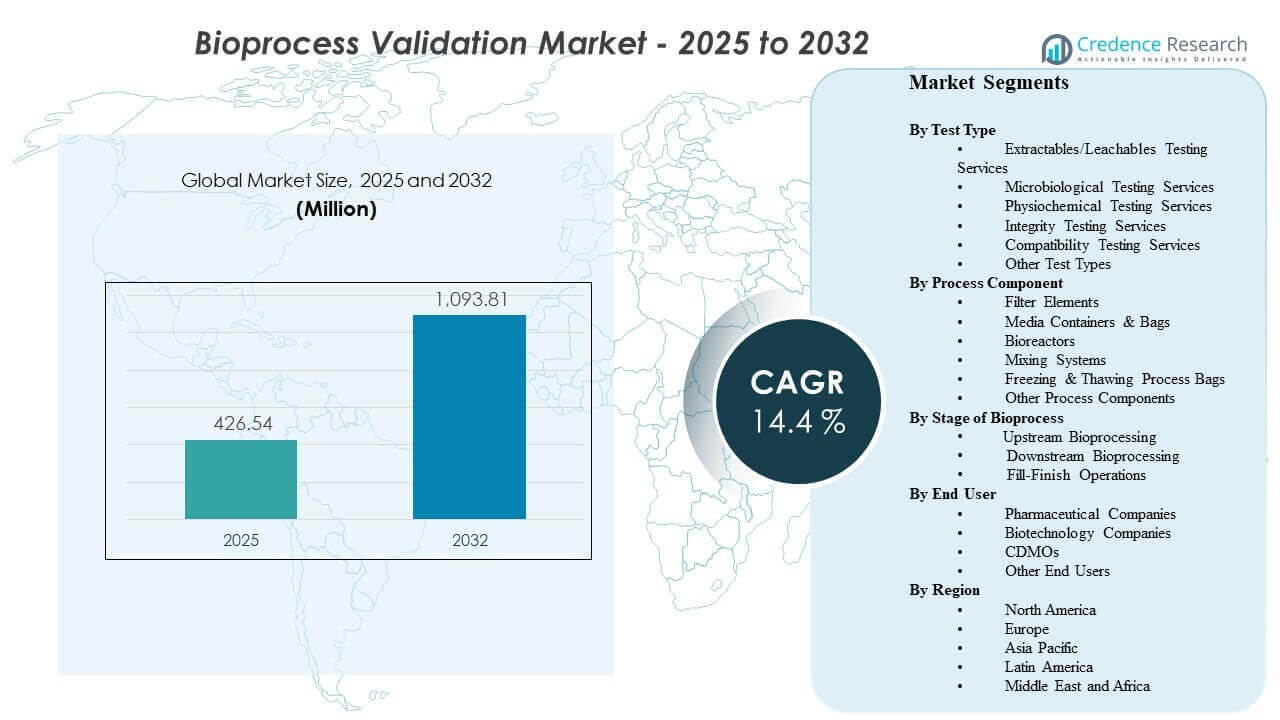
The global Bioprocess Validation Market size was estimated at USD 426.54 million in 2025 and is expected to reach USD 1093.81 million by 2032, growing at a CAGR of 14.4% from 2025 to 2032. Growth is driven primarily by tighter quality and contamination-control expectations across biologics manufacturing, which expand the scope and frequency of validation across critical process steps and contact materials. Demand is further supported by capacity additions and outsourcing growth that increase the volume of qualification, method validation, and documentation cycles across global manufacturing networks.
| REPORT ATTRIBUTE |
DETAILS |
| Historical Period |
2020-2024 |
| Base Year |
2025 |
| Forecast Period |
2026-2032 |
| Bioprocess Validation Market Size 2025 |
USD 426.54 million |
| Bioprocess Validation Market, CAGR |
14.4% |
| Bioprocess Validation Market Size 2032 |
USD 1093.81 million |
Key Market Trends & Insights
- The market is projected to expand from USD 426.54 million (2025) to USD 1093.81 million (2032) at 14.4% CAGR (2025–2032).
- North America accounted for 46.9% in 2025, supported by mature biologics manufacturing and high compliance intensity.
- Extractables/Leachables Testing Services held 37.4% share in 2025, reflecting broad adoption of single-use systems and impurity-risk control expectations.
- Filter Elements represented 25.6% share in 2025, underlining the central role of sterile assurance and integrity verification in validated production.
- Pharmaceutical & Biotechnology Companies (combined) captured 57.3% share in 2025, as sponsors retain direct oversight of critical quality and release-enabling validation activities.
Segment Analysis
Bioprocess validation is increasingly treated as an end-to-end program spanning method validation, contamination-control strategy, and audit-ready documentation rather than a set of isolated tests. As pipelines diversify and process changes occur more frequently across scale-up and lifecycle management, validation packages must be repeatable, risk-based, and compatible with faster development timelines. This shifts demand toward standardized protocols, tighter change-control linkages, and data systems that support traceability across sites and contract partners.
Single-use adoption and intensified processing designs are elevating the importance of material compatibility, extractables/leachables profiles, and integrity testing across fluid-contact components. In parallel, sterile manufacturing expectations in late-stage operations raise the validation burden around upstream-to-downstream handoffs and fill-finish environments. Outsourcing continues to expand for specialized testing and capacity reasons, but sponsors typically maintain internal governance over acceptance criteria, deviations, and regulatory-facing documentation.
Access crucial information at unmatched prices!
Request your sample report today & start making informed decisions powered by Credence Research Inc.!
Download Sample
By Test Type Insights
Extractables/Leachables Testing Services accounted for the largest share of 37.4% in 2025. Its leadership reflects the need to characterize potential impurities from contact materials and ensure compatibility across single-use assemblies and process pathways. Validation programs increasingly require defensible profiles that can be referenced across process changes, supplier updates, and scale transitions. As development timelines compress, buyers favor providers that can combine robust analytical coverage with clear reporting aligned to quality documentation needs.
By Process Component Insights
Filter Elements accounted for the largest share of 25.6% in 2025. Filters are central to contamination control and sterile assurance, which drives recurring qualification, integrity testing, and batch-to-batch verification in validated manufacturing. The segment benefits from the high frequency of filter use across upstream and downstream operations and the need to validate performance under defined operating ranges. Buyers prioritize consistency, traceability, and well-documented performance claims that support audits and internal quality reviews.
By Stage of Bioprocess Insights
Upstream Bioprocessing accounted for the largest share of 51.6% in 2025. Upstream operations typically experience the highest rate of process tuning and scale-up change, which expands validation activity for methods, sampling plans, and control strategies. Variability risks in early-stage steps also increase reliance on validation to demonstrate consistent performance across runs and sites. As organizations adopt intensified and closed processing approaches, upstream validation increasingly emphasizes robust monitoring, contamination control, and repeatable documentation packages.
By End User Insights
Pharmaceutical Companies and Biotechnology Companies (combined) accounted for the largest share of 57.3% in 2025. Sponsors often retain core validation governance to maintain direct control over acceptance criteria, deviations, and regulatory-facing evidence packages. Internal teams also manage method transfer decisions, comparability considerations, and lifecycle updates that trigger re-validation. Even with broader outsourcing, sponsors typically expect external partners to deliver standardized outputs that integrate smoothly into internal quality systems and audit processes.
Bioprocess Validation Market Drivers
Expanding Biologics Manufacturing and Capacity Additions
Biologics production growth increases the number of facilities, lines, and sites that must meet validated-state expectations. Each expansion introduces qualification and validation cycles across equipment, utilities, and critical process steps. Multi-site supply strategies further raise demand for standardized validation packages and consistent documentation. As organizations scale faster, they rely on repeatable, risk-based validation frameworks to reduce delays and avoid batch disruptions.
- For instance, Samsung Biologics completed the construction of Plant 5 in April 2025, adding 180,000 liters of biomanufacturing capacity and bringing the company’s total global production capacity to 845,000 liters across its Songdo site and the newly acquired 60,000-liter facility in Rockville, Maryland — making it the world’s largest CDMO by installed capacity.
Rising Compliance Expectations for Contamination Control and Sterile Assurance
Sterile and low-bioburden requirements increase validation intensity across process controls, integrity verification, and environmental strategies. Quality teams increasingly expect evidence that contamination risks are controlled across the entire process path, not only at final steps. This broadens testing needs across microbiology, integrity testing, and compatibility checks that support contamination-control programs. Strong documentation and traceability are central to meeting audit expectations.
Single-Use Adoption Driving Material and Compatibility Validation
The shift toward single-use assemblies increases the need to validate contact materials, leachables risk, and process compatibility across operating conditions. Validation must address supplier variation, assembly configuration changes, and lifecycle updates. Buyers seek test methods and reporting that can be re-used across products and lines where feasible to reduce repeated effort. This dynamic supports sustained demand for extractables/leachables and compatibility testing services.
- For instance, FUJIFILM Diosynth Biotechnologies successfully replicated its single-use biomanufacturing platform from North Carolina, USA, to its Billingham, UK facility in just 14 months delivering the UK’s first cGMP single-use manufacturing facility and commencing operations three months ahead of the original project schedule, enabled by standardized qualification packages and knowledge transfer across sites.
Outsourcing Growth and the Need for Scalable Validation Capacity
Sponsors increasingly use external partners to manage capacity constraints, specialized methods, and turnaround time demands. Outsourcing can reduce bottlenecks in development and commercial support, especially during scale-up and product transitions. However, sponsor quality organizations still require standardized deliverables that fit internal governance and audit needs. This pushes service providers to differentiate on compliance maturity, documentation quality, and consistent execution.
Bioprocess Validation Market Challenges
Validation programs can become resource-intensive as test menus expand and documentation requirements increase across sites and partners. Organizations often struggle with aligning acceptance criteria, change control, and evidence packages across internal teams and outsourced labs, which can create rework and delays. Method transfers and supplier changes introduce additional cycles of verification that are difficult to standardize across heterogeneous manufacturing footprints. Managing timelines without compromising quality remains a persistent operational tension.
Complexity also rises as pipelines diversify and processes evolve through lifecycle changes, increasing the frequency of updates that may trigger partial re-validation. Data integrity and traceability expectations require stronger systems, controlled records, and audit-readiness, which increases overhead for both sponsors and service providers. Variability in regional regulatory expectations and inspection focus can further complicate global standardization. These pressures increase the need for governance, templates, and repeatable validation playbooks.
- For instance, Bristol Myers Squibb faced the direct operational consequence of system fragmentation when it needed to consolidate a legacy Celgene CTMS and a legacy BMS CTMS two separate platforms with distinct documentation architectures into a single globally unified trial management system; the full implementation across the company’s global operations was completed in under 20 months.
Bioprocess Validation Market Trends and Opportunities
Organizations are moving toward integrated validation packages that link analytical, microbiological, and integrity testing outputs into audit-ready evidence structures. This favors providers with broad capabilities and strong quality systems that can deliver standardized reporting across methods and sites. There is also growing demand for faster turnaround and clearer documentation structures that support quicker review cycles and release decisions. Digital enablement for tracking, trending, and documentation control is becoming a practical differentiator in vendor selection.
- For instance, Eurofins BioPharma Product Testing operates a network of 46 harmonized GMP laboratories across more than 20 countries, all governed by a single Global Quality Policy Manual and a unified eLIMS-BPT platform, Electronic Laboratory Notebooks (ELN), and a centralized LabAccess℠ client portal spanning 28 locations worldwide a configuration that enables standardized cross-site documentation and audit-ready reporting at scale.
Single-use expansion and intensified processing designs are creating opportunities for repeatable material qualification frameworks that can be leveraged across multiple products and platforms. As outsourcing expands, CDMOs and specialized testing providers can grow by offering end-to-end validation support that reduces sponsor workload and compresses timelines. Demand is also increasing for harmonized validation approaches that ease multi-site transfers and lifecycle updates. These trends support growth for companies that can combine capacity with consistent, high-compliance execution.
Regional Insights
North America
North America represented 46.9% of revenue in 2025, supported by established biologics manufacturing, dense CDMO ecosystems, and high compliance intensity. Regional demand is driven by frequent scale-up and lifecycle management activity that triggers re-validation and method updates. Buyers tend to prioritize audit-ready documentation, predictable turnaround, and consistent execution across multiple facilities. The region also supports strong demand for integrity testing and contamination-control aligned validation workflows.
Europe
Europe accounted for 22.4% of revenue in 2025, supported by a broad footprint of regulated manufacturing and cross-border production networks. Validation demand is strengthened by the need for standardized evidence packages that can be used across multi-country supply chains. Buyers often emphasize harmonized procedures, strong quality systems, and robust change-control documentation. Mature biologics hubs and CDMOs underpin steady demand across testing types and process components.
Asia Pacific
Asia Pacific contributed 21.3% of revenue in 2025, reflecting expanding capacity and increasing participation in global outsourcing and manufacturing networks. Growth is supported by new facility builds, platform expansion, and rising adoption of standardized quality systems. Sponsors and CDMOs in the region increasingly seek scalable validation capabilities with clear documentation formats that align to global audits. Demand is particularly strong where single-use adoption and rapid scale-up increase material and integrity validation needs.
Latin America
Latin America held 5.6% of revenue in 2025, with demand concentrated around localized manufacturing, import-linked quality activities, and regional production hubs. Validation needs are often shaped by project-based capacity additions and upgrading of quality systems. Buyers typically focus on ensuring compliant documentation and reliable execution under tighter resource constraints. As capabilities expand, demand for outsourced validation and standardized test packages is expected to strengthen.
Middle East & Africa
Middle East & Africa represented 3.8% of revenue in 2025, reflecting a smaller installed base but increasing interest in localized manufacturing and sterile capability build-out. Validation demand is typically linked to new projects, facility upgrades, and initiatives to strengthen regulated production infrastructure. Buyers prioritize foundational quality systems, repeatable validation playbooks, and partner support for documentation readiness. Growth is expected to track the pace of manufacturing investment and capability development.
Competitive Landscape
Competition is shaped by capability breadth, compliance maturity, turnaround performance, and the ability to deliver standardized, audit-ready documentation that integrates into sponsor quality systems. Vendors differentiate by offering bundled validation workflows across analytical, microbiological, and integrity testing, alongside consulting support for change control and lifecycle updates. Scale, geographic lab networks, and consistent execution across sites are key for large biopharma programs and multi-site manufacturing strategies. Service providers also compete on specialization in high-scrutiny areas such as contamination control, material compatibility, and release-support testing.
Thermo Fisher Scientific Inc. is positioned across enabling technologies and services that support validated bioprocessing, with strength in integrated workflows spanning bioproduction, analytics, and quality support. The company’s approach typically emphasizes breadth of portfolio and the ability to support standardized practices across development and manufacturing environments. This aligns well with buyer demand for repeatable validation frameworks that can be applied across sites and products. Scale and integration capabilities can support faster deployment of validation solutions and consistent documentation structures.
The industry research and growth report includes detailed analyses of the competitive landscape of the market and information about key companies, including:
Qualitative and quantitative analysis of companies has been conducted to help clients understand the wider business environment as well as the strengths and weaknesses of key industry players. Data is qualitatively analyzed to categorize companies as pure play, category-focused, industry-focused, and diversified; it is quantitatively analyzed to categorize companies as dominant, leading, strong, tentative, and weak.
Shape Your Report to Specific Countries or Regions & Enjoy 30% Off!
Recent Developments
- In April 2025, Sartorius Stedim Biotech entered a strategic partnership with Tulip Interfaces to accelerate digital transformation in biopharmaceutical manufacturing. Sartorius said the collaboration is intended to reduce manual-process errors, improve end-to-end biomanufacturing visibility, and support regulatory compliance in single-use bioprocessing environments.
- In March 2025, Cytiva expanded its Xcellerex X-platform portfolio by adding new 500L and 2,000L bioreactors. Cytiva said the broader platform helps scientists scale more smoothly from 50L to 2,000L with improved reliability, flexibility, and efficiency, which supports process consistency for regulated biomanufacturing.
- In February 2025, Thermo Fisher Scientific announced a definitive agreement to acquire Solventum’s Purification & Filtration business for approximately $4.1 billion in cash. The company said the acquisition is highly complementary to its bioproduction business and will strengthen its capabilities across upstream and downstream biologics workflows, which are closely tied to bioprocess validation needs.
- In January 2025, Repligen launched the CTech SoloVPE PLUS System, a new at-line UV-Vis concentration measurement platform for bioprocessing applications. Repligen stated that the product is designed to deliver higher accuracy, speed, and ease of use, helping customers make faster process decisions and improve analytical control during manufacturing.
Report Scope
| Report Attribute |
Details |
| Market size value in 2025 |
USD 426.54 million |
| Revenue forecast in 2032 |
USD 1093.81 million |
| Growth rate (CAGR) |
14.4% (2025–2032) |
| Base year |
2025 |
| Forecast period |
2026-2032 |
| Quantitative units |
USD million |
| Segments covered |
By Test Type; By Process Component; By Stage of Bioprocess; By End User |
| Regional scope |
North America, Europe, Asia Pacific, Latin America, Middle East & Africa |
| Key companies profiled |
Thermo Fisher Scientific Inc.; Merck KGaA; Sartorius AG; SGS SA; Eurofins Scientific; Pall Corporation; Charles River Laboratories; WuXi AppTec; Nelson Laboratories; TÜV SÜD |
| No.of Pages |
332 |
Segmentation
By Test Type
- Extractables/Leachables Testing Services
- Microbiological Testing Services
- Physiochemical Testing Services
- Integrity Testing Services
- Compatibility Testing Services
- Other Test Types
By Process Component
- Filter Elements
- Media Containers & Bags
- Bioreactors
- Mixing Systems
- Freezing & Thawing Process Bags
- Other Process Components
By Stage of Bioprocess
- Upstream Bioprocessing
- Downstream Bioprocessing
- Fill-Finish Operations
By End User
- Pharmaceutical Companies
- Biotechnology Companies
- CDMOs
- Other End Users
By Region
- North America
- Europe
- Germany
- France
- U.K.
- Italy
- Spain
- Rest of Europe
- Asia Pacific
- China
- Japan
- India
- South Korea
- South-east Asia
- Rest of Asia Pacific
- Latin America
- Brazil
- Argentina
- Rest of Latin America
- Middle East & Africa
- GCC Countries
- South Africa
- Rest of the Middle East and Africa


