
Crispr Diagnostics Market Overview:
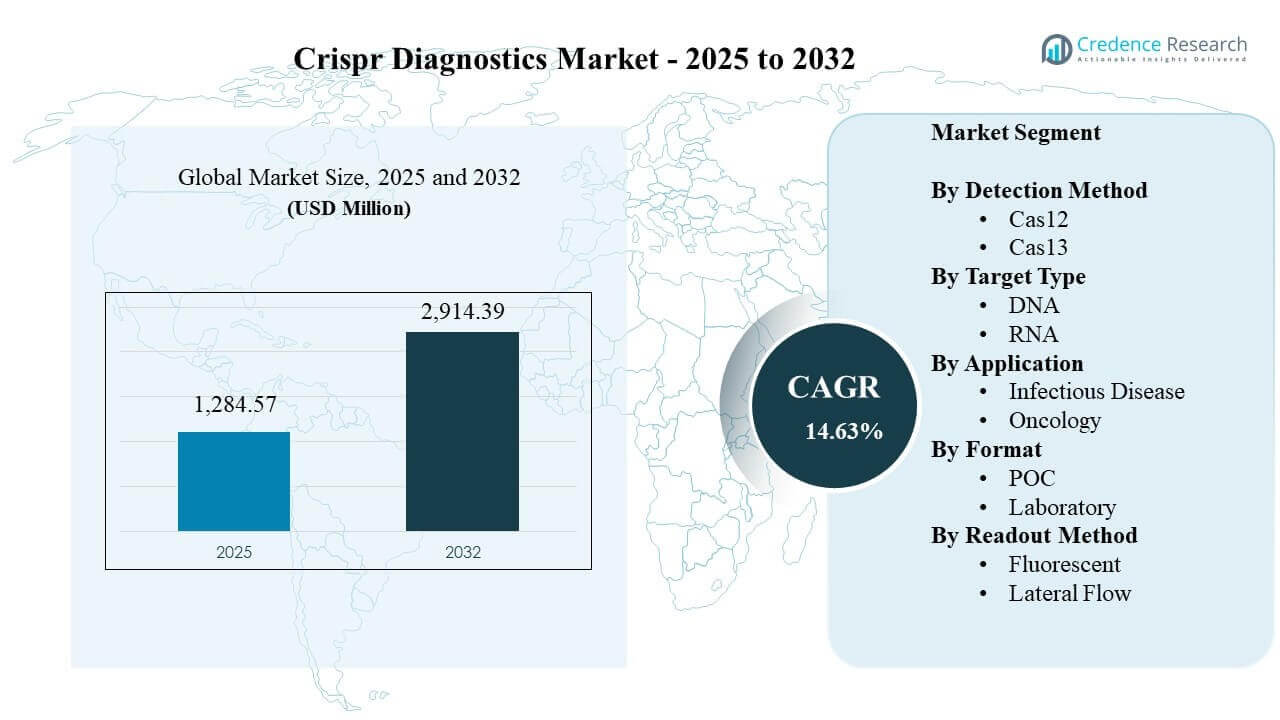
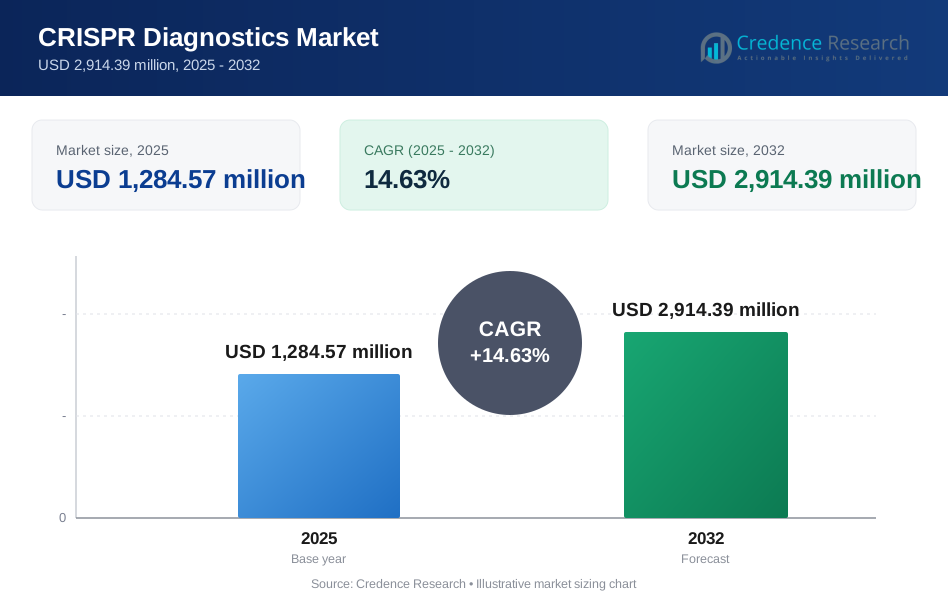
The global Crispr Diagnostics Market size was estimated at USD 1,284.57 million in 2025 and is expected to reach USD 2,914.39 million by 2032, growing at a CAGR of 14.63% from 2025 to 2032. Growth is primarily driven by rising demand for rapid molecular testing that can deliver clinically actionable results with shorter turnaround times and adaptable assay design. Product road maps increasingly emphasize streamlined workflows and deployment flexibility across decentralized and central lab environments, supporting broader adoption across healthcare systems.
| REPORT ATTRIBUTE | DETAILS |
|---|---|
| Historical Period | 2020-2024 |
| Base Year | 2025 |
| Forecast Period | 2026-2032 |
| CRISPR Diagnostics Market Size 2025 | USD 1,284.57 million |
| CRISPR Diagnostics Market, CAGR | 14.63% |
| CRISPR Diagnostics Market Size 2032 | USD 2,914.39 million |
Key Market Trends & Insights
- The Crispr Diagnostics Market is projected to expand from USD 1,284.57 million (2025) to USD 2,914.39 million (2032), reflecting sustained scaling of CRISPR-enabled testing pipelines.
- The market is forecast to grow at a 14.63% CAGR (2025–2032), supported by wider clinical validation and commercialization focus.
- Infectious Disease represented the largest application share at 50.6% (2025), reflecting priority use cases tied to rapid pathogen detection and outbreak readiness.
- Cas12 accounted for the leading detection-method share at 45.8% (2025), benefiting from established assay architectures and integration into streamlined detection workflows.
- North America led regional demand with a 44.9% share (2025), supported by strong molecular testing infrastructure and faster uptake of novel diagnostics platforms.
Segment Analysis
Crispr Diagnostics Market adoption is shaped by clinical needs for speed, sensitivity, and operational simplicity across diverse testing settings. Buyers increasingly evaluate solutions based on time-to-result, workflow steps, sample preparation complexity, and how easily assays can be updated for new targets. Purchasing and implementation decisions also emphasize reliability, quality systems, and the ability to scale manufacturing and distribution for routine testing volumes.
Use-case expansion is occurring as developers and diagnostic stakeholders pursue broader menus beyond early infectious disease priorities. Oncology-oriented pathways are gaining attention as biomarker-led care grows and stakeholders seek approaches that can support low-abundance target detection within practical workflows. Format and readout decisions continue to reflect the trade-offs between instrumented performance and field usability, with clinical environments selecting configurations aligned to staffing, throughput requirements, and care delivery models.
By Detection Method Insights
Cas12 accounted for the largest share of 45.8% in 2025. Cas12-based detection is supported by signal amplification behaviors that can improve analytical sensitivity within nucleic-acid detection workflows. Cas12 assay architectures also align well with simplified workflow designs that reduce operational steps and improve repeatability across settings. Platform developers have continued to standardize components and protocols around Cas12 to support scalability and broader assay menu development.
By Target Type Insights
Target-type selection is shaped by disease biology, sample stability, and pre-analytical handling requirements. DNA targets often align with workflows where sample integrity is more stable and confirmatory pathways are well established. RNA targets can be attractive for certain infectious disease use cases but typically require tighter control of degradation and workflow robustness. Product teams continue to prioritize flexible target strategies that support multiplexing and improved diagnostic yield.
By Application Insights
Infectious Disease accounted for the largest share of 50.6% in 2025. Infectious disease adoption benefits from high-volume testing needs where rapid turnaround can improve triage and treatment decisions. CRISPR assay programmability supports faster retargeting to emerging variants and new pathogens in many development pipelines. Standardization of testing pathways and clearer clinical demand signals continue to reinforce infectious disease as the dominant application area.
By Format Insights
Format selection is driven by turnaround time expectations, staffing models, and infrastructure constraints across care settings. POC formats are often favored where decentralized deployment and minimal instrumentation are critical for access and workflow speed. Laboratory formats benefit from higher throughput operations, routine workflow integration, and standardized quality controls. Vendors that offer scalable configurations across POC and lab environments can widen addressable demand.
By Readout Method Insights
Readout choices reflect a trade-off between performance requirements and usability in the intended environment. Fluorescent readouts are commonly aligned with instrumented workflows that can support improved sensitivity and more controlled interpretation in lab settings. Lateral Flow readouts can reduce instrumentation needs and simplify result interpretation for decentralized use. Buyers also assess readout options based on cost, training burden, and consistency under real-world operating conditions.
Crispr Diagnostics Market Drivers
Faster time-to-result for molecular decisions
Crispr Diagnostics Market growth is supported by demand for rapid molecular answers that can accelerate clinical decisions in acute care and routine testing. Shorter turnaround times can reduce delays in treatment initiation and improve patient flow in high-volume environments. Health systems also value workflow designs that reduce manual steps and minimize hands-on time, improving operational efficiency. As molecular testing volumes expand, solutions that sustain performance at scale can gain preference in procurement decisions.
- For instance, Mammoth Biosciences reported that its CRISPR-Cas12 DETECTR SARS-CoV-2 assay produced results in about 30–40 minutes, achieved 95% positive predictive agreement and 100% negative predictive agreement across 83 respiratory swab samples, and had an estimated sample-to-result time of about 45 minutes with manual RNA extraction.
Expanding clinical validation and translational pathways
Broader clinical evaluation and validation programs are strengthening confidence in CRISPR-enabled diagnostics across use cases. Product development has increasingly focused on reproducibility, quality systems, and standardized reagent performance to support routine deployment. Integration into existing laboratory processes and data workflows is also improving translation into real-world settings. As evidence grows, adoption barriers associated with novelty and operational uncertainty tend to decline.
Programmable assay design and menu expansion
CRISPR-based detection enables programmable targeting that supports faster assay iteration across emerging needs. This characteristic supports broader menu development strategies, including syndromic panels and updated tests aligned to evolving pathogens. Programmability can also support modular product architectures that reuse platform components across multiple assays. Vendors that demonstrate stable performance across menus can improve customer confidence and expand recurring consumables revenue.
Infrastructure and investment momentum in molecular diagnostics
Investment in molecular testing infrastructure and workforce capabilities supports wider adoption of advanced diagnostics approaches. Many laboratories are upgrading workflows for throughput, automation, and reliability, creating pull-through demand for improved assays and compatible platforms. Decentralized care models and testing access initiatives also encourage innovations in simple, scalable formats. These shifts collectively reinforce sustained demand for next-generation molecular testing options.
- For instance, Sherlock Biosciences reported that an automated implementation of its high-throughput direct workflow could process 9,216 samples per day, while a single operator could process 190 samples in 70 minutes using a 384-well format.
Crispr Diagnostics Market Challenges
Crispr Diagnostics Market commercialization can be constrained by the complexity of translating analytical performance into consistent real-world clinical outcomes. Variability in sample quality, workflow execution, and operating environments can affect reliability and perceived value. Regulatory expectations, quality system requirements, and clinical validation timelines can extend development cycles and raise costs. Market adoption can also be slowed by conservative purchasing behavior when incumbent molecular methods are already embedded.
Competitive scaling challenges can also emerge around manufacturing readiness, supply continuity, and the ability to support multi-region distribution and service needs. Cost considerations remain important, particularly when health systems benchmark new solutions against established PCR workflows. Reimbursement, procurement cycles, and evidence thresholds can differ by region, complicating global rollouts. Vendors must also balance innovation speed with standardization to avoid fragmentation across product versions.
- For instance, Cepheid reported that its GeneXpert molecular platform had an installed base of almost 50,000 systems across 180 countries, demonstrating the scale of installed workflow infrastructure and service reach that newer CRISPR diagnostic vendors must overcome when trying to displace established PCR-based purchasing patterns.
Crispr Diagnostics Market Trends and Opportunities
Decentralized testing models are creating opportunities for CRISPR-enabled diagnostics in settings that need rapid answers with minimal infrastructure. Product road maps increasingly target simplified sample-to-result workflows that can reduce dependency on specialized molecular labs. This trend supports expansion of point-of-care strategies where time-to-result and operational simplicity determine adoption. Vendors that align with care pathway needs and training realities can increase penetration in distributed environments.
- For instance, Sherlock Biosciences said its CRISPR-based HPV program is being developed as a rapid, instrument-free molecular test for remote settings, with high-sensitivity amplification in under five minutes, and the company also reported that its newer single-pot workflow can generate results in as few as 9 minutes for high-positive samples and about 20 minutes for a normal clinical sample, compared with more than 2 hours for its first FDA-authorized CRISPR COVID-19 kit.
Menu expansion beyond early infectious disease anchors is opening new opportunity areas, including oncology-adjacent biomarker applications and specialized testing pathways. As precision medicine expands, stakeholders seek assays that can support clinically relevant targets with practical operational designs. Hybrid strategies that link rapid screening with confirmatory workflows can also strengthen value propositions. Partnerships across diagnostic developers, platform providers, and healthcare delivery stakeholders can accelerate commercialization routes.
Regional Insights
North America
North America held 44.9% share in 2025, supported by strong molecular testing capacity and faster uptake of novel diagnostic approaches. Healthcare systems benefit from advanced laboratory networks and established procurement pathways for high-complexity diagnostics. Commercial adoption is reinforced by deeper access to validation infrastructure, partnerships, and distribution capabilities. Demand is also supported by the region’s focus on preparedness and scalable testing models across clinical settings.
Europe
Europe accounted for 26.6% share in 2025, driven by mature laboratory practices and structured clinical pathways across major markets. Adoption is influenced by evidence requirements, outcomes consistency, and cost-focused procurement standards in many healthcare systems. Laboratories often prioritize workflow standardization, quality control rigor, and integration with existing diagnostic operations. Vendors that demonstrate operational reliability and fit within standardized pathways tend to gain traction.
Asia Pacific
Asia Pacific represented 21.8% share in 2025, supported by expanding access to molecular diagnostics and growth in hospital capabilities across major economies. Investments in laboratory infrastructure, rising diagnostic volumes, and public health priorities support adoption of rapid and scalable testing approaches. Market expansion is shaped by uneven access between urban and non-urban settings, increasing the attractiveness of flexible formats. Companies that provide scalable portfolios and local support can improve penetration.
Latin America
Latin America captured 4.6% share in 2025, with adoption driven by gradual expansion of molecular testing capacity and higher focus on infectious disease management. Procurement can be sensitive to pricing, distribution reach, and continuity of supply, particularly for consumables-dependent workflows. Expansion tends to concentrate in major urban centers with stronger laboratory infrastructure. Vendors that simplify workflows and offer robust channel strategies can improve adoption across the region.
Middle East & Africa
Middle East & Africa held 2.1% share in 2025, reflecting uneven molecular testing access and infrastructure variability across countries. Demand growth is supported by public health initiatives, capacity-building programs, and rising interest in faster diagnostic answers in select markets. Adoption can be constrained by workforce limitations, procurement complexity, and budget pressures. Solutions emphasizing ease of use, training support, and operational resilience are positioned for stronger uptake.
Competitive Landscape
Competition in the Crispr Diagnostics Market is shaped by platform performance, assay menu breadth, workflow simplicity, and the ability to scale manufacturing and distribution. Market participants differentiate through faster time-to-result designs, stronger analytical sensitivity, and integration pathways suited to laboratory and decentralized environments. Partnerships and licensing agreements influence access to core IP and commercialization channels, while product road maps increasingly emphasize operational reliability and standardization. Companies that can demonstrate repeatable performance across real-world workflows are better positioned for sustained adoption.
Sherlock Biosciences is positioned around CRISPR-enabled molecular testing programs that emphasize usability and clinical validation pathways that can support broader access models. Sherlock Biosciences has pursued development approaches aligned to disposable and streamlined workflows to reduce operational friction in decentralized settings. Commercial strategy is strengthened through partnerships and broader channel reach to support scaling beyond early adopter environments. Continued focus on validation, quality systems, and real-world performance can support broader adoption across target applications.
The industry research and growth report includes detailed analyses of the competitive landscape of the market and information about key companies, including:
- Sherlock Biosciences
- Mammoth Biosciences
- Roche
- Abbott
- Thermo Fisher
- Qiagen
- Twist Bioscience
- Bio-Rad
- Illumina
- Cepheid
Qualitative and quantitative analysis of companies has been conducted to help clients understand the wider business environment as well as the strengths and weaknesses of key industry players. Data is qualitatively analyzed to categorize companies as pure play, category-focused, industry-focused, and diversified; it is quantitatively analyzed to categorize companies as dominant, leading, strong, tentative, and weak.
Recent Developments
- In May 2024, Sherlock Biosciences initiated clinical evaluation activity focused on an OTC-oriented disposable molecular test pathway for chlamydia and gonorrhea versus central lab PCR, supporting evidence generation for decentralized molecular testing models.
- In December 2024, a corporate acquisition involving Sherlock Biosciences strengthened commercialization reach and distribution capability, supporting broader scaling routes for CRISPR-enabled diagnostics programs.
- In September 2025, Mammoth Biosciences supported downstream diagnostic development through a technology licensing agreement, enabling additional diagnostic players to incorporate CRISPR-based detection capabilities into product pipelines.
- In April 2025, Cepheid pursued a strategic collaboration to advance automated workflows that connect sample and preparation pathways with advanced analysis approaches for infectious disease applications, signaling continued platform convergence in molecular testing.
Report Scope
| Report Attribute | Details |
| Market size value in 2025 | USD 1,284.57 million |
| Revenue forecast in 2032 | USD 2,914.39 million |
| Growth rate (CAGR) | 14.63% (2025–2032) |
| Base year | 2025 |
| Forecast period | 2026–2032 |
| Quantitative units | USD million |
| Segments covered | By Detection Method; By Target Type; By Application; By Format; By Readout Method |
| Regional scope | North America, Europe, Asia Pacific, Latin America, Middle East & Africa |
| Key companies profiled | Sherlock Biosciences; Mammoth Biosciences; Roche; Abbott; Thermo Fisher; Qiagen; Twist Bioscience; Bio-Rad; Illumina; Cepheid |
| No. of Pages | 334 |
Segmentation
By Detection Method
- Cas12
- Cas13
By Target Type
- DNA
- RNA
By Application
- Infectious Disease
- Oncology
By Format
- POC
- Laboratory
By Readout Method
- Fluorescent
- Lateral Flow
By Region
- North America
- U.S.
- Canada
- Mexico
- Europe
- Germany
- France
- U.K.
- Italy
- Spain
- Rest of Europe
- Asia Pacific
- China
- Japan
- India
- South Korea
- South-east Asia
- Rest of Asia Pacific
- Latin America
- Brazil
- Argentina
- Rest of Latin America
- Middle East & Africa
- GCC Countries
- South Africa
- Rest of the Middle East and Africa
Request a Free Sample
Fill in your details and we'll send you a free sample report.
- Sample data tables & charts
- Research methodology
Need a Custom Version of This Report?
Tailor the scope, geography, or segments to your exact requirements.
- Custom geography or segment scope
- Direct access to our analyst team
Frequently Asked Questions
What is the market size and forecast for the Crispr Diagnostics Market?
What is the CAGR for the Crispr Diagnostics Market?
What is the largest segment in the Crispr Diagnostics Market?
What factors are driving growth in the Crispr Diagnostics Market?
Who are the leading companies in the Crispr Diagnostics Market?
Which region leads the Crispr Diagnostics Market?
Table of Content
Chapter 1. Report Introduction
- 1.1 Report Description & Purpose
- 1.1.1 Report Title & Market Definition
- 1.1.2 Unique Selling Propositions (USP) & Key Differentiators
- 1.1.3 Value Proposition for Stakeholders
- 1.2 Research Objectives
- 1.2.1 Market Sizing Objectives (Volume & Revenue)
- 1.2.2 Segmentation Objectives
- 1.2.3 Competitive Intelligence Objectives
- 1.2.4 Forecast & Scenario Objectives
- 1.3 Report Scope
- 1.3.1 CRISPR Diagnostics Scope – Types & Subtypes Covered
- 1.3.2 Geographic Scope – Regions & Countries Covered
- 1.3.3 Historical Period, Base Year & Forecast Period (2025; forecast to 2032)
- 1.3.4 Inclusions & Exclusions
- 1.4 HS Code & Classification Framework
- 1.5 Currency, Units & Pricing Basis
- 1.6 Target Stakeholders
- 1.7 Limitations & Assumptions
Chapter 2. Executive Summary
- 2.1 Global CRISPR Diagnostics Market Snapshot
- 2.1.1 Market Size – Historical (2025) & Forecast (2025-2032) (2025: USD 1,284.57 million → 2032: USD 2,914.39 million)
- 2.1.2 Volume & Revenue – Global Totals
- 2.1.3 Key Market Highlights – Top Five Facts
- 2.2 CRISPR Diagnostics Market Segmentation Snapshot
- 2.2.1 Market Split by Region – 2025 vs. 2032
- 2.3 Competitive Snapshot
- 2.3.1 Top 10 Players by Revenue Share – 2025
- 2.3.2 Top 10 Players by Volume Share – 2025
- 2.3.3 Recent Strategic Developments (18-Month Summary)
- 2.4 Key Investment Highlights & Strategic Conclusions
Chapter 3. CRISPR Diagnostics Market Dynamics & Industry Analysis
- 3.1 Market Overview & Context
- 3.1.1 CRISPR Diagnostics Market Position in the Broader Automotive Value Chain
- 3.1.2 OEM vs. Replacement Market Dynamics
- 3.1.3 Market Maturity & Development Stage by Region
- 3.2 CRISPR Diagnostics Market Drivers
- 3.3 CRISPR Diagnostics Market Restraints & Challenges
- 3.4 CRISPR Diagnostics Market Opportunities
- 3.5 Porter's Five Forces Analysis
- 3.5.1 Threat of New Entrants
- 3.5.2 Bargaining Power of Suppliers
- 3.5.3 Bargaining Power of Buyers
- 3.5.4 Threat of Substitutes
- 3.5.5 Competitive Rivalry – Intensity Assessment
- 3.6 CRISPR Diagnostics Value Chain Analysis
- 3.6.1 Upstream – Raw Material/Input Suppliers
- 3.6.1.1 Raw Material/Input 1
- 3.6.1.2 Raw Material/Input 2
- 3.6.1.3 Raw Material/Input 3
- 3.6.2 Midstream – Production/Manufacturing/Service Delivery
- 3.6.2.1 Production/Process Overview
- 3.6.2.2 Key Facility Locations & Capacity by Manufacturer
- 3.6.3 Downstream – Distribution & End Consumer
- 3.6.3.1 Primary Channel – B2B/OEM
- 3.6.3.2 Secondary Channels – Dealer, Retail, Online, Direct
- 3.6.4 Value Chain Profitability Analysis
- 3.6.1 Upstream – Raw Material/Input Suppliers
- 3.7 PESTEL Analysis
- 3.7.1 Political Factors
- 3.7.2 Economic Factors
- 3.7.3 Social Factors
- 3.7.4 Technological Factors
- 3.7.5 Environmental Factors
- 3.7.6 Legal Factors
- 3.8 CRISPR Diagnostics Supply Chain Analysis
- 3.8.1 Raw Material/Input Supply Risk Assessment
- 3.8.2 Manufacturing Concentration Risk (Geographic Exposure)
- 3.8.3 Trade Disruption Impact Analysis
- 3.9 Regulatory & Policy Landscape
Note: The regulatory and policy landscape section covers regulations based on their applicability to the market, CRISPR Diagnostics category, geography, and scope of the study. Only regulatory frameworks with a material impact on operations, compliance, trade, sustainability, or market access are analyzed in detail.
Chapter 4. Key Investment Pockets & Opportunity Analysis
- 4.1 CRISPR Diagnostics Market Attractiveness Analysis
- 4.1.1 By Region – Investment Attractiveness Matrix (Volume × CAGR)
- 4.2 Absolute Revenue Growth Opportunity
- 4.2.1 By Region – Absolute USD Growth Through 2032
- 4.3 Incremental Volume Opportunity
- 4.3.1 By Region – Incremental Volume Through 2032
- 4.3.2 Segment – Incremental Volume
- 4.4 Emerging Submarket Opportunity Deep Dive (Subject to Applicability)
- 4.5 Emerging Market Opportunity Scorecards
- 4.5.1 United States
- 4.5.2 Europe
- 4.5.3 Asia
- 4.5.4 Middle East & Africa
Note: Emerging Market Opportunity Scorecards will be included based on relevance and strategic importance. Regions listed are indicative and may vary depending on data availability and market dynamics.
Chapter 5. CRISPR Diagnostics Import-Export Analysis & Trade Flows
- 5.1 Global Trade Overview
- 5.1.1 Global Export Value by Country (2025)
- 5.1.2 Global Export Volume by Country (2025)
- 5.1.3 Global Import Value by Country (2025)
- 5.1.4 Global Import Volume by Country (2025)
- 5.1.5 Net Trade Balance by Country (2025)
- 5.2 Export Analysis – Segment
- 5.2.1 Type 1 (HS Code)
- 5.2.2 Type 2 (HS Code)
- 5.2.3 Type 3 (HS Code)
- 5.2.4 Type 4 (HS Code)
- 5.2.5 Type 5 (HS Code)
- 5.3 Import Analysis – Segment
- 5.3.1 Type 1 (HS Code)
- 5.3.2 Type 2 (HS Code)
- 5.3.3 Type 3 (HS Code)
- 5.3.4 Type 4 (HS Code)
- 5.3.5 Type 5 (HS Code)
- 5.4 Average Unit Trade Prices
- 5.4.1 Average Export Price – Segment & Country
- 5.4.2 Average Import Price – Segment & Source Country
- 5.4.3 Price Trends (2025)
- 5.5 Key Trade Route Analysis
- 5.5.1 Trade Route 1
- 5.5.2 Trade Route 2
- 5.5.3 Trade Route 3
- 5.5.4 Trade Route 4
- 5.5.5 Trade Route 5
- 5.6 Trade Policy Impact Assessment
- 5.6.1 US Anti-Dumping & Section 301 Tariffs
- 5.6.2 EU Customs Union Impact
- 5.6.3 Major Free Trade Agreements
- 5.6.4 USMCA Rules of Origin
Note: Trade policy analysis will be included only where relevant to the CRISPR Diagnostics market.
Chapter 6. Competitive Landscape & Company Benchmarking
- 6.1 CRISPR Diagnostics Market Concentration & Structure
- 6.1.1 Herfindahl-Hirschman Index (HHI) – vs. 2025
- 6.1.2 Tier 1, Tier 2 & Tier 3 Market Structure
- 6.1.3 Global, Regional & Local Player Dynamics
- 6.2 CRISPR Diagnostics Market Share Analysis – 2025
- 6.2.1 Global Revenue Share by Company
- 6.2.2 Global Volume Share by Company
- 6.2.3 Regional Revenue Share
- 6.2.4 Market Share Evolution ( vs. 2025)
- 6.2.5 OEM Segment Share by Company
- 6.2.6 Replacement Segment Share by Company
- 6.3 Production/Delivery Capacity & Facility Analysis
- 6.3.1 Global Installed Capacity
- 6.3.2 Capacity Utilization Rates
- 6.3.3 Production/Output Volume
- 6.3.4 Facility Locations & Capacity Map
- 6.3.5 Planned Capacity Additions
- 6.4 CRISPR Diagnostics Competitive Benchmarking Matrix
- 6.4.1 Revenue, Volume, CAGR & Profitability Comparison
- 6.4.2 Channel Revenue Mix
- 6.4.3 Geographic Revenue Exposure
- 6.4.4 R&D Intensity
- 6.4.5 Sustainability Maturity
- 6.5 Strategic Developments in CRISPR Diagnostics (Last 24 Months)
- 6.5.1 Mergers, Acquisitions & Divestments
- 6.5.2 New CRISPR Diagnostics Launches
- 6.5.3 Facility Expansions
- 6.5.4 Strategic Alliances, Joint Ventures & Partnerships
- 6.5.5 Distribution Expansion & Market Entry
- 6.5.6 Sustainability & ESG Initiatives
- 6.6 Competitive Strategy Mapping
- 6.6.1 Leader, Challenger, Follower & Niche Classification
- 6.6.2 Pricing Strategy Comparison
- 6.6.3 Channel Strategy Matrix
Note: Strategic developments are included based on their materiality and the availability of reliable information.
Chapter 7. Global CRISPR Diagnostics Market – By Distribution Channel
- 7.1 Segment Overview
- 7.1.1 Volume & Revenue Split by Channel (2025 & 2032)
- 7.1.2 Channel Mix Evolution (2025-2032)
Chapter 8. Regional Market Analysis – Global Overview
- 8.1 Global Regional Overview
- 8.1.1 Regional Volume Share
- 8.1.2 Regional Revenue Share
- 8.1.3 Regional Volume by Region
- 8.1.4 Regional Revenue by Region
- 8.1.5 Regional Forecast Through 2032
- 8.2 Cross-Regional Segment Analysis
- 8.2.1 By Distribution Channel
- 8.2.2 By Brand/Price Tier
Chapter 9. North America CRISPR Diagnostics Market
- 9.1 United States
- 9.2 Canada
- 9.3 Mexico
Chapter 10. Europe CRISPR Diagnostics Market
- 10.1 Germany
- 10.2 France
- 10.3 Italy
- 10.4 United Kingdom
- 10.5 Spain
- 10.6 Poland
- 10.7 Russia
- 10.8 Netherlands
- 10.9 Belgium
- 10.10 Sweden
- 10.11 Denmark
- 10.12 Norway
- 10.13 Rest of Europe
Chapter 11. Asia Pacific CRISPR Diagnostics Market
- 11.1 China
- 11.2 India
- 11.3 Japan
- 11.4 South Korea
- 11.5 Thailand
- 11.6 Indonesia
- 11.7 Vietnam
- 11.8 Malaysia
- 11.9 Australia
- 11.10 Rest of Asia Pacific
Chapter 12. Latin America CRISPR Diagnostics Market
- 12.1 Brazil
- 12.2 Argentina
- 12.3 Colombia
- 12.4 Chile
- 12.5 Rest of Latin America
Chapter 13. Middle East CRISPR Diagnostics Market
- 13.1 Saudi Arabia
- 13.2 United Arab Emirates
- 13.3 Turkey
- 13.4 Israel
- 13.5 Iran
- 13.6 Rest of the Middle East
Chapter 14. Africa CRISPR Diagnostics Market
- 14.1 South Africa
- 14.2 Egypt
- 14.3 Nigeria
- 14.4 Morocco
- 14.5 Rest of Africa
Chapter 15. CRISPR Diagnostics Company Profiles
- 15.1 [Company 01]
- 15.1.1 Company Overview
- 15.1.2 Key Management Personnel
- 15.1.3 Products & Services Portfolio
- 15.1.4 Financial Performance
- 15.1.5 Key Market Focus & Geographic Presence
- 15.1.6 Recent Developments & Strategic Initiatives
Note: The company profile list is preliminary and may change based on research findings, market developments, data availability, and client requirements.
Chapter 16. Appendices
- Appendix A – List of Abbreviations & Acronyms
- Appendix B – Industry Classification Code Reference – Full Series
- Appendix C – Production & Capacity Data Tables
- Appendix D – End-Use & Demand Base Tables
- Appendix E – Consumption & Replacement Rate Assumptions
- Appendix F – ASP Reference Tables
- Appendix G – Manufacturing & Facility Database
- Appendix H – Import-Export Data Tables
- Appendix I – Regulatory Summary Tables
- Appendix J – Primary Research Participant List (Anonymized)
- Appendix K – Primary Research Questionnaire Framework
- Appendix L – Data Sources & Bibliography
- Appendix M – Market Size Divergence & Source Comparison
Chapter 17. Research Methodology
- 17.1 Research Framework & Philosophy
- 17.2 Secondary Research – Sources, Hierarchy & Data Extraction
- 17.3 Data Modeling – Bottom-Up & Top-Down Market Sizing
- 17.4 Primary Research – Stakeholder Framework, LOI & Sample Sizes
- 17.5 Forecast Methodology – Regression, Scenario & Sensitivity Analysis
- 17.6 Quality Control – Four-Layer Validation Framework
- 17.7 Limitations & Standard Assumptions
- 17.8 Disclaimer
