
Cell Analysis Instruments Market Overview:
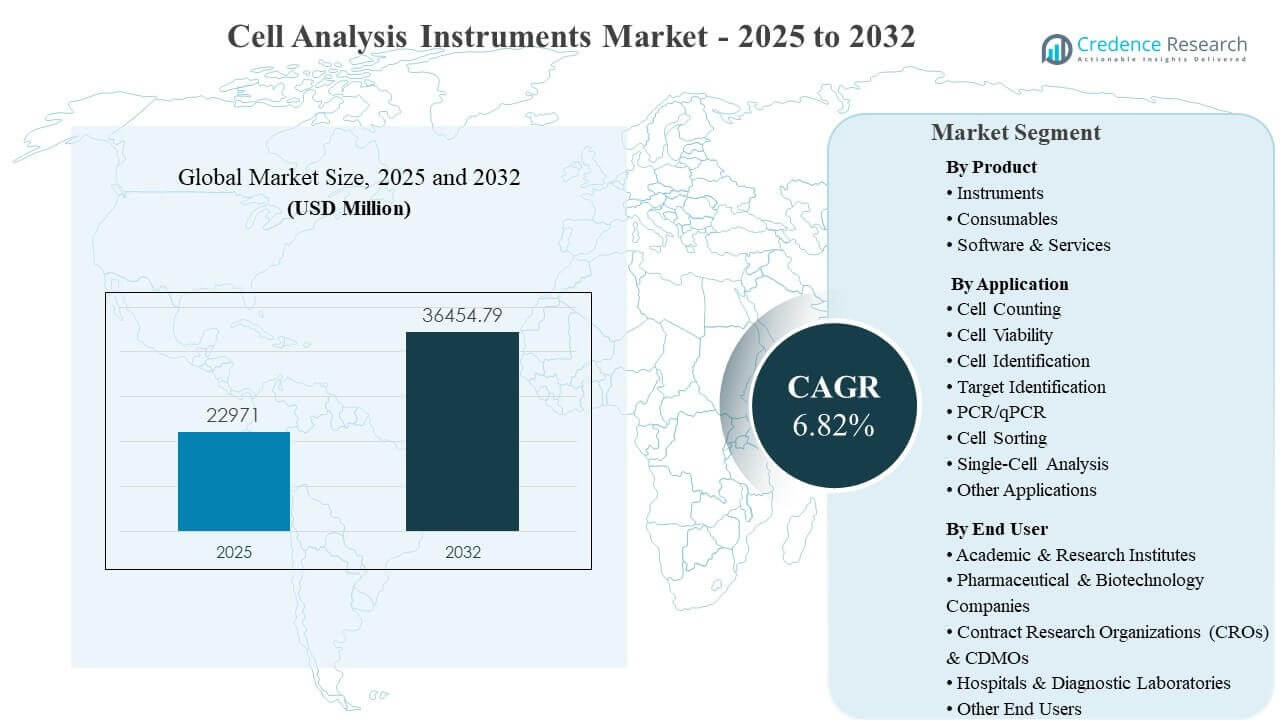
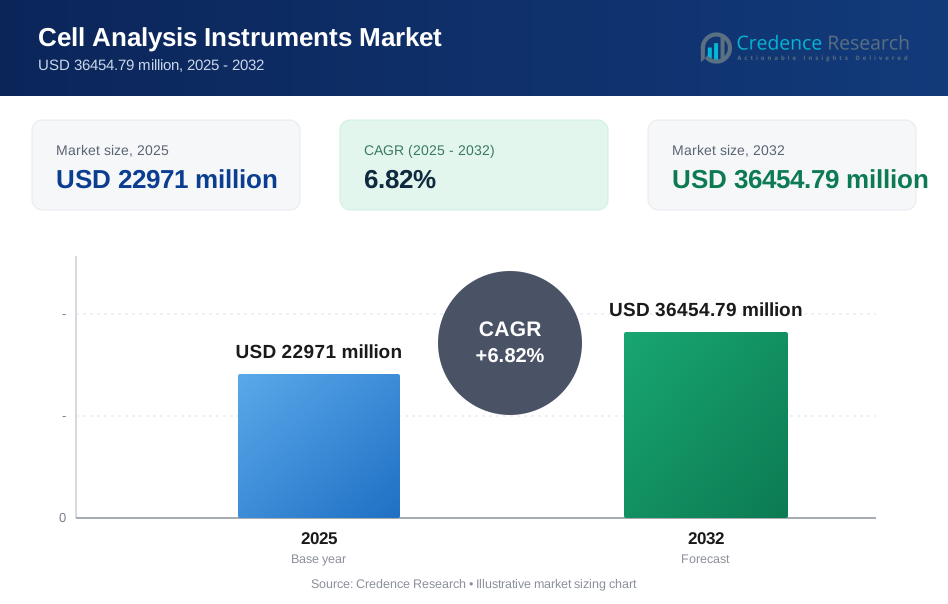
The global Cell analysis instruments market size was estimated at USD 22971 million in 2025 and is expected to reach USD 36454.79 million by 2032, growing at a CAGR of 6.82% from 2025 to 2032. Expansion of cell-based workflows across drug discovery, translational research, and advanced therapy development is increasing demand for accurate, repeatable measurements of phenotype, viability, and functional responses. Wider adoption of automation and higher-parameter platforms is strengthening utilization in mature markets and accelerating uptake across Asia Pacific research and biomanufacturing hubs.
| REPORT ATTRIBUTE | DETAILS |
|---|---|
| Historical Period | 2020-2024 |
| Base Year | 2025 |
| Forecast Period | 2026-2032 |
| Cell Analysis Instruments Market Size 2025 | USD 22971 million |
| Cell Analysis Instruments Market, CAGR | 6.82% |
| Cell Analysis Instruments Market Size 2032 | USD 36454.79 million |
Key Market Trends & Insights
- The Cell analysis instruments market is projected to increase from USD 22971 million (2025) to USD 36454.79 million (2032) at a 6.82% CAGR (2025–2032).
- Consumables held 55.40% share in 2025 within the By Product segmentation, supported by recurring replenishment tied to installed instrument bases.
- Cell Counting accounted for 34.20% share in 2025 within the By Application segmentation, reflecting ongoing demand for routine QC and workflow standardization.
- Academic & Research Institutes captured 41.30% share in 2025 within the By End User segmentation, driven by high utilization across shared core facilities and research programs.
- Asia Pacific represented 31.70% share in 2025, reflecting expanding research infrastructure and growing adoption of advanced cell analysis workflows.
Segment Analysis
Procurement patterns in the Cell analysis instruments market are shaped by a combination of capital investments in instruments and recurring purchases of workflow consumables. Consumables demand remains structurally resilient because assays, staining, sample preparation, and disposable components require continuous replenishment, particularly in high-throughput environments. Instrument purchasing is increasingly influenced by throughput, automation readiness, multiplex capability, and standardized operating procedures that reduce variability across operators and sites.
Data generation is rising rapidly in the Cell analysis instruments market as laboratories transition toward multiparametric phenotyping, imaging-linked measurement, and single-cell resolution workflows. This shift increases demand for software and services that support workflow standardization, audit readiness, and interoperability with data systems. Outsourced research and manufacturing activity also expands consumption intensity because CROs and CDMOs require scalable analytics, validated methods, and repeatable results for multi-client programs.
By Product Insights
Consumables accounted for the largest share of 55.40% in 2025. Consumables lead the Cell analysis instruments market because reagents, assay kits, stains, buffers, plates, and disposable workflow components are purchased repeatedly across routine and advanced workflows. Installed instrument bases across academic cores, biopharma labs, and outsourced service providers sustain steady replenishment cycles. Method standardization requirements also encourage validated consumable ecosystems that reduce run-to-run variability and improve reproducibility.
By Application Insights
Cell Counting accounted for the largest share of 34.20% in 2025. Cell counting remains foundational in the Cell analysis instruments market because upstream and downstream workflows depend on accurate concentration measurement for experimental design, quality control, and manufacturing-related calculations. Routine counting and viability-linked checks are embedded in screening, research, and production environments, creating consistent utilization. Automation in counting improves throughput and reduces operator-driven variability across high-volume laboratories.
By End User Insights
Academic & Research Institutes accounted for the largest share of 41.30% in 2025. Academic and research centers lead the Cell analysis instruments market because shared core facilities operate across multiple departments and projects, driving high instrument utilization and frequent consumable consumption. Grant-supported procurement expands access to flow cytometry, imaging, and emerging single-cell tools across universities and institutes. Publication intensity and translational research activity also encourage continuous workflow adoption and periodic capability upgrades.
Cell Analysis Instruments Market Drivers
Expansion Of Cell-Based Research Across Drug Discovery And Translational Programs
The Cell analysis instruments market is supported by sustained growth in cell-based research across drug discovery and translational programs. Screening workflows increasingly rely on cellular phenotypes, functional responses, and pathway signaling readouts that demand robust analytical instrumentation. Adoption of higher-throughput workflows increases instrument utilization and raises consumable pull-through per experiment. Standardization pressures also promote investment in validated platforms that improve reproducibility across sites and teams.
- For instance, Bruker Cellular Analysis launched the Beacon Discovery™ optofluidic system at AACR 2025, enabling live single-cell functional analysis with machine learning-driven automation; the platform isolates and analyzes individual cells over days to weeks, linking functional phenotypes to transcriptomic data from the same cell, and has already supported multiple peer-reviewed publications in immuno-oncology and T-cell receptor discovery programs.
Growth In Advanced Therapies And Bioprocessing Analytics Requirements
The Cell analysis instruments market is driven by increasing development activity in cell and gene therapies, which requires stringent characterization of cell identity, potency, and viability across multiple steps. Manufacturing-related environments prioritize repeatable analytics, documented workflows, and traceable outputs, increasing demand for compliant instruments and supporting software. Scale-up activity increases sample volumes and raises throughput requirements, encouraging automation and integrated workflows. These dynamics increase the value placed on end-to-end solutions that connect instruments, consumables, and services.
- For instance, Thermo Fisher Scientific's Gibco CTS DynaCellect™ Magnetic Separation System achieves >96% purity and >86% isolation efficiency for activated target T cells while maintaining cell viability, and automates Dynabeads removal with >91% target cell recovery, reducing manual handling in both autologous and allogeneic workflows.
Rising Adoption Of Multiparametric And Single-Cell Workflows
The Cell analysis instruments market benefits from the shift toward deeper phenotyping and single-cell resolution measurement in immunology, oncology, and systems biology. Multiplexed workflows increase the need for higher-parameter instruments, standardized staining panels, and robust sample preparation consumables. Data-rich experiments also elevate demand for analytical software that can handle complex datasets and support consistent interpretation. This technology direction supports both instrument upgrades and recurring consumption of workflow reagents.
Automation And Workflow Standardization Across Laboratories
The Cell analysis instruments market is supported by growing emphasis on automation to improve throughput and reduce operator-driven variability. Laboratories adopting standardized workflows prioritize instruments that deliver consistent results with simplified setup and reduced manual steps. Automation also supports resource efficiency, especially in high-volume labs facing staffing constraints or expanding project loads. These factors raise demand for integrated systems, service support, and software-enabled workflow management.
Cell Analysis Instruments Market Challenges
The Cell analysis instruments market faces challenges linked to high capital costs for advanced platforms, especially spectral flow systems, high-content imaging tools, and single-cell workflow equipment. Budget constraints can delay procurement cycles, particularly in smaller laboratories and emerging markets. Total cost of ownership also includes maintenance, calibration, service contracts, and consumables, which can compress purchasing flexibility. Complex instruments also require training and ongoing technical support to maintain performance and consistency.
The Cell analysis instruments market also contends with data complexity and interoperability barriers as multiparametric workflows generate larger and more complex datasets. Differences in file formats, analysis pipelines, and integration requirements can slow adoption of new tools across multi-site organizations. Method standardization across users and sites can be difficult when protocols vary by assay design and operator behavior. These challenges increase the need for robust application support, validated workflows, and standardized analytics.
- For instance, a single 50-parameter spectral flow run on the BD FACSymphony A5 produces >2 GB of list-mode FCS 3.1 files per sample, requiring specialized spectral unmixing algorithms and high-dimensional analysis tools that are not natively compatible with legacy compensation-based pipelines, forcing multi-site consortia to invest 3–6 months in harmonizing gating strategies and file-format conversions before cross-laboratory data pooling becomes feasible.
Cell Analysis Instruments Market Trends and Opportunities
The Cell analysis instruments market is seeing growing opportunity in software and services that enable standardized analysis, workflow traceability, and integration with laboratory informatics systems. Increased adoption of high-dimensional and single-cell workflows creates sustained demand for advanced analytics, visualization, and quality control tooling. Subscription-oriented software models can improve user access and shorten onboarding timelines for complex workflows. These capabilities strengthen vendor differentiation beyond hardware specifications alone.
The Cell analysis instruments market is also benefiting from broader adoption of modular and upgradeable instrument architectures that reduce replacement costs and accelerate feature adoption. Modular spectral upgrades, automation add-ons, and workflow-specific configurations help organizations expand capability without full system replacement. Expansion of CRO and CDMO service capacity creates additional opportunity because outsourced environments require scalable analytics and validated workflows for multiple sponsors. These trends support integrated solutions that connect instruments, consumables, and service coverage.
- For instance, Beckman Coulter's CytoFLEX mosaic Spectral Detection Module, launched in March 2025, provides an industry-first modular spectral upgrade for existing CytoFLEX platforms, expanding detection capacity to up to 88 channels and improving spectral unmixing resolution by over 40% compared to conventional bandpass configurations, a capability now deployed in CRO environments to validate 40+ color immunophenotyping panels for multi-sponsor oncology trials.
Regional Insights
North America
North America contributed 34.60% of 2025 revenue in the Cell analysis instruments market, supported by strong research infrastructure and high adoption of advanced analytical workflows across academia and industry. Dense biotech and biopharma ecosystems sustain demand for cytometry, imaging, and single-cell workflows used in discovery and translational pipelines. Standardization expectations and mature technical service coverage encourage periodic upgrades and high utilization. Advanced therapy development activity further increases demand for validated workflows and consistent analytical outputs.
Europe
Europe represented 20.80% of 2025 revenue in the Cell analysis instruments market, supported by established pharmaceutical presence, strong academic networks, and sustained use of standardized analytical methods. European laboratories emphasize reproducibility, method validation, and interoperability, which supports integrated instrument and analytics adoption. Translational research activity sustains demand for phenotyping, viability, and molecular readouts. Modernization of core facilities and replacement cycles continue to reinforce steady procurement.
Asia Pacific
Asia Pacific accounted for 31.70% of 2025 revenue in the Cell analysis instruments market, reflecting rapid scaling of research capacity and expanding biomanufacturing footprints. Adoption is increasing across academia and industry as precision medicine programs and biologics manufacturing capabilities expand. Wider availability of distribution and technical support improves access to advanced platforms across multiple countries. Rising project volumes and infrastructure buildouts support both instrument demand and recurring consumables consumption.
Latin America
Latin America captured 7.90% of 2025 revenue in the Cell analysis instruments market, with adoption concentrated in major research hubs and leading hospital networks. Budget sensitivity shapes procurement toward high-utility workflows and shared core facilities that maximize instrument utilization. Import dependence increases the importance of distributor coverage and service availability for purchasing decisions. Gradual expansion of CRO activity and regional research programs supports steady adoption.
Middle East & Africa
Middle East & Africa contributed 5.00% of 2025 revenue in the Cell analysis instruments market, with demand concentrated in select research centers and healthcare systems investing in laboratory modernization. Adoption often accelerates when bundled solutions include training, maintenance, and workflow standardization support. Expansion of academic capacity and translational research initiatives is strengthening baseline utilization for core analysis tools. Incremental growth is supported by broader investments in diagnostics capability and research infrastructure.
Competitive Landscape
Competition in the Cell analysis instruments market is shaped by platform breadth, workflow integration, and recurring revenue models tied to consumables and software. Vendors differentiate through higher-parameter measurement, automation readiness, throughput scalability, and improved reproducibility across workflows. Integrated ecosystems that connect instruments, reagents, and analytics can increase switching costs and strengthen customer retention. Application support and service networks also influence purchasing decisions in both research-intensive and regulated environments.
Thermo Fisher Scientific Inc. competes in the Cell analysis instruments market through broad workflow coverage that links instruments, reagents, and software-enabled analysis across routine and advanced cell workflows. Thermo Fisher Scientific Inc. benefits from scale in distribution and technical service, which supports uptime and standardized assay execution. Product positioning often prioritizes integrated workflows that reduce operational handoffs and improve turnaround times for cell-based analysis. Portfolio breadth supports adoption across academic, biopharma, and outsourced environments.
The industry research and growth report includes detailed analyses of the competitive landscape of the market and information about key companies, including:
- Thermo Fisher Scientific Inc.
- Danaher Corporation (Beckman Coulter Life Sciences)
- Becton, Dickinson and Company (BD)
- Merck KGaA
- Sartorius AG
- Agilent Technologies
- Bio-Rad Laboratories
- Miltenyi Biotec
- PerkinElmer (Revvity)
- 10x Genomics
- Nikon Corporation
- Yokogawa Electric Corporation
- Sysmex Corporation
- STEMCELL Technologies
- Luminex Corporation (DiaSorin)
Qualitative and quantitative analysis of companies has been conducted to help clients understand the wider business environment as well as the strengths and weaknesses of key industry players. Data is qualitatively analyzed to categorize companies as pure play, category-focused, industry-focused, and diversified; it is quantitatively analyzed to categorize companies as dominant, leading, strong, tentative, and weak.
Recent Developments
- In January 2025, Revvity, Inc. unveiled Phenologic.AI at SLAS2025 as a new software solution for cellular imaging workflows. Revvity said the platform uses pre-trained deep-learning models to analyze brightfield images and streamline live cell analysis in its Harmony and Signals Image Artist software environment.
- In April 2025, Bruker Corporation announced the launch of the Beacon Discovery Optofluidic System, a compact benchtop platform designed to expand access to live single-cell functional analysis. The company said the new system offers a lower cost of ownership, supports machine learning-driven automation, and opened for pre-orders with commercial shipments expected later in 2025.
- In April 2025, BioSkryb Genomics and Tecan Group introduced a high-throughput single-cell multiomics workflow through a new partnership. The collaboration combines BioSkryb’s ResolveOME Whole Genome and Transcriptome Single-Cell Core Kit with Tecan’s Uno Single Cell Dispenser to support scalable, high-resolution analysis of hundreds to thousands of individual cells.
- In May 2025, BD (Becton, Dickinson and Company) launched the BD FACSDiscover A8 Cell Analyzer, positioning it as a landmark system for spectral and real-time imaging cell analysis. According to BD, the analyzer was built to bring advanced cell analysis capabilities to a wider range of researchers across academia and biopharma.
Report Scope
| Report Attribute | Details |
| Market size value in 2025 | USD 22971 million |
| Revenue forecast in 2032 | USD 36454.79 million |
| Growth rate (CAGR) | 6.82% (2025–2032) |
| Base year | 2025 |
| Forecast period | 2026-2032 |
| Quantitative units | USD million |
| Segments covered | By Product Outlook: Instruments, Consumables, Software & Services; By Application Outlook: Cell Counting, Cell Viability, Cell Identification, Target Identification, PCR/qPCR, Cell Sorting, Single-Cell Analysis, Other Applications; By End User Outlook: Academic & Research Institutes, Pharmaceutical & Biotechnology Companies, Contract Research Organizations (CROs) & CDMOs, Hospitals & Diagnostic Laboratories, Other End Users |
| Regional scope | North America, Europe, Asia Pacific, Latin America, Middle East & Africa |
| Key companies profiled | Thermo Fisher Scientific Inc.; Danaher Corporation (Beckman Coulter Life Sciences); Becton, Dickinson and Company (BD); Merck KGaA; Sartorius AG; Agilent Technologies; Bio-Rad Laboratories; Miltenyi Biotec; PerkinElmer (Revvity); 10x Genomics; Nikon Corporation; Yokogawa Electric Corporation; Sysmex Corporation; STEMCELL Technologies; Luminex Corporation (DiaSorin) |
| No.of Pages | 334 |
Segmentation
By Product
- Instruments
- Consumables
- Software & Services
By Application
- Cell Counting
- Cell Viability
- Cell Identification
- Target Identification
- PCR/qPCR
- Cell Sorting
- Single-Cell Analysis
- Other Applications
By End User
- Academic & Research Institutes
- Pharmaceutical & Biotechnology Companies
- Contract Research Organizations (CROs) & CDMOs
- Hospitals & Diagnostic Laboratories
- Other End Users
By Region
- North America
- U.S.
- Canada
- Mexico
- Europe
- Germany
- France
- U.K.
- Italy
- Spain
- Rest of Europe
- Asia Pacific
- China
- Japan
- India
- South Korea
- South-east Asia
- Rest of Asia Pacific
- Latin America
- Brazil
- Argentina
- Rest of Latin America
- Middle East & Africa
- GCC Countries
- South Africa
- Rest of the Middle East and Africa
Request a Free Sample
Fill in your details and we'll send you a free sample report.
- Sample data tables & charts
- Research methodology
Need a Custom Version of This Report?
Tailor the scope, geography, or segments to your exact requirements.
- Custom geography or segment scope
- Direct access to our analyst team
Frequently Asked Questions
What is the current and forecast size of the Cell analysis instruments market?
What is the CAGR for the Cell analysis instruments market during the forecast period?
Which segment is the largest in the Cell analysis instruments market?
What factors are driving growth in the Cell analysis instruments market?
Who are the leading companies in the Cell analysis instruments market?
Which region leads the Cell analysis instruments market?
Table of Content
Chapter 1. Report Introduction
- 1.1 Report Description & Purpose
- 1.1.1 Report Title & Market Definition
- 1.1.2 Unique Selling Propositions (USP) & Key Differentiators
- 1.1.3 Value Proposition for Stakeholders
- 1.2 Research Objectives
- 1.2.1 Market Sizing Objectives (Volume & Revenue)
- 1.2.2 Segmentation Objectives
- 1.2.3 Competitive Intelligence Objectives
- 1.2.4 Forecast & Scenario Objectives
- 1.3 Report Scope
- 1.3.1 Cell Analysis Instruments Scope – Types & Subtypes Covered
- 1.3.2 Geographic Scope – Regions & Countries Covered
- 1.3.3 Historical Period, Base Year & Forecast Period (2025; forecast to 2032)
- 1.3.4 Inclusions & Exclusions
- 1.4 HS Code & Classification Framework
- 1.5 Currency, Units & Pricing Basis
- 1.6 Target Stakeholders
- 1.7 Limitations & Assumptions
Chapter 2. Executive Summary
- 2.1 Global Cell Analysis Instruments Market Snapshot
- 2.1.1 Market Size – Historical (2025) & Forecast (2025-2032) (2025: USD 22971 million → 2032: USD 36454.79 million)
- 2.1.2 Volume & Revenue – Global Totals
- 2.1.3 Key Market Highlights – Top Five Facts
- 2.2 Cell Analysis Instruments Market Segmentation Snapshot
- 2.2.1 Market Split by Region – 2025 vs. 2032
- 2.3 Competitive Snapshot
- 2.3.1 Top 10 Players by Revenue Share – 2025
- 2.3.2 Top 10 Players by Volume Share – 2025
- 2.3.3 Recent Strategic Developments (18-Month Summary)
- 2.4 Key Investment Highlights & Strategic Conclusions
Chapter 3. Cell Analysis Instruments Market Dynamics & Industry Analysis
- 3.1 Market Overview & Context
- 3.1.1 Cell Analysis Instruments Market Position in the Broader Automotive Value Chain
- 3.1.2 OEM vs. Replacement Market Dynamics
- 3.1.3 Market Maturity & Development Stage by Region
- 3.2 Cell Analysis Instruments Market Drivers
- 3.3 Cell Analysis Instruments Market Restraints & Challenges
- 3.4 Cell Analysis Instruments Market Opportunities
- 3.5 Porter's Five Forces Analysis
- 3.5.1 Threat of New Entrants
- 3.5.2 Bargaining Power of Suppliers
- 3.5.3 Bargaining Power of Buyers
- 3.5.4 Threat of Substitutes
- 3.5.5 Competitive Rivalry – Intensity Assessment
- 3.6 Cell Analysis Instruments Value Chain Analysis
- 3.6.1 Upstream – Raw Material/Input Suppliers
- 3.6.1.1 Raw Material/Input 1
- 3.6.1.2 Raw Material/Input 2
- 3.6.1.3 Raw Material/Input 3
- 3.6.2 Midstream – Production/Manufacturing/Service Delivery
- 3.6.2.1 Production/Process Overview
- 3.6.2.2 Key Facility Locations & Capacity by Manufacturer
- 3.6.3 Downstream – Distribution & End Consumer
- 3.6.3.1 Primary Channel – B2B/OEM
- 3.6.3.2 Secondary Channels – Dealer, Retail, Online, Direct
- 3.6.4 Value Chain Profitability Analysis
- 3.6.1 Upstream – Raw Material/Input Suppliers
- 3.7 PESTEL Analysis
- 3.7.1 Political Factors
- 3.7.2 Economic Factors
- 3.7.3 Social Factors
- 3.7.4 Technological Factors
- 3.7.5 Environmental Factors
- 3.7.6 Legal Factors
- 3.8 Cell Analysis Instruments Supply Chain Analysis
- 3.8.1 Raw Material/Input Supply Risk Assessment
- 3.8.2 Manufacturing Concentration Risk (Geographic Exposure)
- 3.8.3 Trade Disruption Impact Analysis
- 3.9 Regulatory & Policy Landscape
Note: The regulatory and policy landscape section covers regulations based on their applicability to the market, Cell Analysis Instruments category, geography, and scope of the study. Only regulatory frameworks with a material impact on operations, compliance, trade, sustainability, or market access are analyzed in detail.
Chapter 4. Key Investment Pockets & Opportunity Analysis
- 4.1 Cell Analysis Instruments Market Attractiveness Analysis
- 4.1.1 By Region – Investment Attractiveness Matrix (Volume × CAGR)
- 4.2 Absolute Revenue Growth Opportunity
- 4.2.1 By Region – Absolute USD Growth Through 2032
- 4.3 Incremental Volume Opportunity
- 4.3.1 By Region – Incremental Volume Through 2032
- 4.3.2 Segment – Incremental Volume
- 4.4 Emerging Submarket Opportunity Deep Dive (Subject to Applicability)
- 4.5 Emerging Market Opportunity Scorecards
- 4.5.1 United States
- 4.5.2 Europe
- 4.5.3 Asia
- 4.5.4 Middle East & Africa
Note: Emerging Market Opportunity Scorecards will be included based on relevance and strategic importance. Regions listed are indicative and may vary depending on data availability and market dynamics.
Chapter 5. Cell Analysis Instruments Import-Export Analysis & Trade Flows
- 5.1 Global Trade Overview
- 5.1.1 Global Export Value by Country (2025)
- 5.1.2 Global Export Volume by Country (2025)
- 5.1.3 Global Import Value by Country (2025)
- 5.1.4 Global Import Volume by Country (2025)
- 5.1.5 Net Trade Balance by Country (2025)
- 5.2 Export Analysis – Segment
- 5.2.1 Type 1 (HS Code)
- 5.2.2 Type 2 (HS Code)
- 5.2.3 Type 3 (HS Code)
- 5.2.4 Type 4 (HS Code)
- 5.2.5 Type 5 (HS Code)
- 5.3 Import Analysis – Segment
- 5.3.1 Type 1 (HS Code)
- 5.3.2 Type 2 (HS Code)
- 5.3.3 Type 3 (HS Code)
- 5.3.4 Type 4 (HS Code)
- 5.3.5 Type 5 (HS Code)
- 5.4 Average Unit Trade Prices
- 5.4.1 Average Export Price – Segment & Country
- 5.4.2 Average Import Price – Segment & Source Country
- 5.4.3 Price Trends (2025)
- 5.5 Key Trade Route Analysis
- 5.5.1 Trade Route 1
- 5.5.2 Trade Route 2
- 5.5.3 Trade Route 3
- 5.5.4 Trade Route 4
- 5.5.5 Trade Route 5
- 5.6 Trade Policy Impact Assessment
- 5.6.1 US Anti-Dumping & Section 301 Tariffs
- 5.6.2 EU Customs Union Impact
- 5.6.3 Major Free Trade Agreements
- 5.6.4 USMCA Rules of Origin
Note: Trade policy analysis will be included only where relevant to the Cell Analysis Instruments market.
Chapter 6. Competitive Landscape & Company Benchmarking
- 6.1 Cell Analysis Instruments Market Concentration & Structure
- 6.1.1 Herfindahl-Hirschman Index (HHI) – vs. 2025
- 6.1.2 Tier 1, Tier 2 & Tier 3 Market Structure
- 6.1.3 Global, Regional & Local Player Dynamics
- 6.2 Cell Analysis Instruments Market Share Analysis – 2025
- 6.2.1 Global Revenue Share by Company
- 6.2.2 Global Volume Share by Company
- 6.2.3 Regional Revenue Share
- 6.2.4 Market Share Evolution ( vs. 2025)
- 6.2.5 OEM Segment Share by Company
- 6.2.6 Replacement Segment Share by Company
- 6.3 Production/Delivery Capacity & Facility Analysis
- 6.3.1 Global Installed Capacity
- 6.3.2 Capacity Utilization Rates
- 6.3.3 Production/Output Volume
- 6.3.4 Facility Locations & Capacity Map
- 6.3.5 Planned Capacity Additions
- 6.4 Cell Analysis Instruments Competitive Benchmarking Matrix
- 6.4.1 Revenue, Volume, CAGR & Profitability Comparison
- 6.4.2 Channel Revenue Mix
- 6.4.3 Geographic Revenue Exposure
- 6.4.4 R&D Intensity
- 6.4.5 Sustainability Maturity
- 6.5 Strategic Developments in Cell Analysis Instruments (Last 24 Months)
- 6.5.1 Mergers, Acquisitions & Divestments
- 6.5.2 New Cell Analysis Instruments Launches
- 6.5.3 Facility Expansions
- 6.5.4 Strategic Alliances, Joint Ventures & Partnerships
- 6.5.5 Distribution Expansion & Market Entry
- 6.5.6 Sustainability & ESG Initiatives
- 6.6 Competitive Strategy Mapping
- 6.6.1 Leader, Challenger, Follower & Niche Classification
- 6.6.2 Pricing Strategy Comparison
- 6.6.3 Channel Strategy Matrix
Note: Strategic developments are included based on their materiality and the availability of reliable information.
Chapter 7. Global Cell Analysis Instruments Market – By Distribution Channel
- 7.1 Segment Overview
- 7.1.1 Volume & Revenue Split by Channel (2025 & 2032)
- 7.1.2 Channel Mix Evolution (2025-2032)
Chapter 8. Regional Market Analysis – Global Overview
- 8.1 Global Regional Overview
- 8.1.1 Regional Volume Share
- 8.1.2 Regional Revenue Share
- 8.1.3 Regional Volume by Region
- 8.1.4 Regional Revenue by Region
- 8.1.5 Regional Forecast Through 2032
- 8.2 Cross-Regional Segment Analysis
- 8.2.1 By Distribution Channel
- 8.2.2 By Brand/Price Tier
Chapter 9. North America Cell Analysis Instruments Market
- 9.1 United States
- 9.2 Canada
- 9.3 Mexico
Chapter 10. Europe Cell Analysis Instruments Market
- 10.1 Germany
- 10.2 France
- 10.3 Italy
- 10.4 United Kingdom
- 10.5 Spain
- 10.6 Poland
- 10.7 Russia
- 10.8 Netherlands
- 10.9 Belgium
- 10.10 Sweden
- 10.11 Denmark
- 10.12 Norway
- 10.13 Rest of Europe
Chapter 11. Asia Pacific Cell Analysis Instruments Market
- 11.1 China
- 11.2 India
- 11.3 Japan
- 11.4 South Korea
- 11.5 Thailand
- 11.6 Indonesia
- 11.7 Vietnam
- 11.8 Malaysia
- 11.9 Australia
- 11.10 Rest of Asia Pacific
Chapter 12. Latin America Cell Analysis Instruments Market
- 12.1 Brazil
- 12.2 Argentina
- 12.3 Colombia
- 12.4 Chile
- 12.5 Rest of Latin America
Chapter 13. Middle East Cell Analysis Instruments Market
- 13.1 Saudi Arabia
- 13.2 United Arab Emirates
- 13.3 Turkey
- 13.4 Israel
- 13.5 Iran
- 13.6 Rest of the Middle East
Chapter 14. Africa Cell Analysis Instruments Market
- 14.1 South Africa
- 14.2 Egypt
- 14.3 Nigeria
- 14.4 Morocco
- 14.5 Rest of Africa
Chapter 15. Cell Analysis Instruments Company Profiles
- 15.1 [Company 01]
- 15.1.1 Company Overview
- 15.1.2 Key Management Personnel
- 15.1.3 Products & Services Portfolio
- 15.1.4 Financial Performance
- 15.1.5 Key Market Focus & Geographic Presence
- 15.1.6 Recent Developments & Strategic Initiatives
Note: The company profile list is preliminary and may change based on research findings, market developments, data availability, and client requirements.
Chapter 16. Appendices
- Appendix A – List of Abbreviations & Acronyms
- Appendix B – Industry Classification Code Reference – Full Series
- Appendix C – Production & Capacity Data Tables
- Appendix D – End-Use & Demand Base Tables
- Appendix E – Consumption & Replacement Rate Assumptions
- Appendix F – ASP Reference Tables
- Appendix G – Manufacturing & Facility Database
- Appendix H – Import-Export Data Tables
- Appendix I – Regulatory Summary Tables
- Appendix J – Primary Research Participant List (Anonymized)
- Appendix K – Primary Research Questionnaire Framework
- Appendix L – Data Sources & Bibliography
- Appendix M – Market Size Divergence & Source Comparison
Chapter 17. Research Methodology
- 17.1 Research Framework & Philosophy
- 17.2 Secondary Research – Sources, Hierarchy & Data Extraction
- 17.3 Data Modeling – Bottom-Up & Top-Down Market Sizing
- 17.4 Primary Research – Stakeholder Framework, LOI & Sample Sizes
- 17.5 Forecast Methodology – Regression, Scenario & Sensitivity Analysis
- 17.6 Quality Control – Four-Layer Validation Framework
- 17.7 Limitations & Standard Assumptions
- 17.8 Disclaimer
