
Blood Gas & Electrolyte Analyzer Market
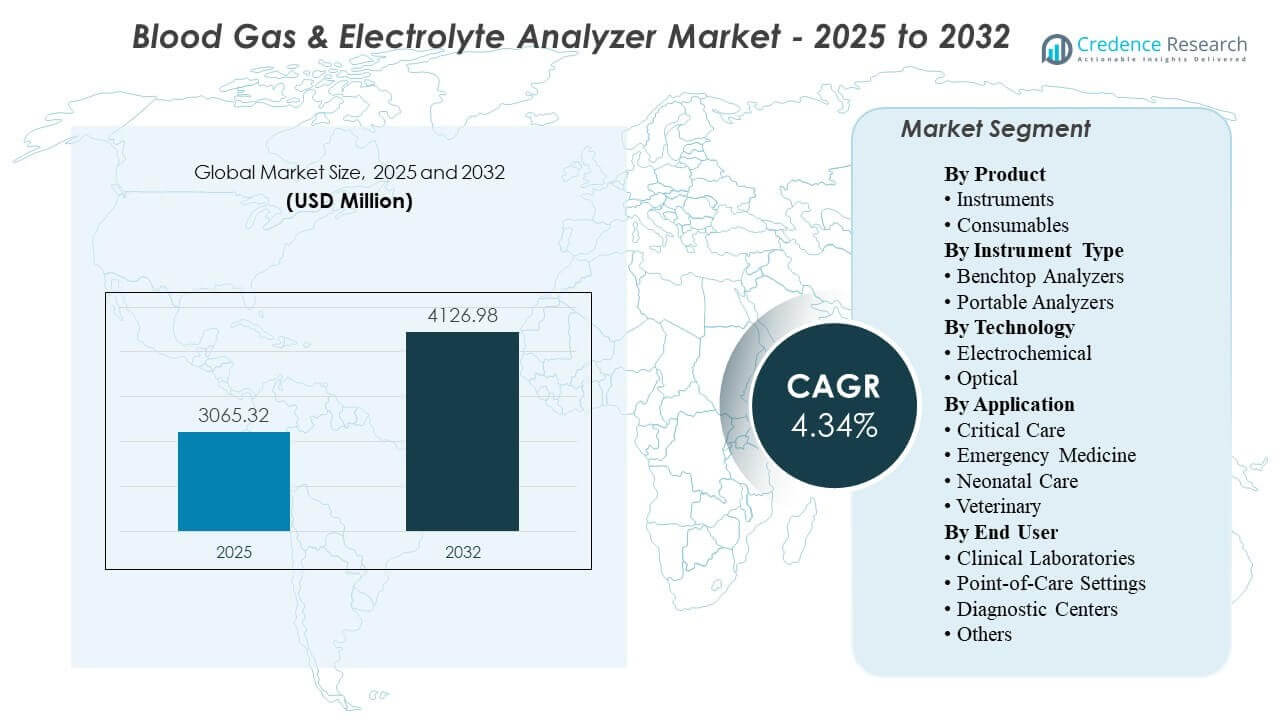
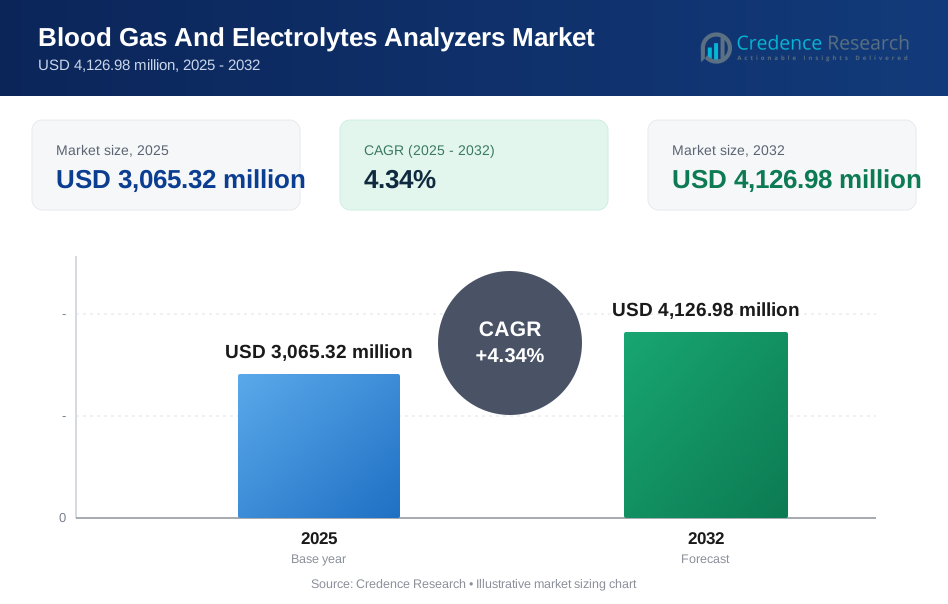
The global Blood Gas & Electrolyte Analyzer Market size was estimated at USD 3065.32 million in 2025 and is expected to reach USD 4126.98 million by 2032, growing at a CAGR of 4.34% from 2025 to 2032. Growth is primarily driven by sustained demand for rapid acid–base and electrolyte decision support in high-acuity pathways, where shorter time-to-result directly supports ventilation, resuscitation, and peri-operative management. Adoption is also supported by broader placement across critical care and emergency settings, alongside continued replacement cycles and workflow standardization across hospital and point-of-care environments.
| REPORT ATTRIBUTE | DETAILS |
|---|---|
| Historical Period | 2020-2025 |
| Base Year | 2025 |
| Forecast Period | 2026-2032 |
| Blood Gas and Electrolyte Analyzer Market Size 2025 | USD 3065.32 Million |
| Blood Gas and Electrolyte Analyzer Market, CAGR | 4.34% |
| Blood Gas and Electrolyte Analyzer Market Size 2032 | USD 4126.98Million |
Key Market Trends & Insights
- The market is projected to expand from USD 3065.32 million in 2025 to USD 4126.98 million by 2032 at a CAGR of 4.34% during 2025–2032.
- Consumables accounted for the largest share of 56.8% in 2025, supported by recurring per-test usage and cartridge-based operating models.
- Benchtop analyzers represented 49.1% of 2025 revenue, reflecting continued preference for centralized throughput and standardized QC control.
- Clinical laboratories led end-user demand with 43.7% share in 2025 due to governance-led testing workflows and integration with lab systems.
- North America held 37.40% of global revenue in 2025, reflecting mature acute-care diagnostics adoption and strong installed-base penetration.
Segment Analysis
Demand patterns in the Blood Gas & Electrolyte Analyzer Market are shaped by clinical urgency, workflow placement, and the balance between centralized throughput and near-patient testing. Health systems prioritize solutions that reduce turnaround time, standardize quality processes, and fit into LIS/EMR connectivity requirements across ICU and emergency workflows. Consumables remain central to purchasing economics because utilization scales with test frequency, and cartridge-based formats simplify routine handling. Instrument decisions typically reflect care-setting constraints, where centralized labs emphasize throughput and governance, and bedside settings emphasize speed and usability.
Adoption dynamics also reflect operational realities such as staffing constraints, inventory management, and compliance-driven quality oversight. Portable analyzers gain relevance in settings where transport, decentralized testing, and immediate decisions are frequent, including emergency medicine and neonatal care. Technology choice is influenced by stability, calibration practices, and reliability under varying environmental and operator conditions. End-user purchasing is increasingly influenced by service responsiveness and fleet-level oversight capabilities, especially in multi-site hospital networks.
By Product Insights
Consumables accounted for the largest share of 56.8% in 2025. Consumables lead because test volume is structurally tied to acute-care pathways, making recurring cartridges, reagents, and calibrants a predictable operating requirement. Single-use formats reduce operator steps and support consistent quality workflows, which is important in high-acuity environments with variable staffing. Procurement teams also value simplified inventory management and standardized replenishment cycles that align spending to utilization rather than capital refresh timing.
By Instrument Type Insights
Benchtop Analyzers accounted for the largest share of 49.1% in 2025. Benchtop systems lead where centralized laboratories require consistent throughput, multi-sample handling, and controlled quality management under lab governance. These platforms often integrate more seamlessly into laboratory information workflows and standardized QC routines, supporting repeatable results across high volumes. The installed base in hospitals also sustains replacement and upgrade demand, especially where lab centralization remains the dominant operating model.
By Technology Insights
Technology adoption is shaped by accuracy, stability, calibration requirements, and operational simplicity in real-world clinical workflows. Electrochemical approaches remain widely used due to established clinical familiarity and strong performance across key parameters, especially in hospital-driven utilization. Optical approaches gain traction where stability and reduced recalibration burden support consistent operations across decentralized sites. Technology selection is increasingly influenced by reliability under variable operating conditions, along with the ability to support standardized quality processes.
By Application Insights
Application demand is anchored in acute and time-sensitive care settings where rapid results influence immediate therapeutic decisions. Critical care drives routine utilization because ventilation and acid–base management require frequent monitoring across unstable patient cohorts. Emergency medicine sustains high testing intensity due to triage and resuscitation workflows that benefit from rapid electrolytes and blood gas visibility. Neonatal care supports dedicated demand where micro-sampling and tightly controlled decision thresholds encourage frequent monitoring, while veterinary use expands with broader access to compact analyzers in specialty clinics.
By End User Insights
Clinical Laboratories accounted for the largest share of 43.7% in 2025. Clinical laboratories lead because centralized testing governance and standardized quality oversight remain core requirements in many hospitals and integrated delivery networks. High sample throughput and system-wide comparability favor lab-led workflows, particularly where LIS integration and compliance-driven QC practices are prioritized. Even as point-of-care placement expands, laboratories continue to influence purchasing specifications, connectivity requirements, and quality protocols across distributed analyzer fleets.
Blood Gas And Electrolytes Analyzers Market Drivers
Expansion of high-acuity and time-sensitive care pathways
Critical care, emergency medicine, and peri-operative workflows rely on rapid blood gas and electrolyte insights to guide immediate treatment decisions. These settings create structurally high testing intensity because patient status can change quickly and requires repeated monitoring. Hospitals increasingly prioritize shorter time-to-result to support faster clinical decisions and reduce delays in initiating or adjusting therapy. The ongoing expansion of high-acuity capacity in many health systems sustains baseline demand for both instruments and consumables. Rising ICU bed availability and growing surgical volumes further increase routine testing frequency in high-dependency units.
- For instance, Radiometer states that its ABL90 FLEX PLUS can deliver 19 results in 35 seconds from just 65 μμL of whole blood, operates with uptime of more than 23.5 hours per day, and is ready for the next sample after 60 seconds, which makes it highly relevant for ICU, emergency department, and peri-operative workflows.
Growth of point-of-care testing placement and decentralized workflows
Care delivery models increasingly emphasize bedside and near-patient testing to reduce transport delays and improve decision speed. Portable analyzers support clinical teams in settings where mobility, speed, and simple operation are critical, including emergency bays, operating rooms, and transport workflows. Decentralized placement also supports continuity across multi-site hospital networks, where rapid testing enables more consistent pathway execution. As point-of-care placement expands, connectivity and fleet oversight become key purchase drivers. Hospitals also value standardized training and protocols that maintain result consistency across multiple decentralized testing locations.
Consumable-driven economics and recurring utilization intensity
Cartridges, reagents, and calibrants scale with test frequency, creating a recurring revenue model that supports vendor investment in installed-base expansion. Consumable formats often simplify handling steps and reduce the burden of preparing reagents or running complex maintenance routines. Health systems value predictable supply and standardized workflows that align consumable usage with clinical volume. This recurring utilization also supports long-term vendor relationships through service and supply agreements. Multi-year reagent contracts and bundled service models increasingly shape purchasing decisions by improving cost predictability.
Connectivity, workflow integration, and quality standardization
Hospitals increasingly require analyzers to integrate with laboratory and clinical information systems to reduce manual transcription and improve traceability. Standardized QC routines and system-wide oversight reduce variability across operators and locations, especially as devices spread beyond central labs. Connectivity supports compliance, audit readiness, and operational control across multi-device fleets. These factors raise the importance of software, middleware, and service capabilities alongside core analytical performance. Remote monitoring and centralized dashboards are gaining traction as hospitals seek tighter control of distributed device performance and downtime.
- For instance, Abbott states that the i-STAT Alinity onboard quality system automatically monitors nearly 150 sensor characteristics, while the platform supports both wireless and wired transmission of results to an EMR or data manager, strengthening traceability and quality control across distributed testing locations.
Blood Gas And Electrolytes Analyzers Market Challenges
Operational cost pressure remains a major constraint, particularly where hospitals seek to reduce per-test spending while maintaining high availability in critical pathways. Consumable costs can be scrutinized closely during procurement cycles, and shortages or supply variability can disrupt routine testing. The need to maintain quality assurance across decentralized devices also increases staffing and oversight burden when governance is not standardized. These factors can delay expansion decisions or shift purchasing toward platforms with stronger cost and supply predictability. Budget tightening also increases competitive pressure on vendors to justify premium pricing through measurable workflow and outcome benefits.
- For instance, Siemens Healthineers states that its epoc Blood Analysis System delivers lab-quality results in less than 1 minute, with sample analysis taking approximately 35 seconds on a single room-temperature test card, giving hospitals a concrete workflow benchmark when assessing whether faster turnaround can offset higher platform costs.
Quality management complexity can also slow adoption in settings with limited trained staff or inconsistent maintenance routines. Point-of-care expansion can introduce variability in sampling practices and device handling, which can affect consistency unless protocols are well controlled. Connectivity requirements add implementation complexity when IT environments are fragmented across sites. Vendors must address training, service responsiveness, and integration readiness to reduce operational friction for buyers. Frequent staff rotation in high-acuity wards can further amplify training needs and raise the risk of inconsistent device usage.
Blood Gas And Electrolytes Analyzers Market Trends and Opportunities
Health systems increasingly favor platforms that simplify workflow steps and reduce operator dependency in high-acuity settings. Integrated quality management, automated checks, and fleet-level oversight support more consistent operations across multi-site deployments. Demand also rises for solutions that improve traceability and reduce manual documentation through tighter LIS/EMR integration. These needs create opportunities for vendors that combine robust analytics with reliable connectivity and service models. Vendors that package analytics, QC automation, and connectivity as a unified solution can strengthen differentiation beyond core analyzer performance.
- For instance, Werfen’s GEM Premier 5000 combines iQM2, which runs a continuous cycle of 5 quality checks before, during, and after every sample and reduces error detection from hours to minutes, with GEMweb Plus 500, which provides a single unified database and customizable connectivity to EHR and ADT systems for full traceability.
Portable and near-patient testing adoption expands as care pathways push decision-making closer to the bedside. Workflow modernization supports broader placement beyond central labs, especially in emergency medicine and neonatal care where time-to-result carries high clinical value. Service models that reduce downtime and support predictable operating costs become increasingly important. Vendors that deliver strong uptime performance and supply reliability are well positioned as hospitals scale distributed analyzer fleets. Expansion into ambulatory, transport, and satellite care settings also creates incremental demand for compact analyzers with robust connectivity.
Regional Insights
North America
North America accounted for 37.40% of 2025 revenue, supported by mature acute-care diagnostics infrastructure and a large installed base across hospitals and high-acuity settings. Demand remains anchored in critical care and emergency workflows where rapid results support immediate clinical decision-making. Health system emphasis on standardized quality oversight and connectivity also drives purchasing toward platforms that integrate well into clinical and laboratory information environments. Replacement demand and installed-base upgrades support steady utilization across both central laboratory and point-of-care placements.
Europe
Europe represented 24.10% of 2025 revenue, shaped by heterogeneous country-level purchasing models and varying pace of point-of-care deployment. Hospital governance and protocol-driven quality processes influence adoption patterns, particularly in centralized laboratories and high-acuity wards. Demand is supported by stable acute-care capacity and continued need to optimize workflow efficiency under cost controls. Vendors that offer predictable operating costs, strong service coverage, and integration readiness tend to perform well across multi-country healthcare systems.
Asia Pacific
Asia Pacific held 26.60% of 2025 revenue, supported by expanding hospital capacity, modernization of acute diagnostics, and broader placement of near-patient testing in high-volume centers. Growth is driven by investments in critical care infrastructure and increasing emphasis on faster clinical decisions in emergency and peri-operative workflows. Large and diverse healthcare systems create demand for scalable solutions that can be deployed across multiple sites with consistent quality governance. Supply reliability and service capability remain important differentiators as hospitals expand installed bases.
Latin America
Latin America accounted for 7.50% of 2025 revenue, where adoption is influenced by procurement constraints, uneven access to high-acuity diagnostics, and variability in hospital modernization across countries. Demand concentrates in major urban hospitals and private networks that prioritize faster decision-making in critical pathways. Cost sensitivity places greater emphasis on total cost of ownership and consumable affordability. Vendors with strong distributor networks and stable after-sales support tend to gain traction in expanding deployments.
Middle East & Africa
Middle East & Africa represented 4.40% of 2025 revenue, reflecting a smaller installed base but ongoing expansion of acute-care capacity in select countries. Demand is driven by hospital buildouts, modernization programs, and efforts to strengthen emergency and critical care diagnostics. Adoption varies significantly by country based on budget availability, procurement cycles, and service coverage. Platforms with strong uptime performance and dependable consumable supply chains are prioritized where facilities aim to standardize high-acuity pathways.
Competitive Landscape
Competition in the Blood Gas & Electrolyte Analyzer Market centers on installed-base expansion, consumable pull-through, and workflow integration that supports consistent operations across critical settings. Vendors differentiate through analyzer reliability, cartridge economics, service responsiveness, and the ability to integrate results into hospital information workflows. Fleet oversight capabilities and quality standardization features are increasingly important as deployments spread beyond central laboratories into decentralized care areas. Strategic positioning often emphasizes total cost of ownership, uptime guarantees, and pathway-specific clinical value in ICU, ED, and peri-operative settings.
Abbott Laboratories / Abbott Point of Care Inc. competes by aligning analyzer placement with near-patient decision-making workflows and emphasizing operational simplicity for high-acuity settings. The company’s approach typically focuses on fast turnaround, standardized processes, and scalable deployments that can be managed across multiple care locations. Connectivity and workflow alignment are used to reduce manual steps and support traceability across distributed testing points. Service support and consumable availability remain central to sustaining installed-base utilization and long-term account retention.
The industry research and growth report includes detailed analyses of the competitive landscape of the market and information about key companies, including:
- Abbott Laboratories / Abbott Point of Care Inc.
- Siemens Healthineers / Siemens Healthcare GmbH
- F. Hoffmann-La Roche Ltd.
- Danaher Corporation (Radiometer Medical ApS)
- Medica Corporation
- Nova Biomedical Corporation
- Werfen / Instrumentation Laboratories
- OPTI Medical Systems, Inc.
- Sensa Core
- EDAN Instruments, Inc.
- Erba Mannheim
- Nihon Kohden Corporation
Qualitative and quantitative analysis of companies has been conducted to help clients understand the wider business environment as well as the strengths and weaknesses of key industry players. Data is qualitatively analyzed to categorize companies as pure play, category-focused, industry-focused, and diversified; it is quantitatively analyzed to categorize companies as dominant, leading, strong, tentative, and weak.
Recent Developments
- In May 2024, Radiometer announced a commercial partnership with Etiometry to improve clinical decision-making and workflows in hospital critical care settings. In this partnership, Etiometry’s clinical intelligence platform was integrated with Radiometer’s acute care diagnostic solutions so clinicians could view blood gas results, physiologic parameters, key clinical data, and AI-based patient risk analytics on a single screen.
- In May 2024, Nova Biomedical received U.S. FDA 510(k) clearance for a micro capillary sample mode on its Stat Profile Prime Plus Critical Care analyzer. The update allows the analyzer to run an 11-test panel from 90 microliters of capillary blood or a full 22-test profile from 135 microliters, strengthening its value in blood gas and electrolyte testing for critical care patients.
- In May 2024, F. Hoffmann-La Roche Ltd. and Hitachi High-Tech extended their diagnostics partnership for another 10 years to jointly develop and manufacture diagnostic solutions. Roche said this renewed partnership supported upcoming launches including the cobas c 703 and cobas ISE neo units, and Roche formally launched those two analytical units in CE-mark accepting countries on 24 June 2024.
Report Scope
| Report Attribute | Details |
| Market size value in 2025 | USD 3065.32 million |
| Revenue forecast in 2032 | USD 4126.98 million |
| Growth rate (CAGR) | 4.34% (2025–2032) |
| Base year | 2025 |
| Forecast period | 2026–2032 |
| Quantitative units | USD million |
| Segments covered | By Product Outlook: Instruments, Consumables; By Instrument Type Outlook: Benchtop Analyzers, Portable Analyzers; By Technology Outlook: Electrochemical, Optical; By Application Outlook: Critical Care, Emergency Medicine, Neonatal Care, Veterinary; By End User Outlook: Clinical Laboratories, Point-of-Care Settings, Diagnostic Centers, Others |
| Regional scope | North America, Europe, Asia Pacific, Latin America, Middle East & Africa |
| Key companies profiled | Abbott Laboratories / Abbott Point of Care Inc.; Siemens Healthineers / Siemens Healthcare GmbH; F. Hoffmann-La Roche Ltd.; Danaher Corporation (Radiometer Medical ApS); Medica Corporation; Nova Biomedical Corporation; Werfen / Instrumentation Laboratories; OPTI Medical Systems, Inc.; Sensa Core; EDAN Instruments, Inc.; Erba Mannheim; Nihon Kohden Corporation |
| No. of Pages | 338 |
Segmentation
By Product
- Instruments
- Consumables
By Instrument Type
- Benchtop Analyzers
- Portable Analyzers
By Technology
- Electrochemical
- Optical
By Application
- Critical Care
- Emergency Medicine
- Neonatal Care
- Veterinary
By End User
- Clinical Laboratories
- Point-of-Care Settings
- Diagnostic Centers
- Others
By Region
- North America
- U.S.
- Canada
- Mexico
- Europe
- Germany
- France
- U.K.
- Italy
- Spain
- Rest of Europe
- Asia Pacific
- China
- Japan
- India
- South Korea
- South-east Asia
- Rest of Asia Pacific
- Latin America
- Brazil
- Argentina
- Rest of Latin America
- Middle East & Africa
- GCC Countries
- South Africa
- Rest of the Middle East and Africa
Request a Free Sample
Fill in your details and we'll send you a free sample report.
- Sample data tables & charts
- Research methodology
Need a Custom Version of This Report?
Tailor the scope, geography, or segments to your exact requirements.
- Custom geography or segment scope
- Direct access to our analyst team
Frequently Asked Questions
What is the market size of the Blood Gas & Electrolyte Analyzer Market in 2025 and what is the forecast for 2032?
What is the CAGR for the Blood Gas & Electrolyte Analyzer Market during 2025–2032?
Which product segment leads the Blood Gas & Electrolyte Analyzer Market in 2025?
Which instrument type segment is largest in 2025?
Which end-user segment leads the market in 2025?
Which region leads the Blood Gas & Electrolyte Analyzer Market in 2025?
Table of Content
Chapter 1. Report Introduction
- 1.1 Report Description & Purpose
- 1.1.1 Report Title & Market Definition
- 1.1.2 Unique Selling Propositions (USP) & Key Differentiators
- 1.1.3 Value Proposition for Stakeholders
- 1.2 Research Objectives
- 1.2.1 Market Sizing Objectives (Volume & Revenue)
- 1.2.2 Segmentation Objectives
- 1.2.3 Competitive Intelligence Objectives
- 1.2.4 Forecast & Scenario Objectives
- 1.3 Report Scope
- 1.3.1 Blood Gas And Electrolytes Analyzers Scope – Types & Subtypes Covered
- 1.3.2 Geographic Scope – Regions & Countries Covered
- 1.3.3 Historical Period, Base Year & Forecast Period (2025; forecast to 2032)
- 1.3.4 Inclusions & Exclusions
- 1.4 HS Code & Classification Framework
- 1.5 Currency, Units & Pricing Basis
- 1.6 Target Stakeholders
- 1.7 Limitations & Assumptions
Chapter 2. Executive Summary
- 2.1 Global Blood Gas And Electrolytes Analyzers Market Snapshot
- 2.1.1 Market Size – Historical (2025) & Forecast (2025-2032) (2025: USD 3,065.32 million → 2032: USD 4,126.98 million)
- 2.1.2 Volume & Revenue – Global Totals
- 2.1.3 Key Market Highlights – Top Five Facts
- 2.2 Blood Gas And Electrolytes Analyzers Market Segmentation Snapshot
- 2.2.1 Market Split by Region – 2025 vs. 2032
- 2.3 Competitive Snapshot
- 2.3.1 Top 10 Players by Revenue Share – 2025
- 2.3.2 Top 10 Players by Volume Share – 2025
- 2.3.3 Recent Strategic Developments (18-Month Summary)
- 2.4 Key Investment Highlights & Strategic Conclusions
Chapter 3. Blood Gas And Electrolytes Analyzers Market Dynamics & Industry Analysis
- 3.1 Market Overview & Context
- 3.1.1 Blood Gas And Electrolytes Analyzers Market Position in the Broader Automotive Value Chain
- 3.1.2 OEM vs. Replacement Market Dynamics
- 3.1.3 Market Maturity & Development Stage by Region
- 3.2 Blood Gas And Electrolytes Analyzers Market Drivers
- 3.3 Blood Gas And Electrolytes Analyzers Market Restraints & Challenges
- 3.4 Blood Gas And Electrolytes Analyzers Market Opportunities
- 3.5 Porter's Five Forces Analysis
- 3.5.1 Threat of New Entrants
- 3.5.2 Bargaining Power of Suppliers
- 3.5.3 Bargaining Power of Buyers
- 3.5.4 Threat of Substitutes
- 3.5.5 Competitive Rivalry – Intensity Assessment
- 3.6 Blood Gas And Electrolytes Analyzers Value Chain Analysis
- 3.6.1 Upstream – Raw Material/Input Suppliers
- 3.6.1.1 Raw Material/Input 1
- 3.6.1.2 Raw Material/Input 2
- 3.6.1.3 Raw Material/Input 3
- 3.6.2 Midstream – Production/Manufacturing/Service Delivery
- 3.6.2.1 Production/Process Overview
- 3.6.2.2 Key Facility Locations & Capacity by Manufacturer
- 3.6.3 Downstream – Distribution & End Consumer
- 3.6.3.1 Primary Channel – B2B/OEM
- 3.6.3.2 Secondary Channels – Dealer, Retail, Online, Direct
- 3.6.4 Value Chain Profitability Analysis
- 3.6.1 Upstream – Raw Material/Input Suppliers
- 3.7 PESTEL Analysis
- 3.7.1 Political Factors
- 3.7.2 Economic Factors
- 3.7.3 Social Factors
- 3.7.4 Technological Factors
- 3.7.5 Environmental Factors
- 3.7.6 Legal Factors
- 3.8 Blood Gas And Electrolytes Analyzers Supply Chain Analysis
- 3.8.1 Raw Material/Input Supply Risk Assessment
- 3.8.2 Manufacturing Concentration Risk (Geographic Exposure)
- 3.8.3 Trade Disruption Impact Analysis
- 3.9 Regulatory & Policy Landscape
Note: The regulatory and policy landscape section covers regulations based on their applicability to the market, Blood Gas And Electrolytes Analyzers category, geography, and scope of the study. Only regulatory frameworks with a material impact on operations, compliance, trade, sustainability, or market access are analyzed in detail.
Chapter 4. Key Investment Pockets & Opportunity Analysis
- 4.1 Blood Gas And Electrolytes Analyzers Market Attractiveness Analysis
- 4.1.1 By Region – Investment Attractiveness Matrix (Volume × CAGR)
- 4.2 Absolute Revenue Growth Opportunity
- 4.2.1 By Region – Absolute USD Growth Through 2032
- 4.3 Incremental Volume Opportunity
- 4.3.1 By Region – Incremental Volume Through 2032
- 4.3.2 Segment – Incremental Volume
- 4.4 Emerging Submarket Opportunity Deep Dive (Subject to Applicability)
- 4.5 Emerging Market Opportunity Scorecards
- 4.5.1 United States
- 4.5.2 Europe
- 4.5.3 Asia
- 4.5.4 Middle East & Africa
Note: Emerging Market Opportunity Scorecards will be included based on relevance and strategic importance. Regions listed are indicative and may vary depending on data availability and market dynamics.
Chapter 5. Blood Gas And Electrolytes Analyzers Import-Export Analysis & Trade Flows
- 5.1 Global Trade Overview
- 5.1.1 Global Export Value by Country (2025)
- 5.1.2 Global Export Volume by Country (2025)
- 5.1.3 Global Import Value by Country (2025)
- 5.1.4 Global Import Volume by Country (2025)
- 5.1.5 Net Trade Balance by Country (2025)
- 5.2 Export Analysis – Segment
- 5.2.1 Type 1 (HS Code)
- 5.2.2 Type 2 (HS Code)
- 5.2.3 Type 3 (HS Code)
- 5.2.4 Type 4 (HS Code)
- 5.2.5 Type 5 (HS Code)
- 5.3 Import Analysis – Segment
- 5.3.1 Type 1 (HS Code)
- 5.3.2 Type 2 (HS Code)
- 5.3.3 Type 3 (HS Code)
- 5.3.4 Type 4 (HS Code)
- 5.3.5 Type 5 (HS Code)
- 5.4 Average Unit Trade Prices
- 5.4.1 Average Export Price – Segment & Country
- 5.4.2 Average Import Price – Segment & Source Country
- 5.4.3 Price Trends (2025)
- 5.5 Key Trade Route Analysis
- 5.5.1 Trade Route 1
- 5.5.2 Trade Route 2
- 5.5.3 Trade Route 3
- 5.5.4 Trade Route 4
- 5.5.5 Trade Route 5
- 5.6 Trade Policy Impact Assessment
- 5.6.1 US Anti-Dumping & Section 301 Tariffs
- 5.6.2 EU Customs Union Impact
- 5.6.3 Major Free Trade Agreements
- 5.6.4 USMCA Rules of Origin
Note: Trade policy analysis will be included only where relevant to the Blood Gas And Electrolytes Analyzers market.
Chapter 6. Competitive Landscape & Company Benchmarking
- 6.1 Blood Gas And Electrolytes Analyzers Market Concentration & Structure
- 6.1.1 Herfindahl-Hirschman Index (HHI) – vs. 2025
- 6.1.2 Tier 1, Tier 2 & Tier 3 Market Structure
- 6.1.3 Global, Regional & Local Player Dynamics
- 6.2 Blood Gas And Electrolytes Analyzers Market Share Analysis – 2025
- 6.2.1 Global Revenue Share by Company
- 6.2.2 Global Volume Share by Company
- 6.2.3 Regional Revenue Share
- 6.2.4 Market Share Evolution ( vs. 2025)
- 6.2.5 OEM Segment Share by Company
- 6.2.6 Replacement Segment Share by Company
- 6.3 Production/Delivery Capacity & Facility Analysis
- 6.3.1 Global Installed Capacity
- 6.3.2 Capacity Utilization Rates
- 6.3.3 Production/Output Volume
- 6.3.4 Facility Locations & Capacity Map
- 6.3.5 Planned Capacity Additions
- 6.4 Blood Gas And Electrolytes Analyzers Competitive Benchmarking Matrix
- 6.4.1 Revenue, Volume, CAGR & Profitability Comparison
- 6.4.2 Channel Revenue Mix
- 6.4.3 Geographic Revenue Exposure
- 6.4.4 R&D Intensity
- 6.4.5 Sustainability Maturity
- 6.5 Strategic Developments in Blood Gas And Electrolytes Analyzers (Last 24 Months)
- 6.5.1 Mergers, Acquisitions & Divestments
- 6.5.2 New Blood Gas And Electrolytes Analyzers Launches
- 6.5.3 Facility Expansions
- 6.5.4 Strategic Alliances, Joint Ventures & Partnerships
- 6.5.5 Distribution Expansion & Market Entry
- 6.5.6 Sustainability & ESG Initiatives
- 6.6 Competitive Strategy Mapping
- 6.6.1 Leader, Challenger, Follower & Niche Classification
- 6.6.2 Pricing Strategy Comparison
- 6.6.3 Channel Strategy Matrix
Note: Strategic developments are included based on their materiality and the availability of reliable information.
Chapter 7. Global Blood Gas And Electrolytes Analyzers Market – By Distribution Channel
- 7.1 Segment Overview
- 7.1.1 Volume & Revenue Split by Channel (2025 & 2032)
- 7.1.2 Channel Mix Evolution (2025-2032)
Chapter 8. Regional Market Analysis – Global Overview
- 8.1 Global Regional Overview
- 8.1.1 Regional Volume Share
- 8.1.2 Regional Revenue Share
- 8.1.3 Regional Volume by Region
- 8.1.4 Regional Revenue by Region
- 8.1.5 Regional Forecast Through 2032
- 8.2 Cross-Regional Segment Analysis
- 8.2.1 By Distribution Channel
- 8.2.2 By Brand/Price Tier
Chapter 9. North America Blood Gas And Electrolytes Analyzers Market
- 9.1 United States
- 9.2 Canada
- 9.3 Mexico
Chapter 10. Europe Blood Gas And Electrolytes Analyzers Market
- 10.1 Germany
- 10.2 France
- 10.3 Italy
- 10.4 United Kingdom
- 10.5 Spain
- 10.6 Poland
- 10.7 Russia
- 10.8 Netherlands
- 10.9 Belgium
- 10.10 Sweden
- 10.11 Denmark
- 10.12 Norway
- 10.13 Rest of Europe
Chapter 11. Asia Pacific Blood Gas And Electrolytes Analyzers Market
- 11.1 China
- 11.2 India
- 11.3 Japan
- 11.4 South Korea
- 11.5 Thailand
- 11.6 Indonesia
- 11.7 Vietnam
- 11.8 Malaysia
- 11.9 Australia
- 11.10 Rest of Asia Pacific
Chapter 12. Latin America Blood Gas And Electrolytes Analyzers Market
- 12.1 Brazil
- 12.2 Argentina
- 12.3 Colombia
- 12.4 Chile
- 12.5 Rest of Latin America
Chapter 13. Middle East Blood Gas And Electrolytes Analyzers Market
- 13.1 Saudi Arabia
- 13.2 United Arab Emirates
- 13.3 Turkey
- 13.4 Israel
- 13.5 Iran
- 13.6 Rest of the Middle East
Chapter 14. Africa Blood Gas And Electrolytes Analyzers Market
- 14.1 South Africa
- 14.2 Egypt
- 14.3 Nigeria
- 14.4 Morocco
- 14.5 Rest of Africa
Chapter 15. Blood Gas And Electrolytes Analyzers Company Profiles
- 15.1 [Company 01]
- 15.1.1 Company Overview
- 15.1.2 Key Management Personnel
- 15.1.3 Products & Services Portfolio
- 15.1.4 Financial Performance
- 15.1.5 Key Market Focus & Geographic Presence
- 15.1.6 Recent Developments & Strategic Initiatives
Note: The company profile list is preliminary and may change based on research findings, market developments, data availability, and client requirements.
Chapter 16. Appendices
- Appendix A – List of Abbreviations & Acronyms
- Appendix B – Industry Classification Code Reference – Full Series
- Appendix C – Production & Capacity Data Tables
- Appendix D – End-Use & Demand Base Tables
- Appendix E – Consumption & Replacement Rate Assumptions
- Appendix F – ASP Reference Tables
- Appendix G – Manufacturing & Facility Database
- Appendix H – Import-Export Data Tables
- Appendix I – Regulatory Summary Tables
- Appendix J – Primary Research Participant List (Anonymized)
- Appendix K – Primary Research Questionnaire Framework
- Appendix L – Data Sources & Bibliography
- Appendix M – Market Size Divergence & Source Comparison
Chapter 17. Research Methodology
- 17.1 Research Framework & Philosophy
- 17.2 Secondary Research – Sources, Hierarchy & Data Extraction
- 17.3 Data Modeling – Bottom-Up & Top-Down Market Sizing
- 17.4 Primary Research – Stakeholder Framework, LOI & Sample Sizes
- 17.5 Forecast Methodology – Regression, Scenario & Sensitivity Analysis
- 17.6 Quality Control – Four-Layer Validation Framework
- 17.7 Limitations & Standard Assumptions
- 17.8 Disclaimer
