
Bromadiolone Market Overview:
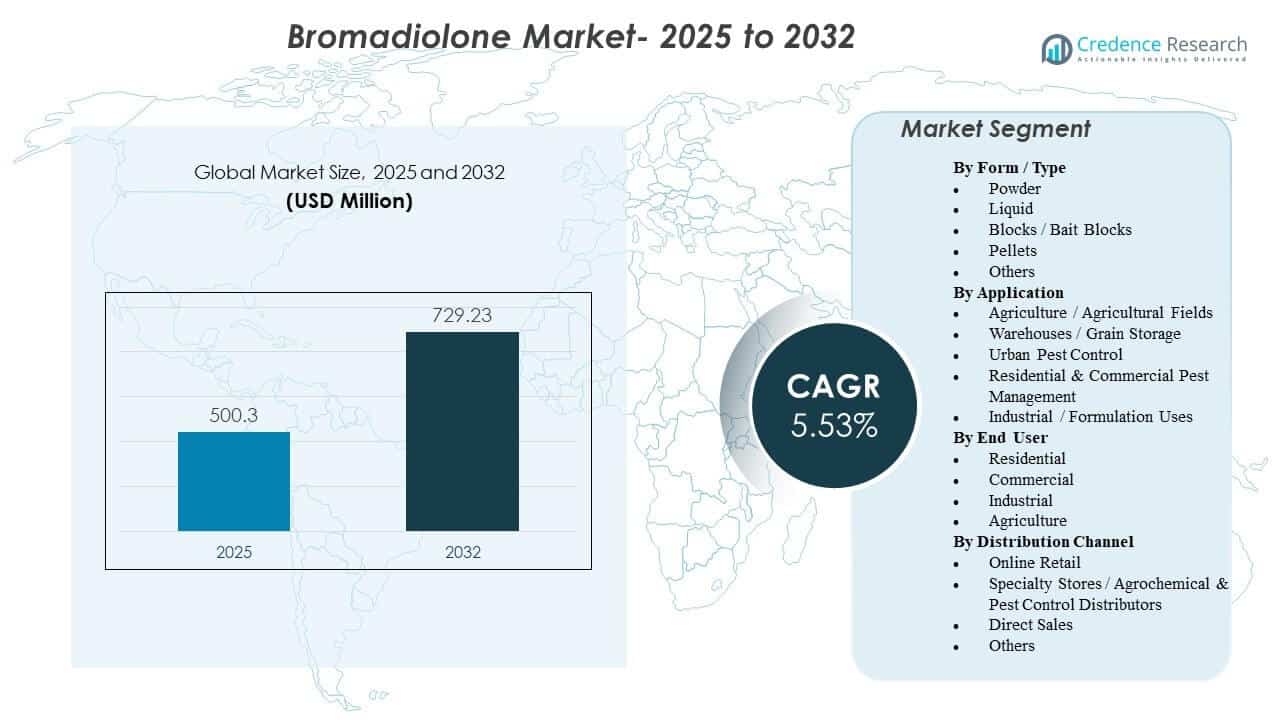
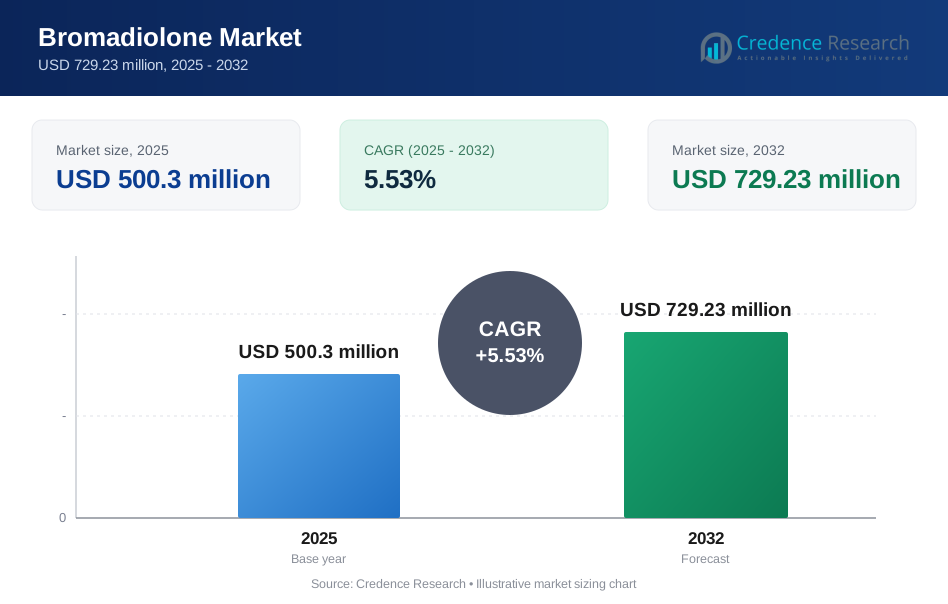
The global Bromadiolone Market size was estimated at USD 500.3 million in 2025 and is expected to reach USD 729.23 million by 2032, growing at a CAGR of 5.53% from 2025 to 2032. Demand is primarily supported by the continued need to protect agricultural output and stored commodities from rodent infestation, where bromadiolone remains widely used within integrated rodent management programs. Adoption is also reinforced by higher compliance expectations in commercial facilities that require auditable pest-control outcomes and consistent performance across varied site conditions.
| REPORT ATTRIBUTE | DETAILS |
|---|---|
| Historical Period | 2020-2024 |
| Base Year | 2025 |
| Forecast Period | 2026-2032 |
| Bromadiolone Market Size 2025 | USD 500.3 million |
| Bromadiolone Market, CAGR | 5.53% |
| Bromadiolone Market Size 2032 | USD 729.23 million |
Key Market Trends & Insights
- The global Bromadiolone Market is projected to expand from USD 500.3 million (2025) to USD 729.23 million (2032), reflecting a 5.53% CAGR (2025–2032).
- Powder accounted for the largest share of 55.4% in 2025, supported by broad applicability across agricultural and storage use-cases.
- Asia Pacific represented 44.6% of market revenue in 2025, driven by higher exposure to crop protection and grain storage needs across large supply chains.
- North America held 21.8% share in 2025, reflecting a larger proportion of service-led pest control programs in regulated commercial environments.
- Blocks / Bait Blocks captured 18.2% in 2025, highlighting sustained preference for ready-to-use formats in controlled-placement applications.
Segment Analysis
Bromadiolone demand is shaped by a mix of large-scale commodity protection and service-led urban pest control requirements. Buyers typically prioritize efficacy, predictable control outcomes, and ease of deployment across different site conditions, especially in storage facilities and commercial premises where infestation risks can create operational disruption. Product selection often reflects stewardship expectations, where placement control, monitoring discipline, and documentation practices influence what formats are preferred by professional operators.
Formulation choice also depends on the balance between application convenience and site sensitivity. Ready-to-use baits are commonly selected for structured placement in commercial and urban settings, whereas dry formats are frequently associated with broader operational flexibility across agricultural and storage contexts. Procurement behavior is further influenced by regulatory restrictions, professional-use norms, and distributor availability, which together shape the mix across powder, liquids, blocks, pellets, and niche formats.
By Form / Type Insights
Powder accounted for the largest share of 55.4% in 2025. Powder formats remain widely preferred where operators need broad deployment flexibility and consistent handling across multiple site types, including field-adjacent facilities and storage areas. Powder also supports high-volume procurement patterns where cost-per-treatment and logistics efficiency are important. The segment continues to benefit from established usage familiarity among professional and institutional buyers.
By Application Insights
Bromadiolone demand remains strongest where rodent pressure is persistent and the economic cost of infestation is high, particularly across agriculture-linked environments and storage ecosystems. Warehouses and grain storage sites typically require continuous control programs to protect inventory integrity and reduce contamination risk. Urban pest control and commercial premises also contribute to recurring demand as facilities prioritize compliance, hygiene standards, and operational continuity. Industrial/formulation uses remain tied to manufacturing and supply-side requirements that support downstream product availability.
By End User Insights
Commercial and industrial customers often drive structured procurement because these environments require audit-ready pest control practices, reliable outcomes, and minimized disruption. Agriculture-linked users support meaningful consumption where crop loss prevention and commodity protection are central priorities. Residential demand varies more by availability, permitted use patterns, and service penetration, but remains relevant where pest management services bundle product usage. End-user selection is shaped by site sensitivity, placement control expectations, and the need for repeatable monitoring.
By Distribution Channel Insights
Specialty distribution and direct sales remain important pathways because professional pest control programs often require compliant supply, technical guidance, and reliable replenishment. Online retail expands reach where regulations allow broader access, but product selection and pack formats may differ from professional channels. Channel choice is commonly influenced by stewardship requirements, labeling controls, and the need for documentation in commercial settings. “Others” typically includes local dealers, tenders, and institutional procurement routes that vary by region.
Bromadiolone Market Drivers
Rising focus on crop and stored commodity protection
Rodent infestation remains a persistent risk across farms, grain storage sites, and food supply chains, driving consistent demand for rodent control solutions. Bromadiolone continues to be used within routine prevention programs that prioritize protecting yield and inventory value. Storage environments, in particular, require continuous control because infestations can lead to contamination, losses, and downstream compliance issues. This supports steady replenishment demand and recurring purchasing across agricultural and logistics ecosystems.
- For instance, Liphatech states in its product guide that bromadiolone, which it identifies as a company invention, is formulated and effective at 50 ppm, with an LD50 of 7.1 g for an adult rat and 0.4 g for an adult mouse, underscoring why low-dose anticoagulant formulations remain relevant in stored commodity protection programs.
Expansion of warehousing and cold-chain logistics
Growth in warehousing capacity and food logistics networks increases the number of controlled environments that require structured rodent management. Storage facilities typically implement regular monitoring, bait placement, and documentation practices to meet hygiene expectations. Bromadiolone demand benefits from these recurring service cycles, especially in sites handling grain, packaged foods, and raw materials. As facility footprints expand, pest-control programs scale accordingly, supporting stable consumption.
- For instance, Ecolab reported that at a 4 million square foot distribution facility, its Intelligent Rodent Monitoring System delivered 3X more pest findings, a 67% increase in resolved structural and sanitation findings, and an 80% decrease in pest activity, showing how large warehouse sites increasingly rely on data-led rodent control systems.
Compliance pressure in commercial premises
Commercial facilities such as food processing, hospitality, and retail chains increasingly operate under hygiene and audit requirements that elevate pest-control discipline. These customers value predictable outcomes and repeatable processes, which supports continued product usage within managed programs. Pest management is often treated as a risk-control requirement rather than a discretionary expense. This reinforces procurement continuity even when broader operating budgets tighten.
Growth of professional pest control services
Professional pest control operators drive product consumption through standardized service contracts, route density expansion, and scheduled treatment cycles. Service-led models increase repeat purchasing because product usage is embedded into routine site maintenance and monitoring. Operators also influence format selection based on site constraints, placement control needs, and customer expectations. This professionalization trend supports steady demand across commercial, industrial, and residential service markets.
Bromadiolone Market Challenges
Regulatory scrutiny around anticoagulant rodenticides continues to influence product availability, labeling, and permitted end-use settings across multiple geographies. Compliance requirements can raise operating complexity for manufacturers, distributors, and service providers, particularly where stewardship and reporting expectations are tightening. Buyers may face restrictions in sensitive environments, requiring more controlled deployment practices. These factors can slow adoption in some channels and shift demand toward formats aligned with stricter placement controls.
- For instance, in December 2025, Australia's APVMA certified that all second-generation anticoagulant rodenticides (SGARs) should be declared Restricted Chemical Products, limiting their purchase and use exclusively to licensed and authorized users a decision that followed a targeted six-week consultation with product holders and state and territory authorities across the country.
Non-target exposure concerns and the need to demonstrate responsible use create additional constraints for market participants. Professional operators may need stronger monitoring discipline and documentation to satisfy customer and regulatory expectations. In price-sensitive markets, compliance-driven requirements can increase total program cost and reduce the use of certain formats. Competitive pressure also intensifies as buyers compare efficacy, service support, and cost-per-treatment across available alternatives.
Bromadiolone Market Trends and Opportunities
Product and service models are trending toward more structured, audit-ready rodent control programs that emphasize placement control, monitoring consistency, and documentation quality. This supports opportunities for suppliers that align formulations and packaging with professional workflows and sensitive-site requirements. The market also benefits from growing adoption of integrated pest management practices where rodenticides are used as part of broader control strategies. Suppliers that provide guidance on responsible use can strengthen buyer trust and retention.
Distribution strategies are increasingly focused on professional channels, including specialty distributors and direct sales that can support compliance needs and technical guidance. As warehousing and food logistics footprints expand, operators seek scalable solutions that can be deployed across multi-site networks. This creates opportunities for portfolio breadth across multiple formats to match different site conditions. Regional growth also creates openings for localized partnerships that improve availability and service coverage.
- For instance, Rentokil Initial's PestConnect platform reached 500,000 connected devices installed across customer premises as of February 2025, reflecting 36% growth in devices installed during 2024 alone and generating 1.7 million data messages per day with connected accounts now representing approximately 25% of Rentokil's total commercial pest portfolio demonstrating how IoT-integrated monitoring solutions are being scaled systematically through professional service networks.
Regional Insights
North America
North America accounted for 21.8% of revenue in 2025, supported by service-led pest management programs and higher compliance expectations in commercial environments. Food processing, retail chains, and warehousing facilities typically require structured control programs with reliable outcomes. Procurement often favors consistent supply, documentation support, and site-appropriate formats. Demand is reinforced by recurring service contracts and established professional operator networks.
Europe
Europe held 19.1% share in 2025, reflecting structured hygiene standards and strong implementation of preventive pest management practices across many commercial sites. Facilities frequently emphasize standardized operating procedures and audit readiness, which supports repeat product usage under managed programs. Market dynamics are influenced by regulatory posture and stewardship expectations that shape product mix and deployment practices. Vendors that align offerings with compliance requirements tend to sustain stronger adoption.
Asia Pacific
Asia Pacific led with 44.6% share in 2025, supported by large agricultural ecosystems, expanding grain storage infrastructure, and high urban density across multiple countries. Commodity protection needs and large-scale logistics networks increase the volume of sites requiring ongoing rodent control. Adoption also benefits from the scaling of organized pest control services in major urban centers. The regional mix remains broad, spanning agriculture-linked demand as well as commercial premises.
Latin America
Latin America represented 8.3% of revenue in 2025, supported by agriculture-driven needs and storage protection requirements in key commodity corridors. Pest control programs often vary by market maturity and enforcement intensity, leading to uneven adoption across countries. Demand is sustained where warehousing and food supply chains require continuous control measures. Expansion of professional services can improve consistency of use and strengthen channel development over time.
Middle East & Africa
Middle East & Africa accounted for 6.2% share in 2025, reflecting demand tied to urban pest control, storage protection, and food logistics in major hubs. Market maturity varies widely, and procurement structures can differ across countries and customer groups. Commercial facilities with formal hygiene expectations support recurring demand in certain submarkets. Growth opportunities often depend on distributor capability, service penetration, and compliance alignment.
Competitive Landscape
Competition in the Bromadiolone Market is shaped by portfolio breadth, distribution strength, and the ability to support professional pest control workflows. Companies differentiate through formulation formats, packaging designed for controlled placement, and channel partnerships that improve availability in regulated environments. Professional operators and specialty distributors influence purchasing decisions by prioritizing reliable performance, consistent supply, and stewardship alignment. Strategic moves often include product refresh cycles, licensing arrangements, and service footprint expansion that drives downstream procurement.
BASF SE maintains a presence through professional pest control positioning that aligns products with commercial and sensitive-site requirements. BASF SE focuses on portfolio relevance across ready-to-use formats and operational usability for service operators, supporting consistent deployment across varied customer sites. BASF SE also benefits from brand-backed channel reach and the ability to support compliance-oriented workflows. This approach strengthens BASF SE participation where audit readiness and service reliability shape purchasing behavior.
The industry research and growth report includes detailed analyses of the competitive landscape of the market and information about key companies, including:
- BASF SE
- Syngenta Group
- Bayer AG
- Liphatech Inc.
- PelGar International Ltd
- Rentokil Initial plc
- Neogen Corporation
- Bell Laboratories, Inc.
- Anticimex
- JT Eaton & Co., Inc.
Qualitative and quantitative analysis of companies has been conducted to help clients understand the wider business environment as well as the strengths and weaknesses of key industry players. Data is qualitatively analyzed to categorize companies as pure play, category-focused, industry-focused, and diversified; it is quantitatively analyzed to categorize companies as dominant, leading, strong, tentative, and weak.
Recent Developments
- In January 2026, BASF SE announced that BASF Agricultural Solutions had reached an agreement to acquire AgBiTech, a biological insect control specialist, with the deal intended to strengthen BASF’s BioSolutions and integrated pest management portfolio.
- In May 2025, Syngenta Group entered a strategic licensing and supply agreement with Neogen under which Neogen received exclusive rights to market and sell Talon-G and Talon Weatherblok XT rodenticides in the United States and Canada.
- In July 2025, Bayer AG expanded its strategic partnership with M2i Group to distribute pheromone-based biological crop protection products globally, extending the collaboration beyond Europe and Africa into markets including Asia-Pacific, Latin America, and the United States.
Report Scope
| Report Attribute | Details |
| Market size value in 2025 | USD 500.3 million |
| Revenue forecast in 2032 | USD 729.23 million |
| Growth rate (CAGR) | 5.53% (2025–2032) |
| Base year | 2025 |
| Forecast period | 2026-2032 |
| Quantitative units | USD million |
| Segments covered | By Form / Type; By Application; By End User; By Distribution Channel |
| Regional scope | North America, Europe, Asia Pacific, Latin America, Middle East & Africa |
| Key companies profiled | BASF SE, Syngenta Group, Bayer AG, Liphatech Inc., PelGar International Ltd, Rentokil Initial plc, Neogen Corporation, Bell Laboratories, Inc., Anticimex, JT Eaton & Co., Inc. |
| No.of Pages | 333 |
Segmentation
By Form / Type
- Powder
- Liquid
- Blocks / Bait Blocks
- Pellets
- Others
By Application
- Agriculture / Agricultural Fields
- Warehouses / Grain Storage
- Urban Pest Control
- Residential & Commercial Pest Management
- Industrial / Formulation Uses
By End User
- Residential
- Commercial
- Industrial
- Agriculture
By Distribution Channel
- Online Retail
- Specialty Stores / Agrochemical & Pest Control Distributors
- Direct Sales
- Others
By Region
- North America
- U.S.
- Canada
- Mexico
- Europe
- Germany
- France
- U.K.
- Italy
- Spain
- Rest of Europe
- Asia Pacific
- China
- Japan
- India
- South Korea
- South-east Asia
- Rest of Asia Pacific
- Latin America
- Brazil
- Argentina
- Rest of Latin America
- Middle East & Africa
- GCC Countries
- South Africa
- Rest of the Middle East and Africa
Request a Free Sample
Fill in your details and we'll send you a free sample report.
- Sample data tables & charts
- Research methodology
Need a Custom Version of This Report?
Tailor the scope, geography, or segments to your exact requirements.
- Custom geography or segment scope
- Direct access to our analyst team
Frequently Asked Questions
What is the Bromadiolone Market size in 2025 and the forecast value by 2032?
What is the CAGR for the Bromadiolone Market during 2025–2032?
What is the largest segment by form/type in 2025?
What factors are driving growth in the Bromadiolone Market?
Who are the major companies operating in the Bromadiolone Market?
Which region leads the Bromadiolone Market in 2025?
Table of Content
Chapter 1. Report Introduction
- 1.1 Report Description & Purpose
- 1.1.1 Report Title & Market Definition
- 1.1.2 Unique Selling Propositions (USP) & Key Differentiators
- 1.1.3 Value Proposition for Stakeholders
- 1.2 Research Objectives
- 1.2.1 Market Sizing Objectives (Volume & Revenue)
- 1.2.2 Segmentation Objectives
- 1.2.3 Competitive Intelligence Objectives
- 1.2.4 Forecast & Scenario Objectives
- 1.3 Report Scope
- 1.3.1 Bromadiolone Scope – Types & Subtypes Covered
- 1.3.2 Geographic Scope – Regions & Countries Covered
- 1.3.3 Historical Period, Base Year & Forecast Period (2025; forecast to 2032)
- 1.3.4 Inclusions & Exclusions
- 1.4 HS Code & Classification Framework
- 1.5 Currency, Units & Pricing Basis
- 1.6 Target Stakeholders
- 1.7 Limitations & Assumptions
Chapter 2. Executive Summary
- 2.1 Global Bromadiolone Market Snapshot
- 2.1.1 Market Size – Historical (2025) & Forecast (2025-2032) (2025: USD 500.3 million → 2032: USD 729.23 million)
- 2.1.2 Volume & Revenue – Global Totals
- 2.1.3 Key Market Highlights – Top Five Facts
- 2.2 Bromadiolone Market Segmentation Snapshot
- 2.2.1 Market Split by Region – 2025 vs. 2032
- 2.3 Competitive Snapshot
- 2.3.1 Top 10 Players by Revenue Share – 2025
- 2.3.2 Top 10 Players by Volume Share – 2025
- 2.3.3 Recent Strategic Developments (18-Month Summary)
- 2.4 Key Investment Highlights & Strategic Conclusions
Chapter 3. Bromadiolone Market Dynamics & Industry Analysis
- 3.1 Market Overview & Context
- 3.1.1 Bromadiolone Market Position in the Broader Automotive Value Chain
- 3.1.2 OEM vs. Replacement Market Dynamics
- 3.1.3 Market Maturity & Development Stage by Region
- 3.2 Bromadiolone Market Drivers
- 3.3 Bromadiolone Market Restraints & Challenges
- 3.4 Bromadiolone Market Opportunities
- 3.5 Porter's Five Forces Analysis
- 3.5.1 Threat of New Entrants
- 3.5.2 Bargaining Power of Suppliers
- 3.5.3 Bargaining Power of Buyers
- 3.5.4 Threat of Substitutes
- 3.5.5 Competitive Rivalry – Intensity Assessment
- 3.6 Bromadiolone Value Chain Analysis
- 3.6.1 Upstream – Raw Material/Input Suppliers
- 3.6.1.1 Raw Material/Input 1
- 3.6.1.2 Raw Material/Input 2
- 3.6.1.3 Raw Material/Input 3
- 3.6.2 Midstream – Production/Manufacturing/Service Delivery
- 3.6.2.1 Production/Process Overview
- 3.6.2.2 Key Facility Locations & Capacity by Manufacturer
- 3.6.3 Downstream – Distribution & End Consumer
- 3.6.3.1 Primary Channel – B2B/OEM
- 3.6.3.2 Secondary Channels – Dealer, Retail, Online, Direct
- 3.6.4 Value Chain Profitability Analysis
- 3.6.1 Upstream – Raw Material/Input Suppliers
- 3.7 PESTEL Analysis
- 3.7.1 Political Factors
- 3.7.2 Economic Factors
- 3.7.3 Social Factors
- 3.7.4 Technological Factors
- 3.7.5 Environmental Factors
- 3.7.6 Legal Factors
- 3.8 Bromadiolone Supply Chain Analysis
- 3.8.1 Raw Material/Input Supply Risk Assessment
- 3.8.2 Manufacturing Concentration Risk (Geographic Exposure)
- 3.8.3 Trade Disruption Impact Analysis
- 3.9 Regulatory & Policy Landscape
Note: The regulatory and policy landscape section covers regulations based on their applicability to the market, Bromadiolone category, geography, and scope of the study. Only regulatory frameworks with a material impact on operations, compliance, trade, sustainability, or market access are analyzed in detail.
Chapter 4. Key Investment Pockets & Opportunity Analysis
- 4.1 Bromadiolone Market Attractiveness Analysis
- 4.1.1 By Region – Investment Attractiveness Matrix (Volume × CAGR)
- 4.2 Absolute Revenue Growth Opportunity
- 4.2.1 By Region – Absolute USD Growth Through 2032
- 4.3 Incremental Volume Opportunity
- 4.3.1 By Region – Incremental Volume Through 2032
- 4.3.2 Segment – Incremental Volume
- 4.4 Emerging Submarket Opportunity Deep Dive (Subject to Applicability)
- 4.5 Emerging Market Opportunity Scorecards
- 4.5.1 United States
- 4.5.2 Europe
- 4.5.3 Asia
- 4.5.4 Middle East & Africa
Note: Emerging Market Opportunity Scorecards will be included based on relevance and strategic importance. Regions listed are indicative and may vary depending on data availability and market dynamics.
Chapter 5. Bromadiolone Import-Export Analysis & Trade Flows
- 5.1 Global Trade Overview
- 5.1.1 Global Export Value by Country (2025)
- 5.1.2 Global Export Volume by Country (2025)
- 5.1.3 Global Import Value by Country (2025)
- 5.1.4 Global Import Volume by Country (2025)
- 5.1.5 Net Trade Balance by Country (2025)
- 5.2 Export Analysis – Segment
- 5.2.1 Type 1 (HS Code)
- 5.2.2 Type 2 (HS Code)
- 5.2.3 Type 3 (HS Code)
- 5.2.4 Type 4 (HS Code)
- 5.2.5 Type 5 (HS Code)
- 5.3 Import Analysis – Segment
- 5.3.1 Type 1 (HS Code)
- 5.3.2 Type 2 (HS Code)
- 5.3.3 Type 3 (HS Code)
- 5.3.4 Type 4 (HS Code)
- 5.3.5 Type 5 (HS Code)
- 5.4 Average Unit Trade Prices
- 5.4.1 Average Export Price – Segment & Country
- 5.4.2 Average Import Price – Segment & Source Country
- 5.4.3 Price Trends (2025)
- 5.5 Key Trade Route Analysis
- 5.5.1 Trade Route 1
- 5.5.2 Trade Route 2
- 5.5.3 Trade Route 3
- 5.5.4 Trade Route 4
- 5.5.5 Trade Route 5
- 5.6 Trade Policy Impact Assessment
- 5.6.1 US Anti-Dumping & Section 301 Tariffs
- 5.6.2 EU Customs Union Impact
- 5.6.3 Major Free Trade Agreements
- 5.6.4 USMCA Rules of Origin
Note: Trade policy analysis will be included only where relevant to the Bromadiolone market.
Chapter 6. Competitive Landscape & Company Benchmarking
- 6.1 Bromadiolone Market Concentration & Structure
- 6.1.1 Herfindahl-Hirschman Index (HHI) – vs. 2025
- 6.1.2 Tier 1, Tier 2 & Tier 3 Market Structure
- 6.1.3 Global, Regional & Local Player Dynamics
- 6.2 Bromadiolone Market Share Analysis – 2025
- 6.2.1 Global Revenue Share by Company
- 6.2.2 Global Volume Share by Company
- 6.2.3 Regional Revenue Share
- 6.2.4 Market Share Evolution ( vs. 2025)
- 6.2.5 OEM Segment Share by Company
- 6.2.6 Replacement Segment Share by Company
- 6.3 Production/Delivery Capacity & Facility Analysis
- 6.3.1 Global Installed Capacity
- 6.3.2 Capacity Utilization Rates
- 6.3.3 Production/Output Volume
- 6.3.4 Facility Locations & Capacity Map
- 6.3.5 Planned Capacity Additions
- 6.4 Bromadiolone Competitive Benchmarking Matrix
- 6.4.1 Revenue, Volume, CAGR & Profitability Comparison
- 6.4.2 Channel Revenue Mix
- 6.4.3 Geographic Revenue Exposure
- 6.4.4 R&D Intensity
- 6.4.5 Sustainability Maturity
- 6.5 Strategic Developments in Bromadiolone (Last 24 Months)
- 6.5.1 Mergers, Acquisitions & Divestments
- 6.5.2 New Bromadiolone Launches
- 6.5.3 Facility Expansions
- 6.5.4 Strategic Alliances, Joint Ventures & Partnerships
- 6.5.5 Distribution Expansion & Market Entry
- 6.5.6 Sustainability & ESG Initiatives
- 6.6 Competitive Strategy Mapping
- 6.6.1 Leader, Challenger, Follower & Niche Classification
- 6.6.2 Pricing Strategy Comparison
- 6.6.3 Channel Strategy Matrix
Note: Strategic developments are included based on their materiality and the availability of reliable information.
Chapter 7. Global Bromadiolone Market – By Distribution Channel
- 7.1 Segment Overview
- 7.1.1 Volume & Revenue Split by Channel (2025 & 2032)
- 7.1.2 Channel Mix Evolution (2025-2032)
Chapter 8. Regional Market Analysis – Global Overview
- 8.1 Global Regional Overview
- 8.1.1 Regional Volume Share
- 8.1.2 Regional Revenue Share
- 8.1.3 Regional Volume by Region
- 8.1.4 Regional Revenue by Region
- 8.1.5 Regional Forecast Through 2032
- 8.2 Cross-Regional Segment Analysis
- 8.2.1 By Distribution Channel
- 8.2.2 By Brand/Price Tier
Chapter 9. North America Bromadiolone Market
- 9.1 United States
- 9.2 Canada
- 9.3 Mexico
Chapter 10. Europe Bromadiolone Market
- 10.1 Germany
- 10.2 France
- 10.3 Italy
- 10.4 United Kingdom
- 10.5 Spain
- 10.6 Poland
- 10.7 Russia
- 10.8 Netherlands
- 10.9 Belgium
- 10.10 Sweden
- 10.11 Denmark
- 10.12 Norway
- 10.13 Rest of Europe
Chapter 11. Asia Pacific Bromadiolone Market
- 11.1 China
- 11.2 India
- 11.3 Japan
- 11.4 South Korea
- 11.5 Thailand
- 11.6 Indonesia
- 11.7 Vietnam
- 11.8 Malaysia
- 11.9 Australia
- 11.10 Rest of Asia Pacific
Chapter 12. Latin America Bromadiolone Market
- 12.1 Brazil
- 12.2 Argentina
- 12.3 Colombia
- 12.4 Chile
- 12.5 Rest of Latin America
Chapter 13. Middle East Bromadiolone Market
- 13.1 Saudi Arabia
- 13.2 United Arab Emirates
- 13.3 Turkey
- 13.4 Israel
- 13.5 Iran
- 13.6 Rest of the Middle East
Chapter 14. Africa Bromadiolone Market
- 14.1 South Africa
- 14.2 Egypt
- 14.3 Nigeria
- 14.4 Morocco
- 14.5 Rest of Africa
Chapter 15. Bromadiolone Company Profiles
- 15.1 [Company 01]
- 15.1.1 Company Overview
- 15.1.2 Key Management Personnel
- 15.1.3 Products & Services Portfolio
- 15.1.4 Financial Performance
- 15.1.5 Key Market Focus & Geographic Presence
- 15.1.6 Recent Developments & Strategic Initiatives
Note: The company profile list is preliminary and may change based on research findings, market developments, data availability, and client requirements.
Chapter 16. Appendices
- Appendix A – List of Abbreviations & Acronyms
- Appendix B – Industry Classification Code Reference – Full Series
- Appendix C – Production & Capacity Data Tables
- Appendix D – End-Use & Demand Base Tables
- Appendix E – Consumption & Replacement Rate Assumptions
- Appendix F – ASP Reference Tables
- Appendix G – Manufacturing & Facility Database
- Appendix H – Import-Export Data Tables
- Appendix I – Regulatory Summary Tables
- Appendix J – Primary Research Participant List (Anonymized)
- Appendix K – Primary Research Questionnaire Framework
- Appendix L – Data Sources & Bibliography
- Appendix M – Market Size Divergence & Source Comparison
Chapter 17. Research Methodology
- 17.1 Research Framework & Philosophy
- 17.2 Secondary Research – Sources, Hierarchy & Data Extraction
- 17.3 Data Modeling – Bottom-Up & Top-Down Market Sizing
- 17.4 Primary Research – Stakeholder Framework, LOI & Sample Sizes
- 17.5 Forecast Methodology – Regression, Scenario & Sensitivity Analysis
- 17.6 Quality Control – Four-Layer Validation Framework
- 17.7 Limitations & Standard Assumptions
- 17.8 Disclaimer
