Home » Semiconductor & Electronics » Burn-Off Oven Market

Burn-Off Oven Market By Type (Gas Fired Burn Off Oven, Electric Burn Off Oven); By Capacity (500 to 1000 Kg, 1000 to 2000 Kg, 2000 to 3000 Kg, Above 3000 Kg); By Application (Paint & Coating Stripping, Plastic Stripping, Auto-parts & Engine Rebuilding, Chemical Cleaning); By End-Use (Paint & Coating, Plastics, Fibers, Electric Motors, Oil and Gas) – Growth, Share, Opportunities & Competitive Analysis, 2024 – 2032

Price: $4699

Published: | Report ID: 110078 | Report Format : Excel, PDF
REPORT ATTRIBUTE DETAILS
Historical Period 2020-2023
Base Year 2024
Forecast Period 2025-2032
Burn-Off Oven Market Size 2024 USD 799.34 million
Burn-Off Oven Market, CAGR 4.93%
Burn-Off Oven Market Size 2032 USD 1,208.07 million

Market Overview

The Burn Off Oven market size was valued at USD 580.41 million in 2018, increased to USD 799.34 million in 2024, and is anticipated to reach USD 1,208.07 million by 2032, at a CAGR of 4.93% during the forecast period.

The Burn Off Oven market features several key players driving innovation and growth, including ACE Equipment, Steelman Industries Inc., Therma-Tron-X, Inc., Benko Products Inc., and Pollution Control Products Co. These companies offer advanced, energy-efficient systems tailored to diverse industrial applications such as automotive, aerospace, and metal recycling. Their strong presence and technological expertise enable them to meet rising demand for sustainable cleaning solutions. Asia Pacific leads the global market with a 44.13% share in 2024, fueled by rapid industrialization and expanding manufacturing sectors. North America follows with 27.97%, supported by high adoption in reconditioning and environmental compliance.

Burn Off Oven Market Size

Market Insights

  • The Burn Off Oven market was valued at USD 580.41 million in 2018, reached USD 799.34 million in 2024, and is projected to hit USD 1,208.07 million by 2032, growing at a CAGR of 4.93% during the forecast period.
  • Rising demand from industries like automotive, aerospace, and manufacturing is driving growth, as these ovens offer efficient, non-chemical cleaning for metal parts, reducing environmental impact and enhancing operational safety.
  • A key trend is the growing preference for electric burn off ovens in environmentally regulated markets, along with increased use in component refurbishment and remanufacturing sectors.
  • The market is competitive, with players like ACE Equipment, Therma-Tron-X, and Pollution Control Products Co. focusing on product customization, automation, and energy efficiency, though high initial costs and maintenance remain key restraints for smaller enterprises.
  • Regionally, Asia Pacific leads with 44.13% market share, followed by North America (27.97%) and Europe (18.38%), while gas-fired ovens dominate the oven type segment.

Design Element 2

Access crucial information at unmatched prices!

Request your sample report today & start making informed decisions powered by Credence Research!

Download Sample

CTA Design Element 3

Market Segmentation Analysis:

By Oven Type

The Gas Fired Burn Off Oven segment held the dominant market share in 2024, accounting for over 60% of the global revenue. Its strong position is driven by higher thermal efficiency, faster heat-up times, and lower operational costs in industrial applications. Gas-fired systems are widely preferred in heavy-duty operations requiring high-capacity heat cleaning, such as in foundries and automotive parts manufacturing. While Electric Burn Off Ovens are gaining traction due to cleaner operations and lower emissions, they remain limited to small-scale or environmentally regulated facilities, where gas availability or emissions restrictions are more critical.

  • For instance, Pollution Control Products Co. manufactures gas-fired ovens with operating temperatures up to 900°F (482°C) and burn cycle durations as short as 4 hours, with internal dimensions reaching 72″ x 72″ x 120″ for large components.

By Capacity

In terms of capacity, the 1000 to 2000 Kg segment emerged as the market leader, capturing the largest revenue share in 2024. This segment is favored for its balance between operational efficiency and versatility, making it suitable for mid-sized industrial operations across multiple sectors. Its growing adoption is supported by rising demand from automotive refurbishing and manufacturing facilities that require reliable and efficient batch processing capabilities. Although the 2000 to 3000 Kg segment is expanding, especially in large-scale processing units, the mid-range category remains dominant due to its adaptability and cost-effectiveness.

  • For instance, Davron Technologies Inc. designed a batch burn off oven model DTI-1224, with a load capacity of 1,500 kg, internal workspace of 1,830 mm x 1,830 mm x 2,440 mm, and maximum operating temperature of 704°C (1,300°F).

By Application

Among the application segments, Paint & Coating Stripping accounted for the highest market share in 2024, driven by growing regulatory pressure for environmentally safe coating removal methods and increasing maintenance of industrial equipment. Burn off ovens provide an efficient, chemical-free alternative for stripping paint from metal surfaces, reducing labor and waste. The demand is particularly strong in automotive and aerospace sectors. Plastic Stripping and Auto-parts & Engine Rebuilding segments are also expanding due to increased component recycling and reconditioning efforts. Chemical Cleaning remains niche, primarily used in facilities requiring precise thermal decontamination.

Market Overview

Industrial Growth and Demand for Efficient Cleaning Technologies

The rising demand for effective thermal cleaning solutions across industries is a significant driver of the burn off oven market. Sectors such as automotive, aerospace, and manufacturing increasingly adopt these ovens for stripping paint, plastic, and contaminants from metal components. Their ability to clean without using harsh chemicals makes them environmentally preferred and cost-efficient. This trend is fueled by expanding industrial production, maintenance, and reconditioning activities that require rapid turnaround and reliable performance.

  • For instance, Therma-Tron-X, Inc. developed an automated cleaning system for an aerospace client capable of processing 12 aircraft frame sections per cycle, each cycle lasting 3.5 hours, with thermal cleaning temperatures reaching 1,000°F (538°C).

Environmental Regulations Favoring Non-Chemical Alternatives

Stricter environmental and safety regulations worldwide are accelerating the adoption of burn off ovens as a cleaner alternative to chemical stripping methods. These ovens reduce hazardous waste and emissions while meeting regulatory compliance. Their ability to eliminate solvents and minimize manual labor aligns with sustainable practices and occupational safety standards. Industries are proactively shifting to thermal technologies to reduce environmental impact and improve worker safety, thereby driving market growth.

  • For instance, Benko Products Inc. offers their Sahara Series ovens equipped with afterburners that reduce VOC emissions to less than 10 ppm, in compliance with EPA 40 CFR Part 60 Subpart EEEE, with burn chambers operating at 1,000°F (538°C) and afterburner temperatures at 1,400°F (760°C).

Increasing Refurbishment and Recycling Practices

The growing focus on sustainability and cost reduction in industrial operations has increased the reuse and refurbishment of metal parts. Burn off ovens play a crucial role in cleaning used components for remanufacturing or recycling. This has created demand across automotive workshops, electric motor refurbishers, and machinery rebuilders. As manufacturers adopt circular economy models, the role of burn off ovens in restoring parts without mechanical damage becomes vital, fueling sustained market expansion.

Key Trends & Opportunities

Shift Toward Electrification in Industrial Equipment

Electric burn off ovens are gaining popularity due to their zero-emission operation, quieter function, and ease of integration in urban or enclosed industrial settings. As companies aim to decarbonize their production processes, electric models serve as a sustainable option over traditional gas-fired ovens. This shift opens up new opportunities in environmentally regulated regions, especially across Europe and parts of North America, where electricity is increasingly sourced from renewables.

  • For instance, ACE Equipment manufactures electric burn off ovens with models running at 480V, 3-phase, 60Hz, and maximum current draw of 130 amps, providing uniform heating up to 800°F (427°C) with ±10°F accuracy and programmable cycle times via Siemens PLC controls.

Expansion in Emerging Economies and Customization Demand

Emerging economies are witnessing rapid industrialization and infrastructure development, creating demand for maintenance tools like burn off ovens. Local manufacturers seek compact, customizable solutions tailored to regional requirements and operational scale. This creates opportunities for global players to expand their footprint through localized production, service networks, and product differentiation. Custom-built burn off ovens, optimized for energy efficiency and safety, are gaining traction across SMEs and large-scale industrial units alike.

  • For instance, Acmas Technocracy Pvt. Ltd. supplies customized burn off ovens with operating capacities ranging from 100 kg to 2,000 kg, inner chamber volumes up to 1,200 liters, and digital PID controllers with temperature accuracy of ±1°C, suitable for both batch and continuous operations.

Key Challenges

High Initial Investment and Maintenance Costs

Despite their long-term efficiency, burn off ovens require significant upfront capital for installation, ventilation systems, and safety compliance. Maintenance costs further add to the operational burden, especially for smaller manufacturers or service centers. These financial barriers can limit adoption in price-sensitive markets or among businesses with tight capital budgets, restraining market penetration despite growing awareness of their environmental and operational benefits.

Energy Consumption and Operating Efficiency Concerns

Burn off ovens, particularly gas-fired models, can be energy-intensive, raising concerns about operational efficiency and cost-effectiveness. In regions with high fuel or electricity costs, operating these ovens consistently can impact profit margins. There is also growing scrutiny of their carbon footprint in sustainability-driven industries, prompting the need for energy-efficient designs and heat recovery systems. Manufacturers must address this challenge to ensure broader acceptance across diverse end-users.

Safety and Emission Control Requirements

Operating burn off ovens involves handling high temperatures, fumes, and potential fire hazards, which necessitate stringent safety measures. Compliance with emission standards and workplace safety regulations can be complex and costly. Industries must invest in proper training, exhaust treatment systems, and monitoring devices to ensure safe operation. These requirements, while essential, can act as deterrents for small and medium-sized enterprises considering adoption, thereby impacting overall market growth.

Regional Analysis

North America

North America accounted for approximately 27.97% of the global Burn Off Oven market in 2024, with a market size rising from USD 164.97 million in 2018 to USD 223.58 million in 2024. The region is projected to reach USD 339.35 million by 2032, expanding at a CAGR of 5.0%. Growth is driven by strong industrial infrastructure, rising adoption of thermal cleaning technologies, and regulatory pressure to reduce chemical usage. The United States leads the market due to its extensive automotive remanufacturing and aerospace sectors. Demand is further supported by investments in sustainable and automated industrial cleaning processes.

Europe

Europe held a market share of 18.38% in the global Burn Off Oven market in 2024, with its value increasing from USD 114.54 million in 2018 to USD 149.57 million. It is projected to reach USD 206.72 million by 2032, growing at a CAGR of 3.8%. The market in Europe is driven by environmental regulations encouraging non-chemical cleaning solutions and the presence of several leading industrial equipment manufacturers. Countries like Germany, the UK, and Italy are key contributors due to their established automotive and manufacturing sectors. However, moderate growth reflects market saturation and economic slowdowns in some EU regions.

Asia Pacific

Asia Pacific dominated the global Burn Off Oven market in 2024 with a leading market share of 44.13%, increasing from USD 246.81 million in 2018 to USD 352.81 million. It is expected to reach USD 566.60 million by 2032, at a robust CAGR of 5.7%. This strong growth is fueled by rapid industrialization, expanding automotive and electronics sectors, and increased demand for cost-effective cleaning technologies in countries such as China, India, and South Korea. The region benefits from a large manufacturing base, rising infrastructure investments, and government support for environmentally sustainable industrial practices.

Latin America

Latin America represented a 4.75% share of the global Burn Off Oven market in 2024, with the market size growing from USD 27.93 million in 2018 to USD 38.00 million. It is expected to reach USD 50.95 million by 2032, expanding at a CAGR of 3.4%. Brazil and Mexico are the primary contributors, driven by the rising demand for refurbished auto parts and growing metal recycling activities. Although economic fluctuations and infrastructure limitations persist, the market continues to benefit from increased awareness of non-chemical cleaning alternatives and investments in light manufacturing and industrial maintenance.

Middle East

The Middle East accounted for 2.57% of the global Burn Off Oven market in 2024, with its size growing from USD 16.32 million in 2018 to USD 20.56 million. The market is forecast to reach USD 26.24 million by 2032, registering a CAGR of 2.7%. Growth remains modest due to relatively lower industrial diversity, yet sectors like oil & gas, construction, and infrastructure maintenance provide consistent demand. Countries such as Saudi Arabia and the UAE lead regional adoption due to ongoing efforts to modernize industrial processes and reduce environmental impact through sustainable maintenance technologies.

Africa

Africa held the smallest share in the Burn Off Oven market in 2024 at 1.85%, with the market growing from USD 9.83 million in 2018 to USD 14.84 million. It is projected to reach USD 18.22 million by 2032, reflecting a CAGR of 2.2%. While industrial growth across the continent remains gradual, localized demand is rising in sectors like mining, automotive servicing, and metal recycling. South Africa is a key market, supported by infrastructure development and regulatory shifts promoting cleaner maintenance technologies. However, limited access to capital and technical expertise continues to restrict widespread adoption across the region.

Burn Off Oven Market Segmentation

Market Segmentations:

By Oven Type

  • Gas Fired Burn Off Oven
  • Electric Burn Off Oven

By Capacity

  • 500 to 1000 Kg
  • 1000 to 2000 Kg
  • 2000 to 3000 Kg
  • 3000 Kg

By Application

  • Paint & Coating Stripping
  • Plastic Stripping
  • Auto-parts & Engine Rebuilding
  • Chemical Cleaning

By End-Use

  • Paint & Coating
  • Plastics
  • Fibers
  • Electric Motors
  • Oil and Gas

By Geography

  • North America
    • U.S.
    • Canada
    • Mexico
  • Europe
    • Germany
    • France
    • U.K.
    • Italy
    • Spain
    • Rest of Europe
  • Asia Pacific
    • China
    • Japan
    • India
    • South Korea
    • South-east Asia
    • Rest of Asia Pacific
  • Latin America
    • Brazil
    • Argentina
    • Rest of Latin America
  • Middle East & Africa
    • GCC Countries
    • South Africa
    • Rest of the Middle East and Africa

Competitive Landscape

The competitive landscape of the Burn Off Oven market is characterized by the presence of several established players focusing on innovation, customization, and geographic expansion. Companies such as ACE Equipment, Steelman Industries Inc., and Therma-Tron-X, Inc. hold strong market positions due to their extensive product portfolios and longstanding industry expertise. These firms invest in R&D to enhance oven efficiency, safety features, and environmental compliance. Mid-sized players like Benko Products Inc. and Davron Technologies Inc. emphasize tailored solutions and energy-efficient designs to meet specific industrial demands. Strategic partnerships, mergers, and acquisitions are common as companies seek to expand their regional footprints and strengthen distribution channels. Emerging firms in Asia and the Middle East are also entering the market with cost-competitive offerings, adding to the overall market dynamism. The focus across the board remains on sustainable operations, compliance with emission standards, and advanced automation to gain a competitive edge in a growing industrial cleaning sector.

Shape Your Report to Specific Countries or Regions & Enjoy 30% Off!

Key Player Analysis

  • ACE Equipment
  • Steelman Industries Inc.
  • Therma-Tron-X, Inc.
  • Benko Products Inc.
  • David Weisman, L.L.C.
  • Pollution Control Products Co.
  • Davron Technologies Inc.
  • ComEnCo Systems Inc.
  • Consolidated Engineering Company
  • Acmas Technocracy Private Limited
  • Akalbatu
  • The Wesman Engineering Company Private Limited

Recent Developments

  • In March 2025, Therma-Tron-X, Inc. (TTX) is nearing completion of an 88,200-square-foot expansion to its manufacturing facility. This expansion will increase storage capacity and free up space for manufacturing, supporting further innovation and production of their oven systems.
  • In March 2024, ACE introduced advanced Radiant Tube (RT) Heat Cleaning Ovens that prioritize energy efficiency. These ovens are designed for effective heat cleaning while minimizing energy use, emphasizing sustainability and reduced operational costs.
  • In March 2022, Savcor Products Australia unveiled a new type of compact and innovative galvanic anode designed for concrete structures. These anodes are alkali-activated, making them easy to install under the concrete cover. Each anode contains 130 grams of zinc and is designed to provide long-term protection with excellent current distribution around the repair area.

Market Concentration & Characteristics

The Burn Off Oven Market displays a moderately fragmented structure with a mix of global manufacturers and regional players offering a wide range of solutions tailored to industrial cleaning applications. It is characterized by steady technological advancements, rising environmental compliance requirements, and increased demand for custom-built systems. Key players focus on enhancing energy efficiency, automation, and emission control features to meet evolving industrial standards. The market demonstrates moderate-to-high entry barriers due to the capital-intensive nature of manufacturing and the need for technical expertise. Product differentiation is often driven by application-specific design, oven capacity, and fuel type. Demand remains concentrated in sectors like automotive, aerospace, and metal recycling, where thermal cleaning provides operational and environmental advantages. While larger companies hold a strong presence in North America and Europe, regional manufacturers in Asia Pacific and Latin America continue expanding their footprint by offering cost-effective and locally customized solutions. The market reflects stable demand cycles supported by recurring maintenance and refurbishment activities.

Report Coverage

The research report offers an in-depth analysis based on Oven Type, Capacity, Application, End Use and Geography. It details leading market players, providing an overview of their business, product offerings, investments, revenue streams, and key applications. Additionally, the report includes insights into the competitive environment, SWOT analysis, current market trends, as well as the primary drivers and constraints. Furthermore, it discusses various factors that have driven market expansion in recent years. The report also explores market dynamics, regulatory scenarios, and technological advancements that are shaping the industry. It assesses the impact of external factors and global economic changes on market growth. Lastly, it provides strategic recommendations for new entrants and established companies to navigate the complexities of the market.

Future Outlook

  1. The burn off oven market will continue to grow steadily due to increasing demand for non-chemical cleaning solutions in industrial applications.
  2. Rising environmental regulations will drive the adoption of electric burn off ovens across developed and regulated markets.
  3. The automotive and aerospace sectors will remain key end-users, fueling consistent demand for component refurbishment and paint stripping.
  4. Advancements in automation and temperature control technologies will enhance efficiency and safety in burn off oven operations.
  5. Manufacturers will focus on energy-efficient designs to meet sustainability goals and reduce operating costs.
  6. Asia Pacific will maintain its leading market position due to rapid industrialization and expansion in manufacturing infrastructure.
  7. North America will experience stable growth supported by stringent environmental standards and rising equipment replacement rates.
  8. Customization and capacity-specific designs will gain traction among users seeking tailored solutions for their operations.
  9. High initial investment and maintenance requirements will remain key challenges for smaller manufacturers.
  10. Strategic partnerships and product innovation will shape competitive dynamics in the global burn off oven market.

CHAPTER NO. 1: GENESIS OF THE MARKET

1.1 Market Prelude – Introduction & Scope

1.2 The Big Picture – Objectives & Vision

1.3 Strategic Edge – Unique Value Proposition

1.4 Stakeholder Compass – Key Beneficiaries

CHAPTER NO. 2: EXECUTIVE LENS

2.1 Pulse of the Industry – Market Snapshot

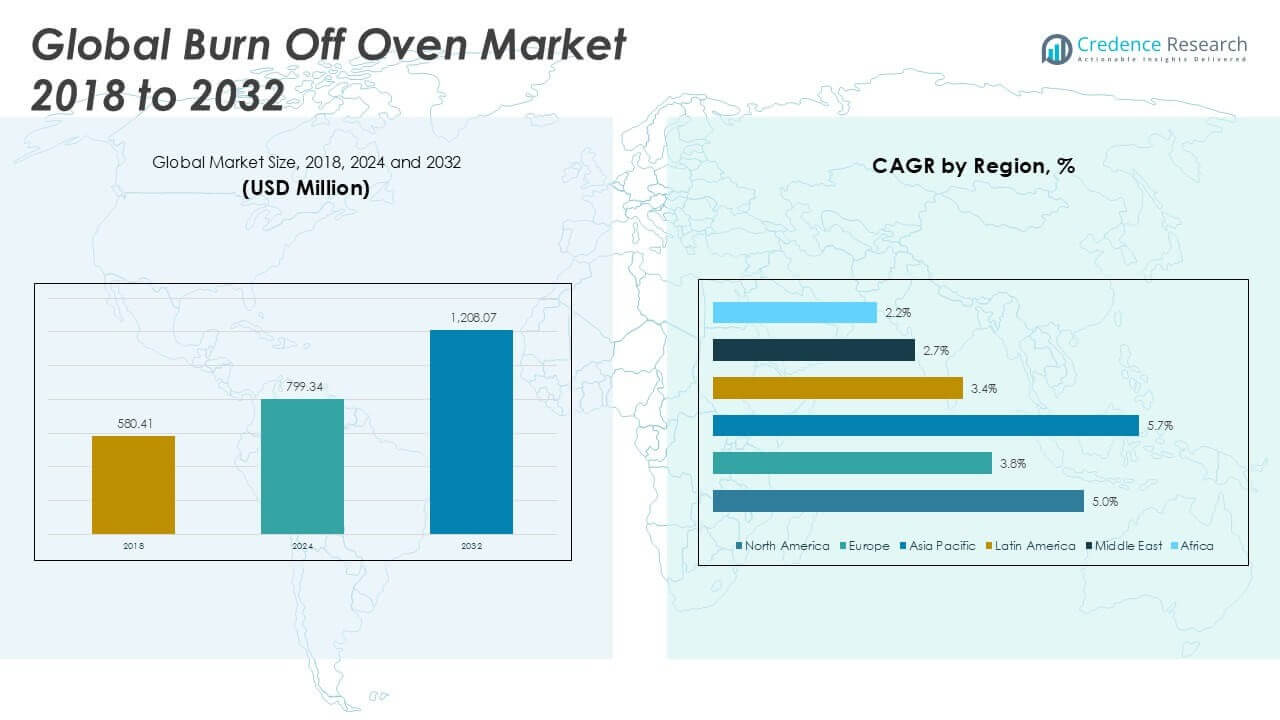
2.2 Growth Arc – Revenue Projections (USD Million)

2.3. Premium Insights – Based on Primary Interviews

CHAPTER NO. 3: BURN OFF OVEN MARKET FORCES & INDUSTRY PULSE

3.1 Foundations of Change – Market Overview
3.2 Catalysts of Expansion – Key Market Drivers
3.2.1 Momentum Boosters – Growth Triggers
3.2.2 Innovation Fuel – Disruptive Technologies
3.3 Headwinds & Crosswinds – Market Restraints
3.3.1 Regulatory Tides – Compliance Challenges
3.3.2 Economic Frictions – Inflationary Pressures
3.4 Untapped Horizons – Growth Potential & Opportunities
3.5 Strategic Navigation – Industry Frameworks
3.5.1 Market Equilibrium – Porter’s Five Forces
3.5.2 Ecosystem Dynamics – Value Chain Analysis
3.5.3 Macro Forces – PESTEL Breakdown

3.6 Price Trend Analysis

    3.6.1 Regional Price Trend
3.6.2 Price Trend by Product

CHAPTER NO. 4: KEY INVESTMENT EPICENTER         

4.1 Regional Goldmines – High-Growth Geographies

4.2 Product Frontiers – Lucrative Product Categories

4.3 Application Sweet Spots – Emerging Demand Segments

CHAPTER NO. 5: REVENUE TRAJECTORY & WEALTH MAPPING

5.1 Momentum Metrics – Forecast & Growth Curves

5.2 Regional Revenue Footprint – Market Share Insights

5.3 Segmental Wealth Flow – Oven Type & Application Revenue

CHAPTER NO. 6: TRADE & COMMERCE ANALYSIS     

6.1.      Import Analysis by Region

6.1.1.    Global Burn Off Oven Market Import Volume By Region

6.2.      Export Analysis by Region

6.2.1.    Global Burn Off Oven Market Export Volume By Region

CHAPTER NO. 7: COMPETITION ANALYSIS       

7.1.      Company Market Share Analysis

7.1.1.    Global Burn Off Oven Market: Company Market Share

7.1.      Global Burn Off Oven Market Company Volume Market Share

7.2.      Global Burn Off Oven Market Company Revenue Market Share

7.3.      Strategic Developments

7.3.1.    Acquisitions & Mergers

7.3.2.    New Oven Type Launch

7.3.3.    Regional Expansion

7.4.      Competitive Dashboard

7.5.    Company Assessment Metrics, 2024

CHAPTER NO. 8: BURN OFF OVEN MARKET – BY OVEN TYPE SEGMENT ANALYSIS

8.1.      Burn Off Oven Market Overview by Oven Type Segment

8.1.1.    Burn Off Oven Market Volume Share By Oven Type

8.1.2.    Burn Off Oven Market Revenue Share By Oven Type

8.2.      Gas Fired Burn Off Oven

8.3.      Electric Burn Off Oven

CHAPTER NO. 9: BURN OFF OVEN MARKET – BY CAPACITY SEGMENT ANALYSIS

9.1.      Burn Off Oven Market Overview by Capacity Segment

9.1.1.    Burn Off Oven Market Volume Share By Capacity

9.1.2.    Burn Off Oven Market Revenue Share By Capacity

9.2.      500 to 1000 Kg

9.3.      1000 to 2000 Kg

9.4.      2000 to 3000 Kg

9.5.      3000 Kg

CHAPTER NO. 10: BURN OFF OVEN MARKET – BY APPLICATION SEGMENT ANALYSIS

10.1.     Burn Off Oven Market Overview by Application Segment

10.1.1.  Burn Off Oven Market Volume Share By Application

10.1.2.  Burn Off Oven Market Revenue Share By Application

10.2.     Paint & Coating Stripping

10.3.     Plastic Stripping

10.4.     Auto-parts & Engine Rebuilding

10.5.     Chemical Cleaning

CHAPTER NO. 11: BURN OFF OVEN MARKET – BY END-USE SEGMENT ANALYSIS

11.1.     Burn Off Oven Market Overview by End-use Segment

11.1.1.  Burn Off Oven Market Volume Share By End-use

11.1.2.  Burn Off Oven Market Revenue Share By End-use

11.2.     Paint & Coating

11.3.     Plastics

11.4.     Fibers

11.5.     Electric Motors

11.6.     Oil and Gas

CHAPTER NO. 12: BURN OFF OVEN MARKET – REGIONAL ANALYSIS

12.1.     Burn Off Oven Market Overview by Region Segment

12.1.1.  Global Burn Off Oven Market Volume Share By Region

12.1.2.  Global Burn Off Oven Market Revenue Share By Region

12.1.3.  Regions

12.1.4.  Global Burn Off Oven Market Volume By Region

12.1.5.  Global Burn Off Oven Market Revenue By Region

12.1.6.  Oven Type

12.1.7.  Global Burn Off Oven Market Volume By Oven Type

12.1.8.  Global Burn Off Oven Market Revenue By Oven Type

12.1.9.  Capacity

12.1.10. Global Burn Off Oven Market Volume By Capacity

12.1.11. Global Burn Off Oven Market Revenue By Capacity

12.1.12. Application

12.1.13. Global Burn Off Oven Market Volume By Application

12.1.14. Global Burn Off Oven Market Revenue By Application

12.1.12. End-use

12.1.13. Global Burn Off Oven Market Volume By End-use

12.1.14. Global Burn Off Oven Market Revenue By End-use

CHAPTER NO. 13: NORTH AMERICA BURN OFF OVEN MARKET – COUNTRY ANALYSIS

13.1.     North America Burn Off Oven Market Overview by Country Segment

13.1.1.  North America Burn Off Oven Market Volume Share By Region

13.1.2.  North America Burn Off Oven Market Revenue Share By Region

13.2.     North America

13.2.1.  North America Burn Off Oven Market Volume By Country

13.2.2.  North America Burn Off Oven Market Revenue By Country

13.2.3.  Oven Type

13.2.4.  North America Burn Off Oven Market Volume By Oven Type

13.2.5.  North America Burn Off Oven Market Revenue By Oven Type

13.2.6.  Capacity

13.2.7.  North America Burn Off Oven Market Volume By Capacity

13.2.8.  North America Burn Off Oven Market Revenue By Capacity

13.2.9.  Application

13.2.10. North America Burn Off Oven Market Volume By Application

13.2.11. North America Burn Off Oven Market Revenue By Application

13.2.12. End-use

13.2.13. North America Burn Off Oven Market Volume By End-use

13.2.14. North America Burn Off Oven Market Revenue By End-use

13.3.     U.S.

13.4.     Canada

13.5.     Mexico

CHAPTER NO. 14: EUROPE BURN OFF OVEN MARKET – COUNTRY ANALYSIS

14.1.     Europe Burn Off Oven Market Overview by Country Segment

14.1.1.  Europe Burn Off Oven Market Volume Share By Region

14.1.2.  Europe Burn Off Oven Market Revenue Share By Region

14.2.     Europe

14.2.1.  Europe Burn Off Oven Market Volume By Country

14.2.2.  Europe Burn Off Oven Market Revenue By Country

14.2.3.  Oven Type

14.2.4.  Europe Burn Off Oven Market Volume By Oven Type

14.2.5.  Europe Burn Off Oven Market Revenue By Oven Type

14.2.6.  Capacity

14.2.7.  Europe Burn Off Oven Market Volume By Capacity

14.2.8.  Europe Burn Off Oven Market Revenue By Capacity

14.2.9.  Application

14.2.10. Europe Burn Off Oven Market Volume By Application

14.2.11. Europe Burn Off Oven Market Revenue By Application

14.2.12. End-use

14.2.13. Europe Burn Off Oven Market Volume By End-use

14.2.14. Europe Burn Off Oven Market Revenue By End-use

14.3.     UK

14.4.     France

14.5.     Germany

14.6.     Italy

14.7.     Spain

14.8.     Russia

14.9.   Rest of Europe

CHAPTER NO. 15: ASIA PACIFIC BURN OFF OVEN MARKET – COUNTRY ANALYSIS

15.1.     Asia Pacific Burn Off Oven Market Overview by Country Segment

15.1.1.  Asia Pacific Burn Off Oven Market Volume Share By Region

15.1.2.  Asia Pacific Burn Off Oven Market Revenue Share By Region

15.2.     Asia Pacific

15.2.1.  Asia Pacific Burn Off Oven Market Volume By Country

15.2.2.  Asia Pacific Burn Off Oven Market Revenue By Country

15.2.3.  Oven Type

15.2.4.  Asia Pacific Burn Off Oven Market Volume By Oven Type

15.2.5.  Asia Pacific Burn Off Oven Market Revenue By Oven Type

15.2.6.  Capacity

15.2.7.  Asia Pacific Burn Off Oven Market Volume By Capacity

15.2.8.  Asia Pacific Burn Off Oven Market Revenue By Capacity

15.2.9.  Application

15.2.10. Asia Pacific Burn Off Oven Market Volume By Application

15.2.11. Asia Pacific Burn Off Oven Market Revenue By Application

15.2.12. End-use

15.2.13. Asia Pacific Burn Off Oven Market Volume By End-use

15.2.14. Asia Pacific Burn Off Oven Market Revenue By End-use

15.3.     China

15.4.     Japan

15.5.     South Korea

15.6.     India

15.7.     Australia

15.8.     Southeast Asia

15.9.     Rest of Asia Pacific

CHAPTER NO. 16: LATIN AMERICA BURN OFF OVEN MARKET – COUNTRY ANALYSIS

16.1.     Latin America Burn Off Oven Market Overview by Country Segment

16.1.1.  Latin America Burn Off Oven Market Volume Share By Region

16.1.2.  Latin America Burn Off Oven Market Revenue Share By Region

16.2.     Latin America

16.2.1.  Latin America Burn Off Oven Market Volume By Country

16.2.2.  Latin America Burn Off Oven Market Revenue By Country

16.2.3.  Oven Type

16.2.4.  Latin America Burn Off Oven Market Volume By Oven Type

16.2.5.  Latin America Burn Off Oven Market Revenue By Oven Type

16.2.6.  Capacity

16.2.7.  Latin America Burn Off Oven Market Volume By Capacity

16.2.8.  Latin America Burn Off Oven Market Revenue By Capacity

16.2.9.  Application

16.2.10. Latin America Burn Off Oven Market Volume By Application

16.2.11. Latin America Burn Off Oven Market Revenue By Application

16.2.12. End-use

16.2.13. Latin America Burn Off Oven Market Volume By End-use

16.2.14. Latin America Burn Off Oven Market Revenue By End-use

16.3.     Brazil

16.4.     Argentina

16.5.     Rest of Latin America

CHAPTER NO. 17: MIDDLE EAST BURN OFF OVEN MARKET – COUNTRY ANALYSIS

17.1.     Middle East Burn Off Oven Market Overview by Country Segment

17.1.1.  Middle East Burn Off Oven Market Volume Share By Region

17.1.2.  Middle East Burn Off Oven Market Revenue Share By Region

17.2.     Middle East

17.2.1.  Middle East Burn Off Oven Market Volume By Country

17.2.2.  Middle East Burn Off Oven Market Revenue By Country

17.2.3.  Oven Type

17.2.4.  Middle East Burn Off Oven Market Volume By Oven Type

17.2.5.  Middle East Burn Off Oven Market Revenue By Oven Type

17.2.6.  Capacity

17.2.7.  Middle East Burn Off Oven Market Volume By Capacity

17.2.8.  Middle East Burn Off Oven Market Revenue By Capacity

17.2.9.  Application

17.2.10. Middle East Burn Off Oven Market Volume By Application

17.2.11. Middle East Burn Off Oven Market Revenue By Application

17.2.12. End-use

17.2.13. Middle East Burn Off Oven Market Volume By End-use

17.2.14. Middle East Burn Off Oven Market Revenue By End-use

17.3.     GCC Countries

17.4.     Israel

17.5.     Turkey

17.6.     Rest of Middle East

CHAPTER NO. 18: AFRICA BURN OFF OVEN MARKET – COUNTRY ANALYSIS

18.1.     Africa Burn Off Oven Market Overview by Country Segment

18.1.1.  Africa Burn Off Oven Market Volume Share By Region

18.1.2.  Africa Burn Off Oven Market Revenue Share By Region

18.2.     Africa

18.2.1.  Africa Burn Off Oven Market Volume By Country

18.2.2.  Africa Burn Off Oven Market Revenue By Country

18.2.3.  Oven Type

18.2.4.  Africa Burn Off Oven Market Volume By Oven Type

18.2.5.  Africa Burn Off Oven Market Revenue By Oven Type

18.2.6.  Capacity

18.2.7.  Africa Burn Off Oven Market Volume By Capacity

18.2.8.  Africa Burn Off Oven Market Revenue By Capacity

18.2.9.  Application

18.2.10. Africa Burn Off Oven Market Volume By Application

18.2.11. Africa Burn Off Oven Market Revenue By Application

18.2.12. End-use

18.2.13. Africa Burn Off Oven Market Volume By End-use

18.2.14. Africa Burn Off Oven Market Revenue By End-use

18.3.     South Africa

18.4.     Egypt

18.5.     Rest of Africa

CHAPTER NO. 19: COMPANY PROFILES 

19.1.     ACE Equipment

19.1.1.  Company Overview

19.1.2.  Product Portfolio

19.1.3.  Financial Overview

19.1.4.  Recent Developments

19.1.5.  Growth Strategy

19.1.6.  SWOT Analysis

19.2.     Steelman Industries Inc.

19.3.     Therma-Tron-X, Inc.

19.4.     Benko Products Inc.

19.5.     David Weisman, L.L.C.

19.6.     Pollution Control Products Co.

19.7.     Davron Technologies Inc.

19.8.     ComEnCo Systems Inc.

19.9.     Consolidated Engineering Company

19.10.   Acmas Technocracy Private Limited

19.11.   Akalbatu

19.12.   The Wesman Engineering Company Private Limited

Frequently Asked Questions

What is the current size of the Burn Off Oven Market?

The Burn Off Oven Market was valued at USD 799.34 million in 2024 and is projected to reach USD 1,208.07 million by 2032 at a CAGR of 4.93%.

What are the key segments within the Burn Off Oven Market?

Key segments include Oven Type (Gas Fired, Electric), Capacity, Application (e.g., Paint Stripping), and End-Use (e.g., Electric Motors, Oil & Gas).

What are some challenges faced by the Burn Off Oven Market?

High installation costs, energy consumption, and strict emission control requirements pose key challenges for market expansion.

Who are the major players in the Burn Off Oven Market?

Major players include ACE Equipment, Steelman Industries Inc., Therma-Tron-X, Pollution Control Products Co., and Benko Products Inc.

About Author

Sushant Phapale

Sushant Phapale

ICT & Automation Expert

Sushant is an expert in ICT, automation, and electronics with a passion for innovation and market trends.

View Profile

Gunakesh Parmar

Reviewed By
Gunakesh Parmar

Research Consultant

With over 15 years of dedicated experience in market research since 2009, specializes in delivering actionable insights from data.

View Profile

Radiation Hardened ASIC Market

Published:
Report ID: 110525

EDA Tools for ASIC Design Market

Published:
Report ID: 110084

Built-In Electric Oven Market

Published:
Report ID: 110072

Low Power ASIC Design Market

Published:
Report ID: 110100

ASIC Emulation and Prototyping Systems Market

Published:
Report ID: 110409

Edge AI ASIC Chip Market

Published:
Report ID: 110087

Quantum Computing ASIC Market

Published:
Report ID: 110103

Motor Testing Equipment Market

Published:
Report ID: 110285

Brewery Heat Exchanger Market

Published:
Report ID: 110052

USB Controllers Market

Published:
Report ID: 11145

ASIC Design IP Core Market

Published:
Report ID: 109594

Purchase Options

The report comes as a view-only PDF document, optimized for individual clients. This version is recommended for personal digital use and does not allow printing.
$4699

To meet the needs of modern corporate teams, our report comes in two formats: a printable PDF and a data-rich Excel sheet. This package is optimized for internal analysis and multi-location access, making it an excellent choice for organizations with distributed workforce.
$5699

The report will be delivered in printable PDF format along with the report’s data Excel sheet. This license offers 100 Free Analyst hours where the client can utilize Credence Research Inc.’s research team. It is highly recommended for organizations seeking to execute short, customized research projects related to the scope of the purchased report.
$12699

Credence Staff 3

WILLIAM, North America

Support Staff at Credence Research

KEITH PHILLIPS, Europe

Lee - CR Sales Staff

LEE VALLANCE, Asia Pacific

Smallform of Sample request

Report delivery within 24 to 48 hours

What people say?-

User Review

I am very impressed with the information in this report. The author clearly did their research when they came up with this product and it has already given me a lot of ideas.

Jana Schmidt
CEDAR CX Technologies

– Connect with us –

Phone

+91 6232 49 3207


support

24/7 Research Support


[email protected]

– Research Methodology –

Going beyond the basics: advanced techniques in research methodology

Pepshi, LG, Nestle
Motorola, Honeywell, Johnson and johnson
LG Chem, SIEMENS, Pfizer
Unilever, Samsonite, QIAGEN

Request Sample