
Cell Based Assay Market Overview:
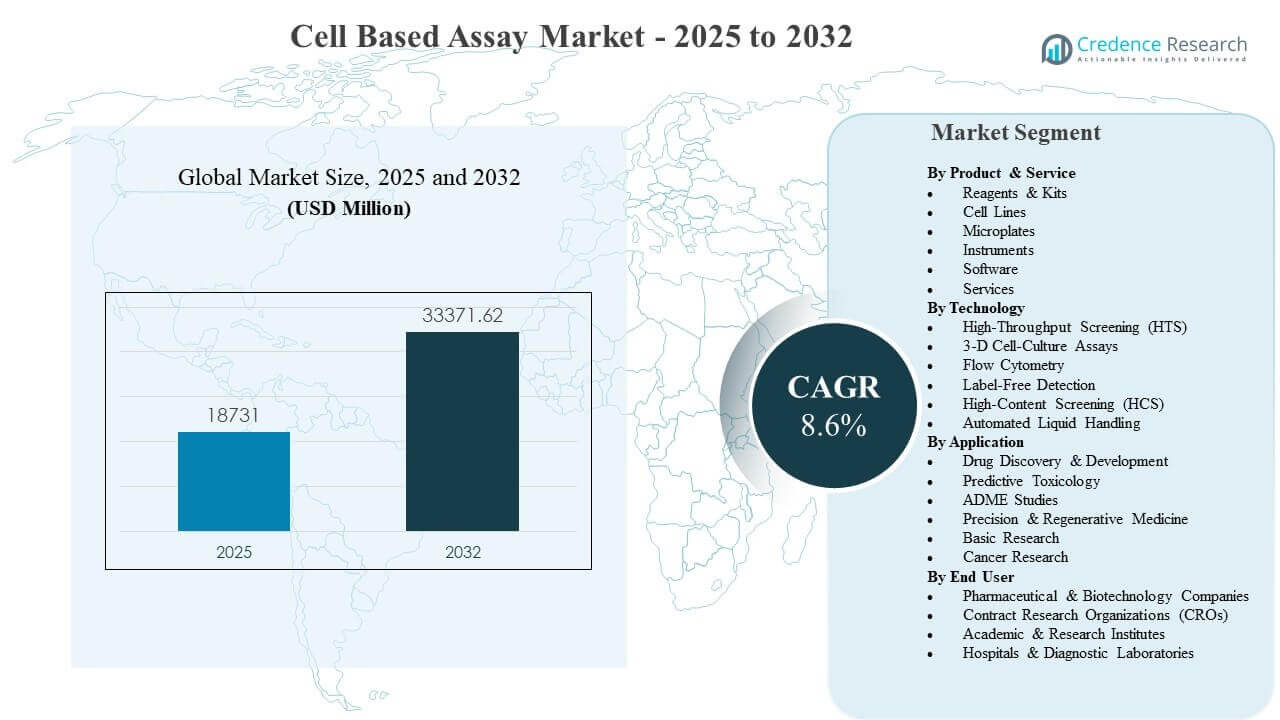
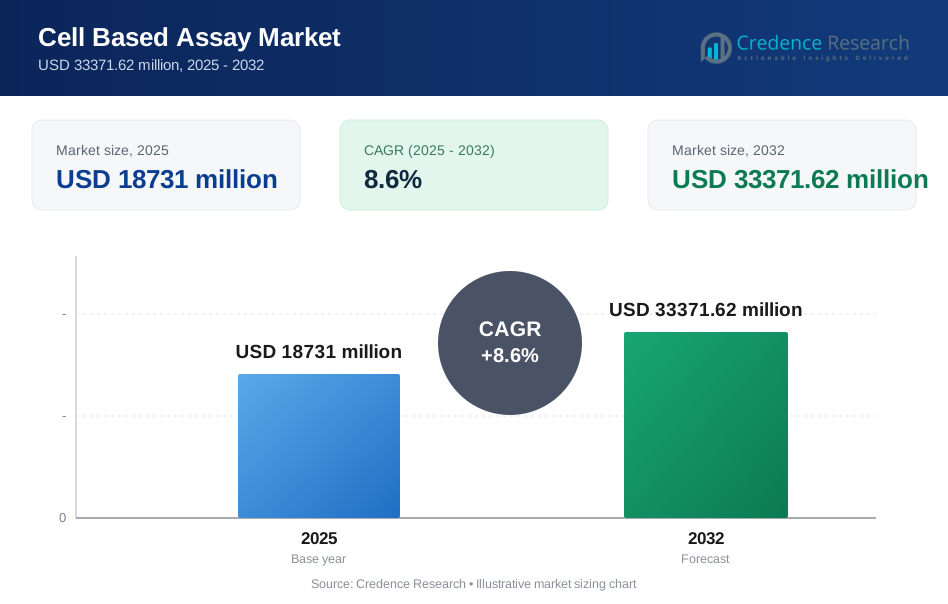
The global Cell Based Assay Market size was estimated at USD 18731 million in 2025 and is expected to reach USD 33371.62 million by 2032, growing at a CAGR of 8.6% from 2025 to 2032. Growth is primarily driven by sustained increases in pharmaceutical and biotechnology R&D activity that expand the volume of functional testing required across target validation, pathway interrogation, and early safety screening workflows. Wider adoption of automation, image-based readouts, and more physiologically relevant cell models continues to raise assay complexity and recurring demand for standardized reagents, plates, and analysis software across discovery and translational programs.
| REPORT ATTRIBUTE | DETAILS |
|---|---|
| Historical Period | 2020-2024 |
| Base Year | 2025 |
| Forecast Period | 2026-2032 |
| Cell Based Assay Market Size 2025 | USD 18731 million |
| Cell Based Assay Market, CAGR | 8.6% |
| Cell Based Assay Market Size 2032 | USD 33371.62 million |
Key Market Trends & Insights
- The Cell Based Assay Market is projected to expand at an 8.6% CAGR during 2025–2032, reflecting sustained demand for scalable functional screening.
- North America accounted for 40.85% of 2025 revenue, supported by dense biopharma R&D and assay platform adoption.
- Reagents & Kits led the 2025 product and service mix with 46.3% share, supported by recurring consumption and workflow standardization.
- High-Throughput Screening (HTS) held 37.4% share in 2025, reflecting continued reliance on high-volume compound triage in discovery labs.
- Drug discovery and development remained the leading application area, underscoring the central role of cell-based readouts in guiding pipeline decisions across target validation, lead optimization, and early safety screening.
Segment Analysis
Cell Based Assay Market demand is anchored in high-frequency experimental workflows where reproducibility, throughput, and assay robustness determine purchasing priorities. Reagents, plates, and assay-ready consumables maintain strong recurring demand because assay runs repeat across targets, cell models, and compound libraries. Automation and standardized protocols increase consistency in multi-plate runs, supporting adoption of integrated solutions that combine assay chemistry, handling systems, and data processing. Expansion of more complex disease models, including 3-D formats, strengthens demand for imaging-capable platforms and analytics that can capture multi-parameter responses.
Technology choices in the Cell Based Assay Market are shaped by screening scale, readout complexity, and time-to-result requirements. High-throughput environments prioritize rapid turnaround and high plate capacity, reinforcing adoption of HTS-compatible detection chemistries and liquid handling. 3-D assays continue to expand in use where translational relevance is critical, increasing demand for imaging and software that can quantify morphology and phenotype at scale. End-user buying behavior also favors validated workflows with strong technical support, particularly for regulated or late-stage programs.
By Product & Service Insights
Reagents & Kits accounted for the largest share of 46.3% in 2025. Reagents & Kits lead because high assay repetition rates create steady replenishment needs across viability, proliferation, reporter, and pathway panels. Standardized kit formats also improve lab-to-lab consistency and reduce protocol variability during scale-up. Broader adoption of multiplexed assays further increases demand for compatible detection chemistries and optimized buffers. Vendor ecosystems that bundle reagents with instruments and analysis tools reinforce stickiness across purchasing cycles.
By Technology Insights
High-Throughput Screening (HTS) accounted for the largest share of 37.4% in 2025. HTS leads because discovery teams require rapid functional triage across large compound collections using plate-based workflows. High screening volumes reward automation, streamlined assay setup, and robust signal windows that reduce repeat testing. Mature HTS infrastructure across large pharma and leading CROs supports continued platform investment. Compatibility across liquid handling, detection, and analysis software also reduces operational friction for multi-assay programs.
By Application Insights
Drug Discovery & Development leads application demand in the Cell Based Assay Market because pipeline progression requires continuous functional evidence across targets, pathways, and phenotypic responses. Early-stage programs run repeated experiments for hit-to-lead optimization and mechanism validation, which sustains high assay throughput. Predictive toxicology and ADME studies strengthen adoption of cell-based approaches that flag risk earlier than late-stage testing. Precision and regenerative medicine programs further increase demand for assays built around disease-relevant cell models and functional endpoints.
By End User Insights
Pharmaceutical & Biotechnology Companies represent the primary end-user base for the Cell Based Assay Market due to continuous screening, validation, and safety characterization requirements across development stages. Large-scale discovery operations also drive demand for automation-friendly consumables and standardized assay kits that improve consistency. Contract Research Organizations (CROs) expand usage by providing outsourced assay capacity, especially for specialized formats and time-sensitive projects. Academic and research institutes sustain demand through method development and translational studies that later inform industrial workflows.
Cell Based Assay Market Drivers
Expansion Of Biopharma Research And Screening Volumes
Biopharma pipelines require high-frequency functional testing across targets, pathways, and phenotypes. Cell-based assays provide closer biological relevance than purely biochemical methods in many use cases. Increased compound library screening and faster iteration cycles push laboratories toward higher throughput and standardized consumables. Growing outsourcing and collaborative models also increase total assay volumes executed across sponsor and partner networks.
Rising Adoption Of Automation And Integrated Workflows
Laboratory automation reduces variability and improves reproducibility across multi-plate experiments. Automated liquid handling increases throughput and enables consistent dosing and timing control. Integration of instruments, reagents, and analysis software shortens setup time and supports standardized reporting. Automation investments also align with cost and productivity targets across pharma, biotech, and CRO operations.
- For instance, Bio-Rad reports that its ZE5 Cell Analyzer can acquire up to 100,000 events per second, process 96-well plates in under 15 minutes and 384-well plates in under 60 minutes, while also supporting API-based integration into automated laboratory systems.
Shift Toward More Physiologically Relevant Cell Models
Research programs increasingly use complex cell models to improve translational relevance. 3-D formats and co-culture systems support better representation of tissue-like behavior in screening and mechanistic studies. Complex models increase the need for advanced imaging, robust detection chemistries, and data analytics. Demand also rises for validated cell lines and assay-ready cell systems that reduce development time.
- For instance, Corning reports that its 1536-well spheroid microplate can generate 1,536 uniform single spheroids in one plate and achieved Z’ values above 0.7 in three independent studies, showing how 3-D assay platforms are being engineered for both physiological relevance and screening robustness.
Growth Of Oncology And Precision Medicine Research
Oncology research requires pathway-rich and phenotype-driven readouts that cell-based assays can capture efficiently. Precision medicine programs favor functional assessment of patient-relevant biology and treatment response signatures. Expansion of targeted therapeutics and combination regimens increases assay complexity and multiplexing needs. These dynamics support demand for high-content methods, label-free detection options, and software-driven analytics.
Cell Based Assay Market Challenges
Assay variability remains a core operational challenge for the Cell Based Assay Market because cell health, passage number, media conditions, and handling steps can influence results. Complex workflows also require strict process control to maintain reproducibility across sites and time. Multi-parameter assays generate large datasets that require specialized analysis skills and validated pipelines. These constraints increase training and quality requirements, especially in regulated or late-stage environments.
- For instance, Revvity states that its Cellometer K2 can deliver cell images, concentration, viability, and mean diameter results in 60 seconds, uses pattern-recognition software that can analyze more than 98% of mammalian cell types, and in a 24-sample Jurkat dataset reported a coefficient of variation of 8.9% for concentration and 1.0% for viability, illustrating how vendors are quantifying reproducibility and reducing operator-dependent variability at the cell-health assessment stage.
Cost and integration complexity can slow adoption for smaller laboratories and emerging biotechs. Advanced imaging systems, automation, and enterprise-grade software add substantial capital and validation effort. Workflow interoperability issues can arise when reagents, instruments, and data platforms come from multiple suppliers. Procurement cycles may also extend when laboratories require strong evidence of performance consistency across diverse cell models.
Cell Based Assay Market Trends and Opportunities
AI-assisted image analysis is becoming an increasingly important trend as imaging-based assays scale across more endpoints and more complex models. Improved analytics can reduce manual interpretation and expand the usable signal extracted from brightfield and fluorescence datasets. Wider adoption of standardized software pipelines can accelerate decision cycles in discovery and translational research. Growing interest in phenotypic screening further increases demand for advanced analysis capabilities.
- For instance, Molecular Devices reports that its ImageXpress Confocal HT.ai high-content imaging system features 7 lasers and 8 imaging channels, delivers up to 2x faster scan speed, and, with MetaXpress PowerCore, can increase analysis speed by up to 40x, reducing 3D analysis workflows from hours to minutes.
3-D cell-culture assays present a major opportunity because research teams seek closer biological relevance for toxicity and efficacy predictions. Expansion of organoid and spheroid workflows supports demand for imaging-capable live-cell systems, compatible microplates, and optimized assay reagents. Vendors that provide validated end-to-end workflows for 3-D formats can reduce adoption friction for new users. Increasing CRO capacity for complex model execution can also broaden market access across smaller sponsors.
Regional Insights
North America
North America represented 40.85% of Cell Based Assay Market revenue in 2025. Regional demand is supported by high biopharma R&D intensity, large installed bases of automation and imaging platforms, and mature CRO ecosystems. Purchasing often prioritizes validated workflows, scalable consumables, and integrated software that supports standardized reporting. Strong academic and translational research activity also supports adoption of newer assay formats.
Europe
Europe accounted for 24.80% of Cell Based Assay Market revenue in 2025. The region benefits from established pharmaceutical hubs and a strong academic research base that sustains method development and assay adoption. European buyers often emphasize compliance readiness, reproducibility, and cross-site standardization. Demand is also supported by expanding translational programs and collaborations across public and private research networks.
Asia Pacific
Asia Pacific represented 27.00% of Cell Based Assay Market revenue in 2025 and remains a key growth engine as biopharma capacity expands across major economies. Increased R&D investment and growth in CRO capabilities strengthen demand for HTS-compatible consumables, automation, and data tools. Scale-up of translational and oncology research increases the need for imaging-based assays and standardized reagents. Vendor partnerships and local manufacturing expansion can further accelerate adoption.
Latin America
Latin America held 4.80% of Cell Based Assay Market revenue in 2025, supported by expanding research activity and increasing participation in clinical and translational programs. Adoption is typically concentrated in leading hubs where research infrastructure and funding levels support modern assay systems. Demand growth is reinforced by gradual upgrades in laboratory automation and expanding CRO participation. Regional procurement often favors cost-effective, reliable consumables and flexible platform compatibility.
Middle East & Africa
Middle East and Africa captured 2.55% of Cell Based Assay Market revenue in 2025. Market activity is concentrated in select research and healthcare hubs where investment supports laboratory modernization and translational research. Demand growth is linked to healthcare system upgrades, research capacity building, and targeted biopharma initiatives. Purchases commonly prioritize reliability, technical support, and scalable consumables aligned with evolving research programs.
Competitive Landscape
Competition in the Cell Based Assay Market centers on workflow breadth, reliability, and integration across consumables, automation, detection, and data analysis. Suppliers differentiate through validated assay performance, platform interoperability, automation readiness, and application support for complex models such as 3-D cultures. Portfolio depth across reagents, microplates, instruments, and software enables cross-selling and supports long-term customer retention. Strategic investments in imaging analytics, automation compatibility, and standardized kits strengthen positioning for high-throughput and multi-parameter use cases.
Thermo Fisher Scientific maintains a strong position through broad workflow coverage across cell culture, assay reagents, consumables, and instrumentation that supports end-to-end execution. The company’s approach emphasizes standardized kits and compatible tools that reduce variability and shorten assay development cycles. Broad distribution and support infrastructure also strengthens adoption across pharma, biotech, CROs, and academic laboratories. Continuous portfolio updates in reagents and software-enabled workflows help address growing assay complexity.
The industry research and growth report includes detailed analyses of the competitive landscape of the market and information about key companies, including:
- Thermo Fisher Scientific
- Danaher Corporation
- Becton, Dickinson and Company (BD)
- Merck KGaA
- Bio-Rad Laboratories
- PerkinElmer
- Corning Incorporated
- Lonza Group
- Charles River Laboratories
- Eurofins Scientific
- Promega Corporation
- Agilent Technologies
- Sartorius AG
- Revvity
Qualitative and quantitative analysis of companies has been conducted to help clients understand the wider business environment as well as the strengths and weaknesses of key industry players. Data is qualitatively analyzed to categorize companies as pure play, category-focused, industry-focused, and diversified; it is quantitatively analyzed to categorize companies as dominant, leading, strong, tentative, and weak.
Recent Developments
- In October 2025, MilliporeSigma partnered with Promega to advance 3D cell drug discovery technologies, combining MilliporeSigma’s organoid and synthetic chemistry capabilities with Promega’s assay and reporter technologies. The collaboration is aimed at developing assays that can track cellular activity in real time within 3D cell cultures, which are more biologically relevant than traditional 2D models.
- In May 2025, INDIGO Biosciences launched its Stable Reporter Cell Lines, expanding its cell-based assay portfolio for drug discovery and toxicology research. The company positioned these new reporter cell lines as long-term tools for researchers running sustained screening and toxicity studies.
- In April 2025, CN Bio entered a long-term strategic partnership with Pharmaron to develop organ-on-a-chip technologies for drug discovery and development. Under the agreement, Pharmaron will validate CN Bio’s PhysioMimix technology across existing applications, while both companies also plan to develop new applications and install PhysioMimix instruments across Pharmaron’s global facilities.
- In January 2025, Partillion Bioscience opened pre-orders for its Nanovial Multicell Assay Antibody Discovery Kits at SLAS 2025. The company said the platform is designed to transform cell-based assays by enabling paired-cell studies in nanoliter-scale hydrogel compartments and by delivering a scale equivalent to around 1,000 microwell plates in a single microcentrifuge tube.
Report Scope
| Report Attribute | Details |
| Market size value in 2025 | USD 18731 million |
| Revenue forecast in 2032 | USD 33371.62 million |
| Growth rate (CAGR) | 8.6% (2025–2032) |
| Base year | 2025 |
| Forecast period | 2026-2032 |
| Quantitative units | USD million |
| Segments covered | By Product & Service Outlook: Reagents & Kits, Cell Lines, Microplates, Instruments, Software, Services | By Technology Outlook: High-Throughput Screening (HTS), 3-D Cell-Culture Assays, Flow Cytometry, Label-Free Detection, High-Content Screening (HCS), Automated Liquid Handling | By Application Outlook: Drug Discovery & Development, Predictive Toxicology, ADME Studies, Precision & Regenerative Medicine, Basic Research, Cancer Research | By End User Outlook: Pharmaceutical & Biotechnology Companies, Contract Research Organizations (CROs), Academic & Research Institutes, Hospitals & Diagnostic Laboratories |
| Regional scope | North America, Europe, Asia Pacific, Latin America, Middle East & Africa |
| Key companies profiled | Thermo Fisher Scientific, Danaher Corporation, Becton, Dickinson and Company (BD), Merck KGaA, Bio-Rad Laboratories, PerkinElmer, Corning Incorporated, Lonza Group, Charles River Laboratories, Eurofins Scientific, Promega Corporation, Agilent Technologies, Sartorius AG, Revvity |
| No.of Pages | 341 |
Segmentation
By Product & Service
- Reagents & Kits
- Cell Lines
- Microplates
- Instruments
- Software
- Services
By Technology
- High-Throughput Screening (HTS)
- 3-D Cell-Culture Assays
- Flow Cytometry
- Label-Free Detection
- High-Content Screening (HCS)
- Automated Liquid Handling
By Application
- Drug Discovery & Development
- Predictive Toxicology
- ADME Studies
- Precision & Regenerative Medicine
- Basic Research
- Cancer Research
By End User
- Pharmaceutical & Biotechnology Companies
- Contract Research Organizations (CROs)
- Academic & Research Institutes
- Hospitals & Diagnostic Laboratories
By Region
- North America
- U.S.
- Canada
- Mexico
- Europe
- Germany
- France
- U.K.
- Italy
- Spain
- Rest of Europe
- Asia Pacific
- China
- Japan
- India
- South Korea
- South-east Asia
- Rest of Asia Pacific
- Latin America
- Brazil
- Argentina
- Rest of Latin America
- Middle East & Africa
- GCC Countries
- South Africa
- Rest of the Middle East and Africa
Request a Free Sample
Fill in your details and we'll send you a free sample report.
- Sample data tables & charts
- Research methodology
Need a Custom Version of This Report?
Tailor the scope, geography, or segments to your exact requirements.
- Custom geography or segment scope
- Direct access to our analyst team
Frequently Asked Questions
What is the market size of the Cell Based Assay Market in 2025 and the forecast for 2032?
What is the CAGR for the Cell Based Assay Market during 2025–2032?
What is the largest segment by product and service in 2025?
What are the main factors driving growth in the Cell Based Assay Market?
Who are the leading companies in the Cell Based Assay Market?
Which region leads the Cell Based Assay Market in 2025?
Table of Content
Chapter 1. Report Introduction
- 1.1 Report Description & Purpose
- 1.1.1 Report Title & Market Definition
- 1.1.2 Unique Selling Propositions (USP) & Key Differentiators
- 1.1.3 Value Proposition for Stakeholders
- 1.2 Research Objectives
- 1.2.1 Market Sizing Objectives (Volume & Revenue)
- 1.2.2 Segmentation Objectives
- 1.2.3 Competitive Intelligence Objectives
- 1.2.4 Forecast & Scenario Objectives
- 1.3 Report Scope
- 1.3.1 Cell Based Assay Scope – Types & Subtypes Covered
- 1.3.2 Geographic Scope – Regions & Countries Covered
- 1.3.3 Historical Period, Base Year & Forecast Period (2025; forecast to 2032)
- 1.3.4 Inclusions & Exclusions
- 1.4 HS Code & Classification Framework
- 1.5 Currency, Units & Pricing Basis
- 1.6 Target Stakeholders
- 1.7 Limitations & Assumptions
Chapter 2. Executive Summary
- 2.1 Global Cell Based Assay Market Snapshot
- 2.1.1 Market Size – Historical (2025) & Forecast (2025-2032) (2025: USD 18731 million → 2032: USD 33371.62 million)
- 2.1.2 Volume & Revenue – Global Totals
- 2.1.3 Key Market Highlights – Top Five Facts
- 2.2 Cell Based Assay Market Segmentation Snapshot
- 2.2.1 Market Split by Region – 2025 vs. 2032
- 2.3 Competitive Snapshot
- 2.3.1 Top 10 Players by Revenue Share – 2025
- 2.3.2 Top 10 Players by Volume Share – 2025
- 2.3.3 Recent Strategic Developments (18-Month Summary)
- 2.4 Key Investment Highlights & Strategic Conclusions
Chapter 3. Cell Based Assay Market Dynamics & Industry Analysis
- 3.1 Market Overview & Context
- 3.1.1 Cell Based Assay Market Position in the Broader Automotive Value Chain
- 3.1.2 OEM vs. Replacement Market Dynamics
- 3.1.3 Market Maturity & Development Stage by Region
- 3.2 Cell Based Assay Market Drivers
- 3.3 Cell Based Assay Market Restraints & Challenges
- 3.4 Cell Based Assay Market Opportunities
- 3.5 Porter's Five Forces Analysis
- 3.5.1 Threat of New Entrants
- 3.5.2 Bargaining Power of Suppliers
- 3.5.3 Bargaining Power of Buyers
- 3.5.4 Threat of Substitutes
- 3.5.5 Competitive Rivalry – Intensity Assessment
- 3.6 Cell Based Assay Value Chain Analysis
- 3.6.1 Upstream – Raw Material/Input Suppliers
- 3.6.1.1 Raw Material/Input 1
- 3.6.1.2 Raw Material/Input 2
- 3.6.1.3 Raw Material/Input 3
- 3.6.2 Midstream – Production/Manufacturing/Service Delivery
- 3.6.2.1 Production/Process Overview
- 3.6.2.2 Key Facility Locations & Capacity by Manufacturer
- 3.6.3 Downstream – Distribution & End Consumer
- 3.6.3.1 Primary Channel – B2B/OEM
- 3.6.3.2 Secondary Channels – Dealer, Retail, Online, Direct
- 3.6.4 Value Chain Profitability Analysis
- 3.6.1 Upstream – Raw Material/Input Suppliers
- 3.7 PESTEL Analysis
- 3.7.1 Political Factors
- 3.7.2 Economic Factors
- 3.7.3 Social Factors
- 3.7.4 Technological Factors
- 3.7.5 Environmental Factors
- 3.7.6 Legal Factors
- 3.8 Cell Based Assay Supply Chain Analysis
- 3.8.1 Raw Material/Input Supply Risk Assessment
- 3.8.2 Manufacturing Concentration Risk (Geographic Exposure)
- 3.8.3 Trade Disruption Impact Analysis
- 3.9 Regulatory & Policy Landscape
Note: The regulatory and policy landscape section covers regulations based on their applicability to the market, Cell Based Assay category, geography, and scope of the study. Only regulatory frameworks with a material impact on operations, compliance, trade, sustainability, or market access are analyzed in detail.
Chapter 4. Key Investment Pockets & Opportunity Analysis
- 4.1 Cell Based Assay Market Attractiveness Analysis
- 4.1.1 By Region – Investment Attractiveness Matrix (Volume × CAGR)
- 4.2 Absolute Revenue Growth Opportunity
- 4.2.1 By Region – Absolute USD Growth Through 2032
- 4.3 Incremental Volume Opportunity
- 4.3.1 By Region – Incremental Volume Through 2032
- 4.3.2 Segment – Incremental Volume
- 4.4 Emerging Submarket Opportunity Deep Dive (Subject to Applicability)
- 4.5 Emerging Market Opportunity Scorecards
- 4.5.1 United States
- 4.5.2 Europe
- 4.5.3 Asia
- 4.5.4 Middle East & Africa
Note: Emerging Market Opportunity Scorecards will be included based on relevance and strategic importance. Regions listed are indicative and may vary depending on data availability and market dynamics.
Chapter 5. Cell Based Assay Import-Export Analysis & Trade Flows
- 5.1 Global Trade Overview
- 5.1.1 Global Export Value by Country (2025)
- 5.1.2 Global Export Volume by Country (2025)
- 5.1.3 Global Import Value by Country (2025)
- 5.1.4 Global Import Volume by Country (2025)
- 5.1.5 Net Trade Balance by Country (2025)
- 5.2 Export Analysis – Segment
- 5.2.1 Type 1 (HS Code)
- 5.2.2 Type 2 (HS Code)
- 5.2.3 Type 3 (HS Code)
- 5.2.4 Type 4 (HS Code)
- 5.2.5 Type 5 (HS Code)
- 5.3 Import Analysis – Segment
- 5.3.1 Type 1 (HS Code)
- 5.3.2 Type 2 (HS Code)
- 5.3.3 Type 3 (HS Code)
- 5.3.4 Type 4 (HS Code)
- 5.3.5 Type 5 (HS Code)
- 5.4 Average Unit Trade Prices
- 5.4.1 Average Export Price – Segment & Country
- 5.4.2 Average Import Price – Segment & Source Country
- 5.4.3 Price Trends (2025)
- 5.5 Key Trade Route Analysis
- 5.5.1 Trade Route 1
- 5.5.2 Trade Route 2
- 5.5.3 Trade Route 3
- 5.5.4 Trade Route 4
- 5.5.5 Trade Route 5
- 5.6 Trade Policy Impact Assessment
- 5.6.1 US Anti-Dumping & Section 301 Tariffs
- 5.6.2 EU Customs Union Impact
- 5.6.3 Major Free Trade Agreements
- 5.6.4 USMCA Rules of Origin
Note: Trade policy analysis will be included only where relevant to the Cell Based Assay market.
Chapter 6. Competitive Landscape & Company Benchmarking
- 6.1 Cell Based Assay Market Concentration & Structure
- 6.1.1 Herfindahl-Hirschman Index (HHI) – vs. 2025
- 6.1.2 Tier 1, Tier 2 & Tier 3 Market Structure
- 6.1.3 Global, Regional & Local Player Dynamics
- 6.2 Cell Based Assay Market Share Analysis – 2025
- 6.2.1 Global Revenue Share by Company
- 6.2.2 Global Volume Share by Company
- 6.2.3 Regional Revenue Share
- 6.2.4 Market Share Evolution ( vs. 2025)
- 6.2.5 OEM Segment Share by Company
- 6.2.6 Replacement Segment Share by Company
- 6.3 Production/Delivery Capacity & Facility Analysis
- 6.3.1 Global Installed Capacity
- 6.3.2 Capacity Utilization Rates
- 6.3.3 Production/Output Volume
- 6.3.4 Facility Locations & Capacity Map
- 6.3.5 Planned Capacity Additions
- 6.4 Cell Based Assay Competitive Benchmarking Matrix
- 6.4.1 Revenue, Volume, CAGR & Profitability Comparison
- 6.4.2 Channel Revenue Mix
- 6.4.3 Geographic Revenue Exposure
- 6.4.4 R&D Intensity
- 6.4.5 Sustainability Maturity
- 6.5 Strategic Developments in Cell Based Assay (Last 24 Months)
- 6.5.1 Mergers, Acquisitions & Divestments
- 6.5.2 New Cell Based Assay Launches
- 6.5.3 Facility Expansions
- 6.5.4 Strategic Alliances, Joint Ventures & Partnerships
- 6.5.5 Distribution Expansion & Market Entry
- 6.5.6 Sustainability & ESG Initiatives
- 6.6 Competitive Strategy Mapping
- 6.6.1 Leader, Challenger, Follower & Niche Classification
- 6.6.2 Pricing Strategy Comparison
- 6.6.3 Channel Strategy Matrix
Note: Strategic developments are included based on their materiality and the availability of reliable information.
Chapter 7. Global Cell Based Assay Market – By Distribution Channel
- 7.1 Segment Overview
- 7.1.1 Volume & Revenue Split by Channel (2025 & 2032)
- 7.1.2 Channel Mix Evolution (2025-2032)
Chapter 8. Regional Market Analysis – Global Overview
- 8.1 Global Regional Overview
- 8.1.1 Regional Volume Share
- 8.1.2 Regional Revenue Share
- 8.1.3 Regional Volume by Region
- 8.1.4 Regional Revenue by Region
- 8.1.5 Regional Forecast Through 2032
- 8.2 Cross-Regional Segment Analysis
- 8.2.1 By Distribution Channel
- 8.2.2 By Brand/Price Tier
Chapter 9. North America Cell Based Assay Market
- 9.1 United States
- 9.2 Canada
- 9.3 Mexico
Chapter 10. Europe Cell Based Assay Market
- 10.1 Germany
- 10.2 France
- 10.3 Italy
- 10.4 United Kingdom
- 10.5 Spain
- 10.6 Poland
- 10.7 Russia
- 10.8 Netherlands
- 10.9 Belgium
- 10.10 Sweden
- 10.11 Denmark
- 10.12 Norway
- 10.13 Rest of Europe
Chapter 11. Asia Pacific Cell Based Assay Market
- 11.1 China
- 11.2 India
- 11.3 Japan
- 11.4 South Korea
- 11.5 Thailand
- 11.6 Indonesia
- 11.7 Vietnam
- 11.8 Malaysia
- 11.9 Australia
- 11.10 Rest of Asia Pacific
Chapter 12. Latin America Cell Based Assay Market
- 12.1 Brazil
- 12.2 Argentina
- 12.3 Colombia
- 12.4 Chile
- 12.5 Rest of Latin America
Chapter 13. Middle East Cell Based Assay Market
- 13.1 Saudi Arabia
- 13.2 United Arab Emirates
- 13.3 Turkey
- 13.4 Israel
- 13.5 Iran
- 13.6 Rest of the Middle East
Chapter 14. Africa Cell Based Assay Market
- 14.1 South Africa
- 14.2 Egypt
- 14.3 Nigeria
- 14.4 Morocco
- 14.5 Rest of Africa
Chapter 15. Cell Based Assay Company Profiles
- 15.1 [Company 01]
- 15.1.1 Company Overview
- 15.1.2 Key Management Personnel
- 15.1.3 Products & Services Portfolio
- 15.1.4 Financial Performance
- 15.1.5 Key Market Focus & Geographic Presence
- 15.1.6 Recent Developments & Strategic Initiatives
Note: The company profile list is preliminary and may change based on research findings, market developments, data availability, and client requirements.
Chapter 16. Appendices
- Appendix A – List of Abbreviations & Acronyms
- Appendix B – Industry Classification Code Reference – Full Series
- Appendix C – Production & Capacity Data Tables
- Appendix D – End-Use & Demand Base Tables
- Appendix E – Consumption & Replacement Rate Assumptions
- Appendix F – ASP Reference Tables
- Appendix G – Manufacturing & Facility Database
- Appendix H – Import-Export Data Tables
- Appendix I – Regulatory Summary Tables
- Appendix J – Primary Research Participant List (Anonymized)
- Appendix K – Primary Research Questionnaire Framework
- Appendix L – Data Sources & Bibliography
- Appendix M – Market Size Divergence & Source Comparison
Chapter 17. Research Methodology
- 17.1 Research Framework & Philosophy
- 17.2 Secondary Research – Sources, Hierarchy & Data Extraction
- 17.3 Data Modeling – Bottom-Up & Top-Down Market Sizing
- 17.4 Primary Research – Stakeholder Framework, LOI & Sample Sizes
- 17.5 Forecast Methodology – Regression, Scenario & Sensitivity Analysis
- 17.6 Quality Control – Four-Layer Validation Framework
- 17.7 Limitations & Standard Assumptions
- 17.8 Disclaimer
