
Center Pivot Irrigation System Market Overview:
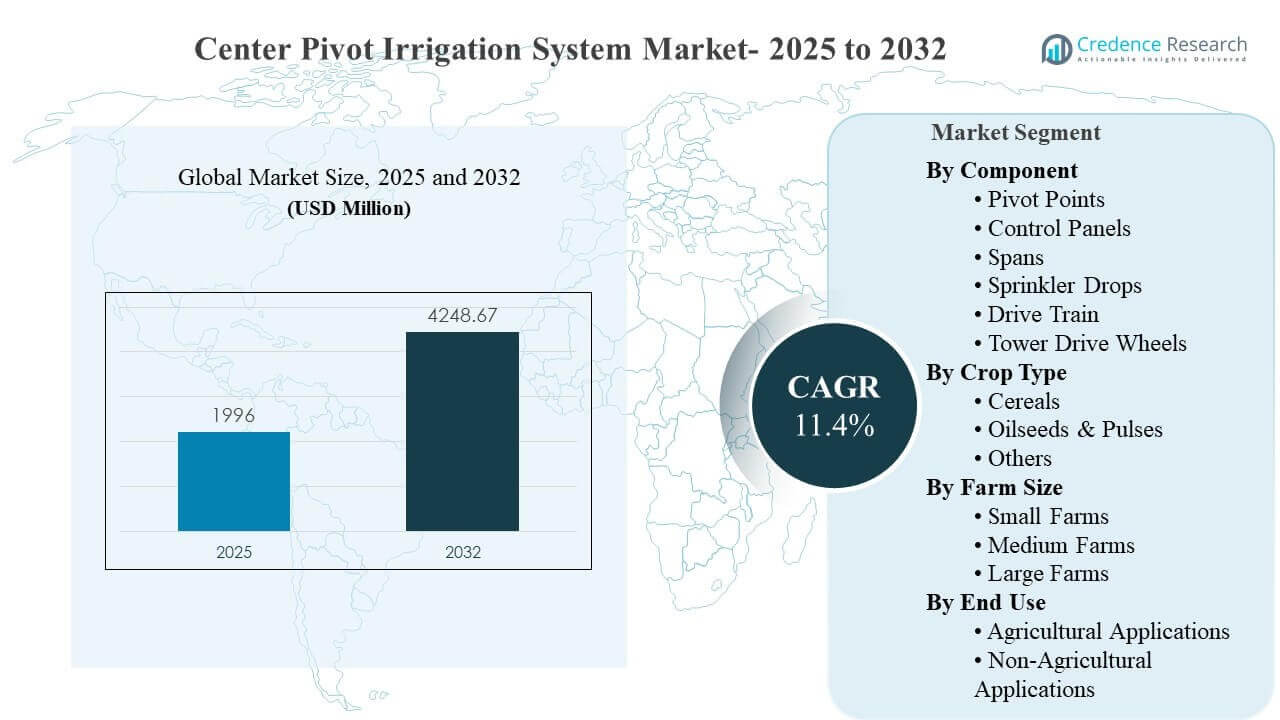
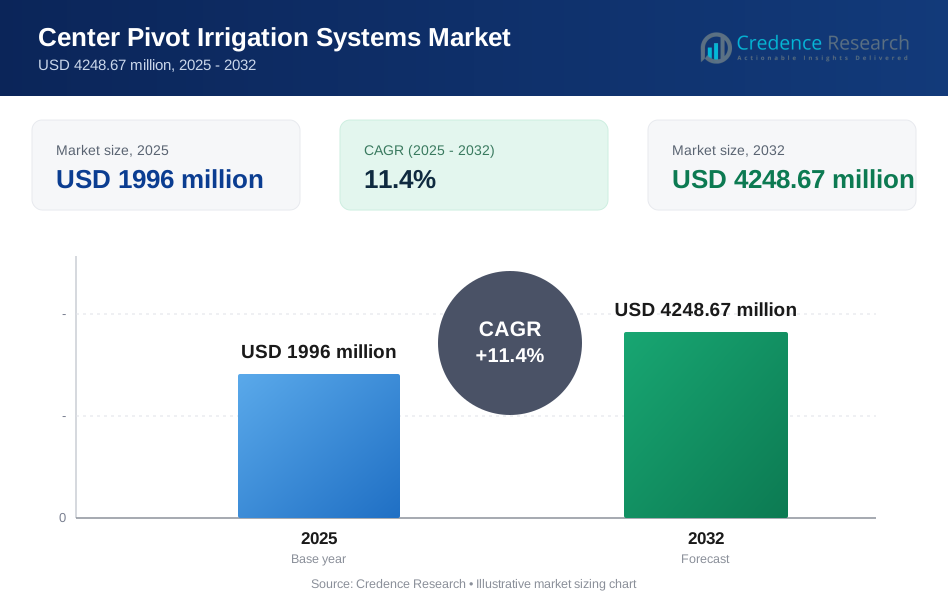
The global Center Pivot Irrigation System Market size was estimated at USD 1996 million in 2025 and is expected to reach USD 4248.67 million by 2032, growing at a CAGR of 11.4% from 2025 to 2032. Growth momentum is driven by the need to improve water-use efficiency and achieve uniform application across large fields as producers respond to rising climate variability and tighter water constraints. Adoption is also supported by increasing deployment of connected controls that reduce labor intensity, improve irrigation scheduling discipline, and strengthen repeatability in day-to-day farm operations across major irrigated regions.
| REPORT ATTRIBUTE | DETAILS |
|---|---|
| Historical Period | 2020-2024 |
| Base Year | 2025 |
| Forecast Period | 2026-2032 |
| Center Pivot Irrigation System Market Size 2025 | USD 1996 million |
| Center Pivot Irrigation System Market, CAGR | 11.4% |
| Center Pivot Irrigation System Market Size 2032 | USD 4248.67 million |
Key Market Trends & Insights
- The Center Pivot Irrigation System Market expands from USD 1996 million (2025) to USD 4248.67 million (2032), reflecting 11.4% CAGR (2025–2032).
- North America accounted for 34.2% (2025), supported by large-scale mechanized farming and strong service/dealer coverage.
- Asia Pacific represented 28.7% (2025), reflecting accelerating mechanization and higher irrigation modernization intensity across key agribusiness belts.
- Spans held 31.0% (2025) within components, indicating a strong upgrade and replacement cycle tied to coverage needs and structural reliability.
- Cereals captured 39.0% (2025), reflecting staple crop acreage intensity and high sensitivity of cereal yields to irrigation uniformity and timing.
Segment Analysis
Center Pivot Irrigation System Market demand increasingly aligns with operational simplicity and measurable water productivity outcomes. Remote monitoring and automation features reduce the number of field visits required to manage irrigation windows, improving the ability to respond to weather variability and crop stage requirements. Subscription-style advisory and decision-support tools strengthen scheduling discipline and enable more consistent irrigation practices across distributed fields. These factors support broader adoption among farms that need predictable results and limited downtime.
Center Pivot Irrigation System Market purchasing behavior continues to shift toward total-cost-of-ownership evaluation rather than equipment-only price comparisons. Buyers emphasize uptime, local service response, availability of spare parts, and ease of integrating controllers with on-farm management systems. Component replacement cycles and upgrades remain relevant because long-life mechanical assets still require periodic modernization of controls, drive assemblies, and water application hardware. This mix of durability and digital capability strengthens differentiation among leading suppliers.
By Component Insights
Spans accounted for the largest share of 31.0% in 2025. Span dominance reflects the role of span structures in determining irrigated reach, field coverage economics, and system reliability under variable terrain and wind loads. Large contiguous fields favor longer and more robust spans because fewer interruptions improve operational efficiency. Replacement demand also supports span share because structural wear, alignment issues, and modernization projects directly affect uptime and water distribution consistency.
By Crop Type Insights
Cereals accounted for the largest share of 39.0% in 2025. Cereal acreage remains a core driver of mechanized irrigation because staple crops require consistent water timing to stabilize yields across wide planting areas. Uniform application from pivot systems supports predictable crop development and reduces stress during critical growth stages. Irrigation modernization programs and water conservation initiatives further reinforce cereal-linked demand by promoting technologies that deliver measurable water productivity gains.
By Farm Size Insights
Medium Farms accounted for the largest share of 43.0% in 2025. Medium-farm leadership reflects the balance between affordability and scale, where farms can justify mechanized irrigation without the full cost profile of the largest installations. Medium operations often prioritize reliability and ease of use, creating strong uptake for standardized pivot configurations. Connectivity features and automation also improve manageability across multiple fields, strengthening medium-farm adoption where staffing constraints and monitoring needs remain persistent.
By End Use Insights
Agricultural Applications represent the primary demand base because center pivot systems are designed around crop irrigation requirements, yield stability targets, and field-scale water management needs. Agricultural Applications benefit from measurable productivity outcomes tied to uniformity, scheduling discipline, and reduced labor intensity. Non-Agricultural Applications remain relevant in select use cases such as turf, landscaping, and institutional water management, but adoption typically depends on site-specific economics and procurement cycles rather than seasonal crop performance drivers.
Center Pivot Irrigation System Market Drivers
Rising Need For Water-Efficient Irrigation At Field Scale
Center Pivot Irrigation System Market growth is reinforced by increasing pressure to reduce water waste and improve application uniformity across large fields. Producers face more frequent rainfall variability and higher irrigation scheduling complexity, raising the value of mechanized systems that deliver repeatable performance. Modern pivot designs reduce runoff risk and support better infiltration alignment with crop needs. Water-use efficiency requirements also drive upgrades of older systems through improved sprinklers and pressure regulation. These factors expand adoption across regions that prioritize agricultural water productivity.
- For instance, Hunter Industries’ Senninger i-Wob2 sprinkler is engineered to operate at 6 to 15 psi, with 10 psi recommended for optimum performance, and it carries a three-year warranty, giving growers a quantified upgrade option for lowering pressure demand while improving field-scale application performance.
Expansion Of Precision Agriculture And Connected Irrigation Control
Center Pivot Irrigation System Market demand strengthens as farms integrate connected controllers, remote monitoring, and data-driven scheduling into daily operations. Automation reduces labor intensity and improves response speed when weather conditions change. Digital platforms also improve traceability of irrigation decisions and support better coordination across multiple fields. Farms adopting sensors and advisory tools can align irrigation events with crop stage requirements more consistently. This operational benefit drives willingness to invest in upgrades of control panels and related electrical systems.
Mechanization In Large And Medium Farm Operations
Center Pivot Irrigation System Market adoption benefits from the scale economics of mechanization in medium and large farms. Larger field footprints increase the payback value of systems that reduce repetitive manual irrigation tasks. Mechanized irrigation also supports operational consistency when farm labor availability becomes constrained. Predictable water delivery improves yield stability, supporting investment confidence during volatile input cost cycles. Farm consolidation trends in several markets further increase the addressable base for pivot systems and retrofit solutions.
- For instance, Lindsay states that its Zimmatic 7500WD three-wheel mobile pivot can be towed in any direction and irrigate fields up to 160 acres (65 hectares), underscoring the labor-saving scale advantage of mechanized irrigation on medium-sized and dispersed field layouts.
Strong Replacement And Upgrade Cycles For Installed Base Systems
Center Pivot Irrigation System Market revenue is supported by ongoing replacement and upgrade cycles across the installed base. Structural components and drive assemblies require modernization to maintain reliability over multi-year operating conditions. Farms also adopt new sprinkler packages and pressure management solutions to improve uniformity and reduce energy costs. Control upgrades enable remote monitoring and reduce unplanned downtime through better diagnostics. These lifecycle dynamics support recurring demand beyond greenfield installations and reinforce component-level opportunities.
Center Pivot Irrigation System Market Challenges
Center Pivot Irrigation System Market expansion faces constraints from high upfront capital requirements and uneven access to affordable financing. Many farms evaluate payback periods conservatively when commodity prices fluctuate and input costs remain uncertain. Project delays can also occur when procurement cycles depend on seasonal cash flows rather than multi-year capex plans. Installation complexity increases in regions with irregular field geometry or limited infrastructure access. These barriers slow adoption among smaller farms and in markets with fragmented distribution coverage.
- For instance, Valley Irrigation’s Small Field Center Pivot is engineered for irregularly shaped fields up to 60 acres and includes optimized 5.8-meter (19.2-foot) and 8.7-meter (28.5-foot) overhang options to expand irrigated coverage in smaller or fragmented plots, underscoring how specialized system design can add configuration and installation complexity even as it improves field fit.
Center Pivot Irrigation System Market execution risk increases when water availability governance becomes uncertain or when permitting frameworks change. Regional restrictions on groundwater extraction and surface water allocations can reduce the confidence to invest in permanent irrigation infrastructure. Maintenance requirements also create operational risk where local service coverage is limited and spare parts lead times are long. Skilled labor for electrical and automation troubleshooting is not uniformly available across rural areas. These factors can raise downtime costs and reduce satisfaction among first-time adopters.
Market Trends and Opportunities
Center Pivot Irrigation System Market opportunities expand through digital services that convert equipment deployment into long-term performance management. Remote monitoring, scheduling advisory tools, and predictive maintenance features create recurring revenue potential and strengthen customer retention. Integration with farm management platforms also supports cross-field optimization, helping producers coordinate irrigation with fertilization and other agronomic decisions. Connected controls improve auditability and standardization of practices across farm operations. These trends increase demand for control panels and system upgrades across both new and existing installations.
- For instance, Lindsay reported that its FieldNET Advisor trial in north-central Nebraska, conducted on 132.6 harvested acres, delivered a 3% yield increase while using 17% less water, reducing irrigation use by 9.25 million gallons versus the control field.
Center Pivot Irrigation System Market growth is supported by solutions tailored to small or irregular fields and by retrofit packages that improve water application efficiency. Compact pivot configurations can open incremental adoption in regions where field shapes reduce the feasibility of traditional long-span systems. Retrofit sprinkler drops and pressure regulation kits also strengthen economics by reducing evaporation and improving uniformity. Project-led demand in water-stressed regions creates opportunities for bundled deployments paired with service contracts. These pathways broaden addressable demand beyond the traditional large-farm core.
Regional Insights
North America
Center Pivot Irrigation System Market leadership in North America reflects large field sizes, established mechanization, and strong service networks that support high system uptime. North America held 34.2% share in 2025, supported by replacement demand and continued upgrades to connected irrigation control. Many farm operators prioritize total cost of ownership, creating emphasis on reliability, parts availability, and dealer response time. Precision agriculture adoption also supports incremental demand for automation and decision-support integration. These factors sustain stable deployment across major irrigated crop belts.
Europe
Center Pivot Irrigation System Market activity in Europe is shaped by water efficiency regulation, sustainability targets, and modernization of irrigated farming systems. Europe accounted for 19.3% share in 2025, supported by upgrades where mechanized irrigation improves control and reduces water loss. Adoption patterns vary across countries depending on farm structure, irrigation infrastructure readiness, and local water governance. Demand often favors efficient sprinkler packages and control upgrades that align with compliance expectations. Competitive positioning also depends on service coverage and the ability to support multi-site operational requirements.
Asia Pacific
Center Pivot Irrigation System Market participation in Asia Pacific reflects accelerating mechanization and modernization across key agricultural production zones. Asia Pacific captured 28.7% share in 2025, supported by investment in efficient irrigation practices and rising emphasis on yield stability. Large-scale projects and modernization initiatives increase the addressable base for pivot systems in suitable field formats. Buyers increasingly value automation and remote monitoring to manage dispersed operations more effectively. These drivers support strong momentum for both new installations and modernization of existing equipment.
Latin America
Center Pivot Irrigation System Market demand in Latin America is supported by export-oriented agriculture and large farms in select countries. Latin America represented 10.6% share in 2025, reflecting meaningful adoption with uneven penetration across sub-regions. Deployment levels depend on infrastructure access, financing availability, and the stability of farm investment cycles. High-value crops and irrigated cereal systems support mechanized irrigation investment where water security is prioritized. Supplier differentiation frequently depends on service reliability, parts logistics, and the ability to support remote farming regions.
Middle East & Africa
Center Pivot Irrigation System Market growth in Middle East & Africa is influenced by water scarcity, food security programs, and project-led procurement. Middle East & Africa accounted for 7.2% share in 2025, reflecting concentrated demand in specific countries and commercial farming clusters. Large-scale installations often emphasize dependable performance under harsh operating conditions and strong maintenance support. Demand can rise through government-backed investment programs and private sector agribusiness expansion. The regional pipeline also benefits from bundled solutions that include remote management and structured service contracts.
Competitive Landscape
Center Pivot Irrigation System Market competition centers on durability, system uptime, and service delivery capability across distributed farming regions. Leading suppliers differentiate through dealer networks, spare parts availability, and lifecycle support for long-lived mechanical assets. Product portfolios increasingly combine hardware with connected controls, remote monitoring, and advisory functionality to improve scheduling discipline and operational consistency. Competitive intensity also increases around retrofit and modernization packages that protect customer relationships over multiple replacement cycles. Project execution capability and financing support can influence large deployment wins.
Valmont Industries maintains strong positioning through broad center pivot portfolios and a focus on performance-driven irrigation outcomes across large-scale operations. Valmont Industries benefits from an established global footprint and long operating history in mechanized irrigation. Valmont Industries also emphasizes connected device deployment and digital enablement to strengthen remote management and productivity measurement. Scale and distribution support enable faster response to maintenance needs and component replacement cycles. This positioning supports sustained competitiveness in regions that prioritize uptime and lifecycle economics.
The industry research and growth report includes detailed analyses of the competitive landscape of the market and information about key companies, including:
- Valmont Industries
- Lindsay Corporation
- T-L Irrigation Co.
- Reinke Manufacturing Co., Inc.
- Netafim
- Pierce Corporation
- Jain Irrigation Systems Ltd.
- Rivulis Irrigation
- Hunter Industries
- Rain Bird Corporation
- EPC Industries Limited (EPCO)
- Metzer
- OCMIS Irrigation
- Bauer GmbH
- Rainfine (Dalian) Irrigation Co., Ltd.
- Alkhorayef Group
- Grupo Fockink
Qualitative and quantitative analysis of companies has been conducted to help clients understand the wider business environment as well as the strengths and weaknesses of key industry players. Data is qualitatively analyzed to categorize companies as pure play, category-focused, industry-focused, and diversified; it is quantitatively analyzed to categorize companies as dominant, leading, strong, tentative, and weak.
Recent Developments
- In February 2026, Valley Irrigation, a Valmont company, launched the Valley Small Field Center Pivot, a purpose-built irrigation system for smaller and irregularly shaped fields, and said the product would be available starting in Q1 2026 through authorized dealers across North America.
- In November 2025, Reinke Manufacturing and CropX Technologies expanded their partnership by integrating CropX agronomic data into Reinke’s ReinCloud 3 platform, allowing farmers to access soil, weather, sensor, and irrigation information in one place, while Reinke also began offering a free CropX sensor with every new irrigation system.
- In January 2025, Lindsay Corporation completed the acquisition of a 49.9% minority interest in Austria-based Pessl Instruments, an advanced technology solutions provider, and retained the option to acquire the remaining shares at a later date.
Report Scope
| Report Attribute | Details |
| Market Size Value in 2025 | USD 1,996 million |
| Revenue Forecast in 2032 | USD 4,248.67 million |
| Growth Rate (CAGR) | 11.4% (2025–2032) |
| Base Year | 2025 |
| Forecast Period | 2026–2032 |
| Quantitative Units | USD million |
| Segments Covered | By Component Outlook: Pivot Points, Control Panels, Spans, Sprinkler Drops, Drive Train, Tower Drive Wheels; By Crop Type Outlook: Cereals, Oilseeds & Pulses, Others; By Farm Size Outlook: Small Farms, Medium Farms, Large Farms; By End Use Outlook: Agricultural Applications, Non-Agricultural Applications |
| Regional Scope | North America, Europe, Asia Pacific, Latin America, Middle East & Africa |
| Key Companies Profiled | Valmont Industries; Lindsay Corporation; T-L Irrigation Co.; Reinke Manufacturing Co., Inc.; Netafim; Pierce Corporation; Jain Irrigation Systems Ltd.; Rivulis Irrigation; Hunter Industries; Rain Bird Corporation; EPC Industries Limited (EPCO); Metzer; OCMIS Irrigation; Bauer GmbH; Rainfine (Dalian) Irrigation Co., Ltd.; Alkhorayef Group; Grupo Fockink |
| No. of Pages | 336 |
Segmentation
By Component
- Pivot Points
- Control Panels
- Spans
- Sprinkler Drops
- Drive Train
- Tower Drive Wheels
By Crop Type
- Cereals
- Oilseeds & Pulses
- Others
By Farm Size
- Small Farms
- Medium Farms
- Large Farms
By End Use
- Agricultural Applications
- Non-Agricultural Applications
By Region
- North America
- U.S.
- Canada
- Mexico
- Europe
- Germany
- France
- U.K.
- Italy
- Spain
- Rest of Europe
- Asia Pacific
- China
- Japan
- India
- South Korea
- South-east Asia
- Rest of Asia Pacific
- Latin America
- Brazil
- Argentina
- Rest of Latin America
- Middle East & Africa
- GCC Countries
- South Africa
- Rest of the Middle East and Africa
Request a Free Sample
Fill in your details and we'll send you a free sample report.
- Sample data tables & charts
- Research methodology
Need a Custom Version of This Report?
Tailor the scope, geography, or segments to your exact requirements.
- Custom geography or segment scope
- Direct access to our analyst team
Frequently Asked Questions
What is the market size of the Center Pivot Irrigation System Market in 2025 and 2032?
What is the CAGR for the Center Pivot Irrigation System Market during 2025–2032?
Which segment holds the largest share by component in 2025?
What factors are driving growth in the Center Pivot Irrigation System Market?
Who are the leading companies in the Center Pivot Irrigation System Market?
Which region leads the Center Pivot Irrigation System Market in 2025?
Table of Content
Chapter 1. Report Introduction
- 1.1 Report Description & Purpose
- 1.1.1 Report Title & Market Definition
- 1.1.2 Unique Selling Propositions (USP) & Key Differentiators
- 1.1.3 Value Proposition for Stakeholders
- 1.2 Research Objectives
- 1.2.1 Market Sizing Objectives (Volume & Revenue)
- 1.2.2 Segmentation Objectives
- 1.2.3 Competitive Intelligence Objectives
- 1.2.4 Forecast & Scenario Objectives
- 1.3 Report Scope
- 1.3.1 Center Pivot Irrigation Systems Scope – Types & Subtypes Covered
- 1.3.2 Geographic Scope – Regions & Countries Covered
- 1.3.3 Historical Period, Base Year & Forecast Period (2025; forecast to 2032)
- 1.3.4 Inclusions & Exclusions
- 1.4 HS Code & Classification Framework
- 1.5 Currency, Units & Pricing Basis
- 1.6 Target Stakeholders
- 1.7 Limitations & Assumptions
Chapter 2. Executive Summary
- 2.1 Global Center Pivot Irrigation Systems Market Snapshot
- 2.1.1 Market Size – Historical (2025) & Forecast (2025-2032) (2025: USD 1996 million → 2032: USD 4248.67 million)
- 2.1.2 Volume & Revenue – Global Totals
- 2.1.3 Key Market Highlights – Top Five Facts
- 2.2 Center Pivot Irrigation Systems Market Segmentation Snapshot
- 2.2.1 Market Split by Region – 2025 vs. 2032
- 2.3 Competitive Snapshot
- 2.3.1 Top 10 Players by Revenue Share – 2025
- 2.3.2 Top 10 Players by Volume Share – 2025
- 2.3.3 Recent Strategic Developments (18-Month Summary)
- 2.4 Key Investment Highlights & Strategic Conclusions
Chapter 3. Center Pivot Irrigation Systems Market Dynamics & Industry Analysis
- 3.1 Market Overview & Context
- 3.1.1 Center Pivot Irrigation Systems Market Position in the Broader Automotive Value Chain
- 3.1.2 OEM vs. Replacement Market Dynamics
- 3.1.3 Market Maturity & Development Stage by Region
- 3.2 Center Pivot Irrigation Systems Market Drivers
- 3.3 Center Pivot Irrigation Systems Market Restraints & Challenges
- 3.4 Center Pivot Irrigation Systems Market Opportunities
- 3.5 Porter's Five Forces Analysis
- 3.5.1 Threat of New Entrants
- 3.5.2 Bargaining Power of Suppliers
- 3.5.3 Bargaining Power of Buyers
- 3.5.4 Threat of Substitutes
- 3.5.5 Competitive Rivalry – Intensity Assessment
- 3.6 Center Pivot Irrigation Systems Value Chain Analysis
- 3.6.1 Upstream – Raw Material/Input Suppliers
- 3.6.1.1 Raw Material/Input 1
- 3.6.1.2 Raw Material/Input 2
- 3.6.1.3 Raw Material/Input 3
- 3.6.2 Midstream – Production/Manufacturing/Service Delivery
- 3.6.2.1 Production/Process Overview
- 3.6.2.2 Key Facility Locations & Capacity by Manufacturer
- 3.6.3 Downstream – Distribution & End Consumer
- 3.6.3.1 Primary Channel – B2B/OEM
- 3.6.3.2 Secondary Channels – Dealer, Retail, Online, Direct
- 3.6.4 Value Chain Profitability Analysis
- 3.6.1 Upstream – Raw Material/Input Suppliers
- 3.7 PESTEL Analysis
- 3.7.1 Political Factors
- 3.7.2 Economic Factors
- 3.7.3 Social Factors
- 3.7.4 Technological Factors
- 3.7.5 Environmental Factors
- 3.7.6 Legal Factors
- 3.8 Center Pivot Irrigation Systems Supply Chain Analysis
- 3.8.1 Raw Material/Input Supply Risk Assessment
- 3.8.2 Manufacturing Concentration Risk (Geographic Exposure)
- 3.8.3 Trade Disruption Impact Analysis
- 3.9 Regulatory & Policy Landscape
Note: The regulatory and policy landscape section covers regulations based on their applicability to the market, Center Pivot Irrigation Systems category, geography, and scope of the study. Only regulatory frameworks with a material impact on operations, compliance, trade, sustainability, or market access are analyzed in detail.
Chapter 4. Key Investment Pockets & Opportunity Analysis
- 4.1 Center Pivot Irrigation Systems Market Attractiveness Analysis
- 4.1.1 By Region – Investment Attractiveness Matrix (Volume × CAGR)
- 4.2 Absolute Revenue Growth Opportunity
- 4.2.1 By Region – Absolute USD Growth Through 2032
- 4.3 Incremental Volume Opportunity
- 4.3.1 By Region – Incremental Volume Through 2032
- 4.3.2 Segment – Incremental Volume
- 4.4 Emerging Submarket Opportunity Deep Dive (Subject to Applicability)
- 4.5 Emerging Market Opportunity Scorecards
- 4.5.1 United States
- 4.5.2 Europe
- 4.5.3 Asia
- 4.5.4 Middle East & Africa
Note: Emerging Market Opportunity Scorecards will be included based on relevance and strategic importance. Regions listed are indicative and may vary depending on data availability and market dynamics.
Chapter 5. Center Pivot Irrigation Systems Import-Export Analysis & Trade Flows
- 5.1 Global Trade Overview
- 5.1.1 Global Export Value by Country (2025)
- 5.1.2 Global Export Volume by Country (2025)
- 5.1.3 Global Import Value by Country (2025)
- 5.1.4 Global Import Volume by Country (2025)
- 5.1.5 Net Trade Balance by Country (2025)
- 5.2 Export Analysis – Segment
- 5.2.1 Type 1 (HS Code)
- 5.2.2 Type 2 (HS Code)
- 5.2.3 Type 3 (HS Code)
- 5.2.4 Type 4 (HS Code)
- 5.2.5 Type 5 (HS Code)
- 5.3 Import Analysis – Segment
- 5.3.1 Type 1 (HS Code)
- 5.3.2 Type 2 (HS Code)
- 5.3.3 Type 3 (HS Code)
- 5.3.4 Type 4 (HS Code)
- 5.3.5 Type 5 (HS Code)
- 5.4 Average Unit Trade Prices
- 5.4.1 Average Export Price – Segment & Country
- 5.4.2 Average Import Price – Segment & Source Country
- 5.4.3 Price Trends (2025)
- 5.5 Key Trade Route Analysis
- 5.5.1 Trade Route 1
- 5.5.2 Trade Route 2
- 5.5.3 Trade Route 3
- 5.5.4 Trade Route 4
- 5.5.5 Trade Route 5
- 5.6 Trade Policy Impact Assessment
- 5.6.1 US Anti-Dumping & Section 301 Tariffs
- 5.6.2 EU Customs Union Impact
- 5.6.3 Major Free Trade Agreements
- 5.6.4 USMCA Rules of Origin
Note: Trade policy analysis will be included only where relevant to the Center Pivot Irrigation Systems market.
Chapter 6. Competitive Landscape & Company Benchmarking
- 6.1 Center Pivot Irrigation Systems Market Concentration & Structure
- 6.1.1 Herfindahl-Hirschman Index (HHI) – vs. 2025
- 6.1.2 Tier 1, Tier 2 & Tier 3 Market Structure
- 6.1.3 Global, Regional & Local Player Dynamics
- 6.2 Center Pivot Irrigation Systems Market Share Analysis – 2025
- 6.2.1 Global Revenue Share by Company
- 6.2.2 Global Volume Share by Company
- 6.2.3 Regional Revenue Share
- 6.2.4 Market Share Evolution ( vs. 2025)
- 6.2.5 OEM Segment Share by Company
- 6.2.6 Replacement Segment Share by Company
- 6.3 Production/Delivery Capacity & Facility Analysis
- 6.3.1 Global Installed Capacity
- 6.3.2 Capacity Utilization Rates
- 6.3.3 Production/Output Volume
- 6.3.4 Facility Locations & Capacity Map
- 6.3.5 Planned Capacity Additions
- 6.4 Center Pivot Irrigation Systems Competitive Benchmarking Matrix
- 6.4.1 Revenue, Volume, CAGR & Profitability Comparison
- 6.4.2 Channel Revenue Mix
- 6.4.3 Geographic Revenue Exposure
- 6.4.4 R&D Intensity
- 6.4.5 Sustainability Maturity
- 6.5 Strategic Developments in Center Pivot Irrigation Systems (Last 24 Months)
- 6.5.1 Mergers, Acquisitions & Divestments
- 6.5.2 New Center Pivot Irrigation Systems Launches
- 6.5.3 Facility Expansions
- 6.5.4 Strategic Alliances, Joint Ventures & Partnerships
- 6.5.5 Distribution Expansion & Market Entry
- 6.5.6 Sustainability & ESG Initiatives
- 6.6 Competitive Strategy Mapping
- 6.6.1 Leader, Challenger, Follower & Niche Classification
- 6.6.2 Pricing Strategy Comparison
- 6.6.3 Channel Strategy Matrix
Note: Strategic developments are included based on their materiality and the availability of reliable information.
Chapter 7. Global Center Pivot Irrigation Systems Market – By Distribution Channel
- 7.1 Segment Overview
- 7.1.1 Volume & Revenue Split by Channel (2025 & 2032)
- 7.1.2 Channel Mix Evolution (2025-2032)
Chapter 8. Regional Market Analysis – Global Overview
- 8.1 Global Regional Overview
- 8.1.1 Regional Volume Share
- 8.1.2 Regional Revenue Share
- 8.1.3 Regional Volume by Region
- 8.1.4 Regional Revenue by Region
- 8.1.5 Regional Forecast Through 2032
- 8.2 Cross-Regional Segment Analysis
- 8.2.1 By Distribution Channel
- 8.2.2 By Brand/Price Tier
Chapter 9. North America Center Pivot Irrigation Systems Market
- 9.1 United States
- 9.2 Canada
- 9.3 Mexico
Chapter 10. Europe Center Pivot Irrigation Systems Market
- 10.1 Germany
- 10.2 France
- 10.3 Italy
- 10.4 United Kingdom
- 10.5 Spain
- 10.6 Poland
- 10.7 Russia
- 10.8 Netherlands
- 10.9 Belgium
- 10.10 Sweden
- 10.11 Denmark
- 10.12 Norway
- 10.13 Rest of Europe
Chapter 11. Asia Pacific Center Pivot Irrigation Systems Market
- 11.1 China
- 11.2 India
- 11.3 Japan
- 11.4 South Korea
- 11.5 Thailand
- 11.6 Indonesia
- 11.7 Vietnam
- 11.8 Malaysia
- 11.9 Australia
- 11.10 Rest of Asia Pacific
Chapter 12. Latin America Center Pivot Irrigation Systems Market
- 12.1 Brazil
- 12.2 Argentina
- 12.3 Colombia
- 12.4 Chile
- 12.5 Rest of Latin America
Chapter 13. Middle East Center Pivot Irrigation Systems Market
- 13.1 Saudi Arabia
- 13.2 United Arab Emirates
- 13.3 Turkey
- 13.4 Israel
- 13.5 Iran
- 13.6 Rest of the Middle East
Chapter 14. Africa Center Pivot Irrigation Systems Market
- 14.1 South Africa
- 14.2 Egypt
- 14.3 Nigeria
- 14.4 Morocco
- 14.5 Rest of Africa
Chapter 15. Center Pivot Irrigation Systems Company Profiles
- 15.1 [Company 01]
- 15.1.1 Company Overview
- 15.1.2 Key Management Personnel
- 15.1.3 Products & Services Portfolio
- 15.1.4 Financial Performance
- 15.1.5 Key Market Focus & Geographic Presence
- 15.1.6 Recent Developments & Strategic Initiatives
Note: The company profile list is preliminary and may change based on research findings, market developments, data availability, and client requirements.
Chapter 16. Appendices
- Appendix A – List of Abbreviations & Acronyms
- Appendix B – Industry Classification Code Reference – Full Series
- Appendix C – Production & Capacity Data Tables
- Appendix D – End-Use & Demand Base Tables
- Appendix E – Consumption & Replacement Rate Assumptions
- Appendix F – ASP Reference Tables
- Appendix G – Manufacturing & Facility Database
- Appendix H – Import-Export Data Tables
- Appendix I – Regulatory Summary Tables
- Appendix J – Primary Research Participant List (Anonymized)
- Appendix K – Primary Research Questionnaire Framework
- Appendix L – Data Sources & Bibliography
- Appendix M – Market Size Divergence & Source Comparison
Chapter 17. Research Methodology
- 17.1 Research Framework & Philosophy
- 17.2 Secondary Research – Sources, Hierarchy & Data Extraction
- 17.3 Data Modeling – Bottom-Up & Top-Down Market Sizing
- 17.4 Primary Research – Stakeholder Framework, LOI & Sample Sizes
- 17.5 Forecast Methodology – Regression, Scenario & Sensitivity Analysis
- 17.6 Quality Control – Four-Layer Validation Framework
- 17.7 Limitations & Standard Assumptions
- 17.8 Disclaimer
