Market Overview
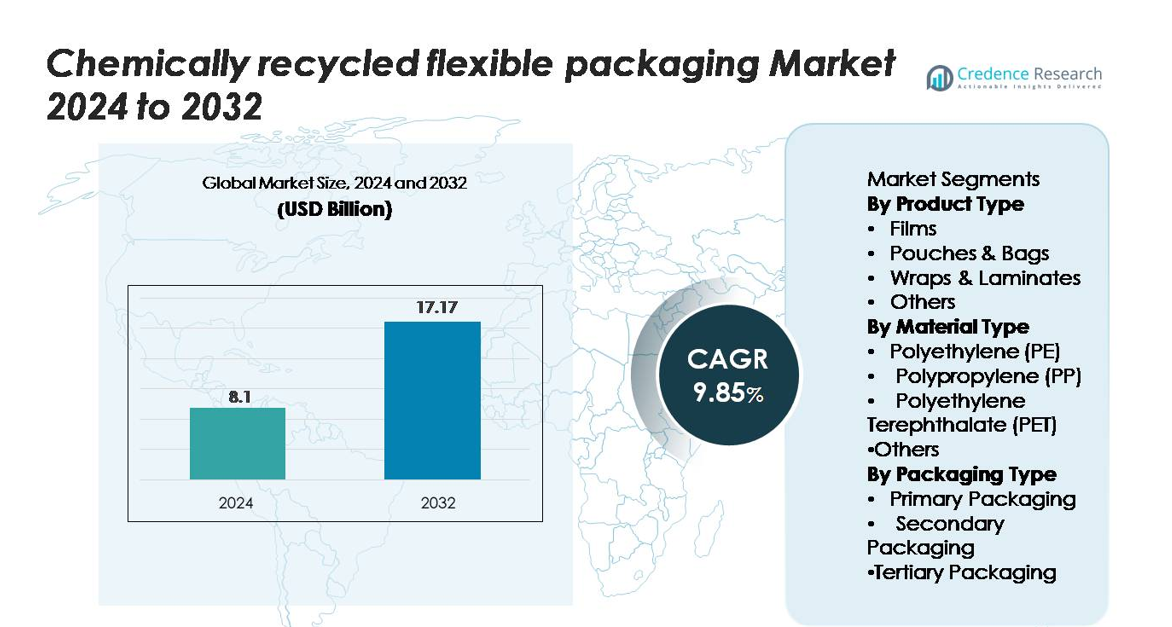
The chemically recycled flexible packaging market was valued at USD 8.1 billion in 2024 and is projected to reach USD 17.17 billion by 2032, advancing at a CAGR of 9.85% during the forecast period.
| REPORT ATTRIBUTE |
DETAILS |
| Historical Period |
2020-2023 |
| Base Year |
2024 |
| Forecast Period |
2025-2032 |
| Chemically Recycled Flexible Packaging Market Size 2024 |
USD 8.1 billion |
| Chemically Recycled Flexible Packaging Market, CAGR |
9.85% |
| Chemically Recycled Flexible Packaging Market Size 2032 |
USD 17.17 billion |
The chemically recycled flexible packaging market is shaped by leading participants such as BASF SE, SABIC, Eastman Chemical Company, Dow Inc., ExxonMobil Chemical, and LyondellBasell Industries, each advancing high-purity recycled polymers through large-scale depolymerization and pyrolysis technologies. These companies collaborate with global FMCG and packaging converters to supply food-grade PE, PP, and PET for films, pouches, and high-barrier laminates. North America leads the market with 34% share, driven by strong regulatory support and rapid expansion of advanced recycling facilities, followed closely by Europe at 31%, supported by stringent circular economy mandates and mature waste-collection systems.
Market Insights
- The chemically recycled flexible packaging market was valued at USD 8.1 billion in 2024 and is projected to reach USD 17.17 billion by 2032, expanding at a CAGR of 9.85%.
- Market growth is driven by rising demand for circular packaging, strong brand commitments to recycled content, and advancements in chemical recycling that enable recovery of complex multi-layer films and pouches.
- Key trends include rapid expansion of depolymerization and pyrolysis capacity, increasing adoption of food-grade recycled PE, PP, and PET, and growing partnerships between recyclers, converters, and global FMCG brands.
- Competition is shaped by major players such as BASF SE, SABIC, Eastman, Dow, ExxonMobil, and LyondellBasell, each strengthening capabilities in high-purity recycled polymers; films remain the dominant segment with the highest adoption.
- Regionally, North America holds 34%, followed by Europe at 31% and Asia-Pacific at 25%, reflecting strong regulatory support, large consumer markets, and increasing circular infrastructure investments.
Access crucial information at unmatched prices!
Request your sample report today & start making informed decisions powered by Credence Research Inc.!
Download Sample
Market Segmentation Analysis:
By Product Type
Films represent the dominant product segment, capturing around 42% of the market, owing to their broad adoption in food, personal care, and industrial packaging that demands high clarity, durability, and recyclability. Chemically recycled films benefit from enhanced mechanical strength and suitability for high-barrier applications. Pouches & bags follow closely as brands shift toward lightweight formats to reduce material usage. Meanwhile, wraps and laminates gain traction for multi-layer applications where chemical recycling enables recovery of complex structures previously unsuitable for mechanical processes.
- For instance, Eastman’s Kingsport chemical recycling facility, which achieved initial production at scale in March 2024, has the capacity to process 110,000 metric tons of hard-to-recycle polyester waste annually, enabling consistent output of chemically recycled polyester suitable for high-performance film applications.
By Material Type
Polyethylene (PE) leads the material landscape with approximately 48% share, supported by its extensive use in films, bags, and flexible liners. PE’s chemical recyclability allows the production of near-virgin-grade resins ideal for food-grade packaging, driving strong adoption among FMCG and retail brands. Polypropylene (PP) emerges as a fast-growing material due to rising demand for high-heat-resistant and rigid-flexible hybrid structures. Meanwhile, PET remains essential for high-clarity applications, benefiting from advanced depolymerization technologies that improve yield and quality in flexible packaging formats.
- For instance, SABIC’s chemical recycling unit in Geleen produces up to 20,000 metric tons of certified circular PP each year, enabling production of thermo-resistant flexible packaging with heat distortion temperatures reaching 120°C.
By Packaging Type
Primary packaging dominates the segment with a market share of about 55%, driven by the increasing preference for consumer-facing formats that require safety, freshness, and regulatory compliance. Chemically recycled materials are increasingly adopted for direct-contact packaging in food, cosmetics, and pharmaceuticals due to their ability to meet strict purity standards. Secondary packaging shows steady growth as e-commerce expands and brands seek sustainable cushioning, wraps, and liners. Tertiary packaging adoption rises gradually as industries integrate recycled materials into pallets, stretch wraps, and bulk shipment films.
Key Growth Drivers
Rising Demand for Circular and Low-Carbon Packaging Solutions
The shift toward circular economy models significantly accelerates the adoption of chemically recycled flexible packaging. Governments, global brands, and retailers increasingly commit to sustainability targets that require integrating high-quality recycled content into packaging. Chemical recycling plays a pivotal role by converting hard-to-recycle multi-layer films, pouches, and laminates into near-virgin polymers suitable for premium applications. This capability addresses limitations of mechanical recycling and expands the usable feedstock pool. Furthermore, consumer preference for eco-friendly packaging strengthens demand, particularly in food, beverage, personal care, and healthcare sectors. With carbon reduction mandates tightening globally, companies prioritize chemically recycled inputs to meet regulatory compliance and carbon reporting requirements. The ability of chemical recycling to consistently deliver food-grade, high-purity materials positions it as a mainstream solution driving market expansion.
- For instance, Loop Industries’ depolymerization technology achieves monomer purity exceeding 99% from PET waste streams, supporting high-clarity flexible packaging for global consumer brands.
Technological Advancements Enhancing Polymer Recovery Efficiency
Rapid advancements in depolymerization, pyrolysis, solvent-based purification, and catalyst engineering are significantly improving output quality and yield in chemically recycled flexible packaging. New process innovations allow efficient breakdown and recovery of complex structures such as multi-layer barrier films and high-performance laminates that were previously unsuitable for recycling. These improvements enhance material purity, enabling production of recycled PE, PP, and PET that meet stringent regulatory standards for direct food contact applications. Additionally, the integration of AI-enabled feedstock sorting, advanced filtration systems, and closed-loop purification enhances process consistency and reduces production costs. As global chemical producers and packaging companies expand pilot plants and scale commercial facilities, technological refinement accelerates commercial viability, boosts supply availability, and widens end-user adoption across FMCG, pharmaceuticals, and e-commerce distribution.
- For instance, Eastman’s polyester renewal technology achieves depolymerization efficiencies above 93%, producing high-purity PET suitable for food-grade applications at a capacity of 110,000 metric tons per year.
Global Brand Commitments Driving Demand for Recycled Content Packaging
Large FMCG, beverage, and pharmaceutical companies increasingly commit to using higher recycled content in packaging as part of ESG and sustainability roadmaps. These commitments create strong market pull for chemically recycled materials, especially where purity and performance requirements exceed the capabilities of mechanically recycled plastics. Brands prefer chemically recycled flexible packaging because it ensures material safety, odor neutrality, and high clarity—qualities needed for premium consumer-facing products. In addition, multinational companies partner with petrochemical firms and recyclers to establish long-term supply agreements, accelerating market stability and capacity expansion. Retail chains and e-commerce companies add further momentum by mandating recycled-content packaging for private-label goods. As brands integrate circular packaging policies into procurement frameworks, chemically recycled flexible packaging becomes a critical enabler for achieving sustainability certifications, regulatory compliance, and brand differentiation.
Key Trends & Opportunities
Rapid Expansion of Advanced Recycling Infrastructure and Partnerships
One of the strongest trends in the market is the growing investment in advanced recycling infrastructure through joint ventures, consortiums, and public–private partnerships. Chemical manufacturers, waste management companies, and global packaging brands collaborate to scale recycling networks, enabling stable feedstock supply and expanding collection systems for flexible plastics. These partnerships support regional circularity hubs that convert post-consumer flexible plastics into high-quality polymers. Innovations in decentralized recycling units, modular pyrolysis systems, and circular resin certification frameworks offer new opportunities for localizing production. Governments further incentivize this trend through subsidies for recycling plants, tax credits, and mandates for recycled content use. As partnerships deepen across the value chain, stakeholders gain opportunities to secure long-term supply, reduce operational costs, and accelerate deployment of chemically recycled materials across consumer goods, industrial packaging, and logistics sectors.
- For instance, Cyclyx—a consortium formed by Agilyx, ExxonMobil, and LyondellBasell—is developing a feedstock management network to eventually process 300,000 metric tons of waste plastic annually through its two planned Circularity Centers in North America, with the first center expected to begin operations in mid-2025.
Growing Shift Toward High-Performance and Food-Grade Recycled Materials
A major opportunity lies in the rising demand for food-grade and high-performance chemically recycled materials. As regulators tighten safety standards and restrict virgin plastic use for certain applications, companies increasingly adopt chemically recycled PE, PP, and PET that meet purity requirements for direct food contact. Advanced chemical recycling methods enable removal of contaminants and odor compounds, making them suitable for high-barrier films, pouches, and multilayer laminates. This capability unlocks opportunities in frozen foods, snacks, pharmaceuticals, and nutraceuticals—segments where packaging performance and safety are non-negotiable. Converters capitalize on this trend by expanding production lines for premium recycled resins, while brands differentiate themselves by offering certified circular products. The ongoing expansion of certification programs, including mass balance and full traceability systems, further strengthens opportunities for high-purity recycled content integration.
- For instance, BASF’s mass balance certification framework covers more than 400 chemically recycled products across its portfolio, with audited traceability that enables converters to incorporate certified circular PE and PP into food-grade flexible packaging.
Key Challenges
High Operational Costs and Limited Commercial-Scale Availability
Despite rapid advancements, chemical recycling faces significant challenges related to high capital expenditure, costly feedstock preparation, and energy-intensive processes. Building commercial-scale facilities requires substantial investment, and ongoing operational costs often exceed those of mechanical recycling. Limited availability of high-quality, sorted flexible plastic waste also constrains production capacity. As a result, supply-demand imbalances lead to pricing volatility for chemically recycled resins, creating adoption barriers for small and midsize converters. While mass balance certification helps expand market penetration, scaling infrastructure remains slow due to lengthy regulatory approvals and complex technical integration. Overcoming cost inefficiencies is crucial for expanding chemically recycled flexible packaging’s long-term market presence.
Regulatory Complexity and Standardization Gaps Across Regions
The industry faces challenges due to inconsistent regulatory frameworks governing advanced recycling, food-contact approvals, and recycled-content certifications across regions. Variations in mass balance rules, definitions of chemical recycling processes, and labeling requirements create compliance burdens for manufacturers and brand owners. Some regions lack clear guidelines for classifying chemical recycling as recycling rather than energy recovery, delaying project approvals. Additionally, differences in safety standards for food-grade recycled plastics hinder smooth cross-border trade. These regulatory gaps complicate investment decisions and slow adoption rates. Building harmonized standards, transparent certification systems, and unified definitions is critical to ensuring industry scalability and fostering global market confidence.
Regional Analysis
North America
North America holds approximately 34% of the market, driven by strong regulatory support for circular plastics, expansion of advanced recycling facilities, and early adoption by major FMCG and retail brands. The U.S. leads regional growth with rising investment in depolymerization and pyrolysis technologies that enable high-purity recycled PE, PP, and PET. Corporate sustainability commitments from packaging converters and multinational brands further accelerate demand. Canada strengthens market momentum through national plastic waste reduction mandates and extended producer responsibility frameworks. Growing consumer preference for low-carbon, recycled-content packaging reinforces the region’s leadership.
Europe
Europe accounts for nearly 31% of the market, supported by stringent EU regulations, recycled-content mandates, and rapid deployment of chemical recycling capacity across Germany, the Netherlands, and the U.K. The region benefits from strong policy alignment under the Circular Economy Action Plan and Packaging & Packaging Waste Regulation, which fuels investment in advanced recycling plants. Brands adopt chemically recycled flexible packaging to meet EPR requirements and reduce reliance on virgin plastics. High consumer awareness and well-developed waste collection systems further strengthen adoption across food, beverage, and personal care sectors.
Asia-Pacific
Asia-Pacific captures around 25% of the market, driven by expanding manufacturing bases, rapid urbanization, and rising commitments from regional packaging and petrochemical producers to incorporate circular materials. China, Japan, South Korea, and India increasingly invest in chemical recycling technologies to address large volumes of flexible plastic waste. The region’s robust e-commerce and FMCG industries accelerate demand for high-performance recycled films and pouches. Government initiatives promoting low-carbon manufacturing and improved waste management systems support market expansion. Partnerships between global brands and local recyclers further enhance supply chain integration.
Latin America
Latin America holds approximately 6% of the market, with growth concentrated in Brazil, Mexico, and Chile, where sustainability regulations and corporate packaging commitments are expanding. Adoption rises as food and beverage producers seek circular solutions that meet multinational supply chain standards. Investments in pilot-scale chemical recycling plants improve access to recycled PE and PP suitable for flexible packaging. However, limited waste segregation infrastructure restricts large-scale feedstock availability. Despite these challenges, increasing retailer pressure for eco-friendly packaging and government interest in plastic waste reduction policies support steady regional development.
Middle East & Africa
The Middle East & Africa region accounts for roughly 4% of the market, with momentum driven by emerging circular economy initiatives and growing investments from petrochemical giants in advanced recycling technologies. The UAE and Saudi Arabia lead regional development through national sustainability agendas and industrial partnerships focused on converting flexible waste into high-quality polymers. Adoption grows in food, agricultural, and industrial packaging applications as companies seek premium recycled materials. However, inconsistent waste management systems and limited large-scale recycling infrastructure constrain growth. Increasing multinational presence and regulatory modernization create long-term opportunities.
Market Segmentations:
By Product Type
- Films
- Pouches & Bags
- Wraps & Laminates
- Others
By Material Type
- Polyethylene (PE)
- Polypropylene (PP)
- Polyethylene Terephthalate (PET)
- Others
By Packaging Type
- Primary Packaging
- Secondary Packaging
- Tertiary Packaging
By Geography
- North America
- Europe
- Germany
- France
- U.K.
- Italy
- Spain
- Rest of Europe
- Asia Pacific
- China
- Japan
- India
- South Korea
- South-east Asia
- Rest of Asia Pacific
- Latin America
- Brazil
- Argentina
- Rest of Latin America
- Middle East & Africa
- GCC Countries
- South Africa
- Rest of the Middle East and Africa
Competitive Landscape
The competitive landscape of the chemically recycled flexible packaging market is defined by a growing ecosystem of global chemical producers, packaging converters, and advanced recycling technology providers working to scale high-purity recycled polymers for flexible applications. Leading companies—including BASF SE, SABIC, Eastman, Dow, ExxonMobil, and LyondellBasell—continue to expand their recycling networks through depolymerization, pyrolysis, and solvent-based purification technologies capable of processing complex multi-layer structures. These players invest heavily in integrated value-chain partnerships with FMCG brands, waste management companies, and logistics providers to secure consistent feedstock supply and ensure mass-balance certified resin availability. Start-ups and specialized recyclers further intensify competition by commercializing modular and low-energy recycling systems targeting hard-to-recycle films and pouches. Market differentiation increasingly depends on achieving food-grade quality, scaling output capacity, and delivering traceable, low-carbon materials aligned with global sustainability requirements.
Shape Your Report to Specific Countries or Regions & Enjoy 30% Off!
Key Player Analysis
Recent Developments
- In March 2025, UFlex secured approval from the US Food & Drug Administration (USFDA) for the use of recycled polyethylene (rPE) in food-packaging applications.
- In July 2024, Mondi launched its “FlexiBag Reinforced” mono-polyethylene (PE) range, designed for recyclability and developed with customizable levels of post-consumer recycled PE content.
Report Coverage
The research report offers an in-depth analysis based on Product type, Material type, Packaging type and Geography. It details leading market players, providing an overview of their business, product offerings, investments, revenue streams, and key applications. Additionally, the report includes insights into the competitive environment, SWOT analysis, current market trends, as well as the primary drivers and constraints. Furthermore, it discusses various factors that have driven market expansion in recent years. The report also explores market dynamics, regulatory scenarios, and technological advancements that are shaping the industry. It assesses the impact of external factors and global economic changes on market growth. Lastly, it provides strategic recommendations for new entrants and established companies to navigate the complexities of the market.
Future Outlook
- Chemically recycled flexible packaging will gain stronger adoption as brands accelerate commitments to circular and low-carbon materials.
- Advanced recycling capacity will expand through large-scale investments and global partnerships across the value chain.
- Food-grade recycled polymers will become more widely available as depolymerization and purification technologies mature.
- Multi-layer and high-barrier flexible structures will increasingly shift toward chemically recycled inputs to meet regulatory demands.
- Mass-balance certification and traceability systems will strengthen supply chain credibility and compliance.
- Collaboration between chemical producers, converters, and FMCG companies will drive faster commercial scaling.
- Regional infrastructure improvements will enhance feedstock collection and boost recycling efficiency.
- Material innovation will lead to higher-performance recycled PE, PP, and PET suitable for premium applications.
- Policy frameworks will tighten around extended producer responsibility and recycled-content mandates.
- Competitive intensity will rise as technology providers and new entrants develop cost-efficient recycling solutions.


