Market Overview
China Cheese market size was valued at USD 8,329.57 million in 2024 and is anticipated to reach USD 13,312.83 million by 2032, at a CAGR of 5.62% during the forecast period (2024-2032).
| REPORT ATTRIBUTE |
DETAILS |
| Historical Period |
2020-2023 |
| Base Year |
2024 |
| Forecast Period |
2025-2032 |
| China Cheese Market Size 2024 |
USD 8,329.57 million |
| China Cheese Market, CAGR |
5.62% |
| China Cheese Market Size 2032 |
USD 13,312.83 million |
The China cheese market is driven by increasing consumer demand for cheese, fueled by the growing popularity of Western cuisine and an evolving dietary preference for diverse and nutritious food options. Urbanization, rising disposable incomes, and a shift toward convenient, ready-to-eat food products are contributing to market expansion. The younger generation, in particular, is embracing cheese in various forms, such as snacks and spreads, which is further boosting consumption. Additionally, the introduction of a wide variety of cheese products catering to local tastes, alongside growing awareness of cheese’s health benefits, is spurring market growth. On the trends front, the emergence of plant-based cheese alternatives and innovative packaging solutions is enhancing product appeal. The expansion of online retail channels is also making cheese more accessible, while premium and organic cheese offerings are gaining traction as consumers seek higher-quality, artisanal products. These factors collectively drive the market’s growth trajectory.
The China cheese market is concentrated in key urban centers such as Beijing, Shanghai, Guangzhou, and Shenzhen, where consumer demand for cheese is growing due to increasing exposure to Western cuisine and rising disposable incomes. These cities are seeing a shift in food preferences, with cheese becoming a more common ingredient in both traditional and modern dishes. Key players in the market include domestic and international companies such as Yili Group, Mengniu Dairy, Fonterra Co-operative Group, and Meiji Holdings, which are driving the market’s expansion through product innovation and distribution. Additionally, global dairy brands like Vinamilk and Mother Dairy are also capitalizing on the growing demand by offering a variety of cheese products tailored to local tastes. The presence of these key players, along with the rapid growth of e-commerce platforms, further supports the increasing accessibility and consumption of cheese across China’s diverse regions.
Access crucial information at unmatched prices!
Request your sample report today & start making informed decisions powered by Credence Research Inc.!
Download Sample
Market Insights
- The China cheese market was valued at USD 8,329.57 million in 2024 and is expected to reach USD 13,312.83 million by 2032, growing at a CAGR of 5.62%.
- The global cheese market was valued at USD 97,440.00 million in 2024 and is projected to reach USD 1,46,171.12 million by 2032, growing at a CAGR of 5.20% during the forecast period.
- Growing demand for Western cuisine and increasing adoption of cheese-based dishes are driving market growth.
- Premium and artisanal cheeses are gaining popularity, catering to health-conscious and sophisticated consumers.
- Plant-based cheese alternatives are emerging as a key trend due to rising demand for vegan and lactose-free products.
- Competition in the market is intensifying with players like Yili Group, Mengniu Dairy, Fonterra, and Meiji Holdings, offering diverse product ranges.
- Cultural barriers and high cheese prices remain significant challenges to wider adoption in certain regions.
- Regional demand is concentrated in cities like Beijing, Shanghai, Guangzhou, and Shenzhen, with urban areas leading cheese consumption.
Report scope
This report segments the China Cheese Market as follows:
Market Drivers
Growing Demand for Western Cuisine
The increasing popularity of Western-style cuisine is one of the primary drivers of the China cheese market. For instance, studies from food and beverage organizations have noted the growing use of cheese in popular dishes offered by fast food chains and casual dining restaurants, such as cheeseburgers, pizzas, and pasta. Reports from international culinary surveys reveal that younger Chinese consumers, influenced by social media and overseas travel, are increasingly incorporating cheese into their home-cooked meals. Additionally, data from consumer behavior studies indicates that the availability of cheese recipes and cooking tutorials on online platforms has encouraged its adoption among urban households.
Urbanization and Rising Disposable Income
China’s rapid urbanization and growing middle class are significant contributors to the increased demand for cheese. As more people migrate to cities in search of better employment opportunities, urban centers have seen a rise in disposable incomes, which has allowed consumers to explore diverse food options, including dairy products like cheese. With greater purchasing power, consumers are more likely to spend on premium food items, including specialty and imported cheeses. Urban residents, particularly millennials and Gen Z, are increasingly willing to experiment with new food products, which supports the expansion of cheese consumption across the country. This trend is further fueled by the rise of modern retail channels, including supermarkets and online stores, which make it easier for consumers to access a variety of cheese products.
Health and Nutritional Benefits of Cheese
The growing awareness of the nutritional benefits of cheese has played a pivotal role in the market’s expansion. For instance, health-focused campaigns by nutrition authorities emphasize cheese as a rich source of protein, calcium, and other essential nutrients, making it an attractive option for health-conscious consumers. As Chinese consumers become more focused on their health and wellness, cheese is being integrated into diets as a source of high-quality nutrition. Additionally, cheese’s versatility in various recipes—from snacks and sandwiches to salads and main dishes—further drives its appeal. The rise of health-conscious eating habits, particularly among younger generations, is expected to continue to propel cheese consumption, especially as it is incorporated into more localized, health-oriented food offerings.
Expansion of Retail and E-Commerce Channels
The expansion of both physical retail stores and e-commerce platforms has significantly increased the availability of cheese across China, contributing to its market growth. Traditional brick-and-mortar supermarkets and grocery stores have expanded their dairy sections, offering a wider range of local and imported cheese products. Meanwhile, the rapid rise of online grocery shopping, especially in the wake of the COVID-19 pandemic, has made cheese products more accessible to a broader consumer base. E-commerce platforms like Alibaba’s Tmall and JD.com have become key distribution channels, allowing consumers in even remote areas to purchase a variety of cheeses. The convenience of home delivery, coupled with increasing trust in online shopping, has further fueled the growth of the cheese market. Additionally, online platforms have facilitated greater awareness of different cheese types and uses, expanding the consumer base.
Market Trends
Rise of Plant-Based Cheese Alternatives
One of the key trends shaping the China cheese market is the growing demand for plant-based cheese alternatives. As consumers become more health-conscious and environmentally aware, the preference for plant-based diets is increasing. This shift is driving innovation in the cheese sector, with companies developing dairy-free, vegan-friendly cheeses made from ingredients such as almonds, soy, and coconut. For instance, a survey by the China Nutrition Society highlights that a significant portion of urban consumers are actively seeking plant-based alternatives to traditional dairy products due to health and environmental concerns. These alternatives cater to individuals with lactose intolerance, those following vegan diets, or those seeking to reduce their environmental footprint. As plant-based diets continue to gain popularity in China, the demand for plant-based cheese products is expected to grow, opening new avenues for market expansion and diversification.
Premium and Artisanal Cheese Offerings
Another notable trend in the Chinese cheese market is the increasing interest in premium and artisanal cheese. Consumers are increasingly seeking high-quality, unique, and small-batch products that offer distinctive flavors and textures. This trend is driven by a desire for more sophisticated food experiences and a growing appreciation for gourmet and artisanal food products. Specialty cheeses, such as aged cheddar, Brie, Gouda, and blue cheese, are becoming more popular, particularly in high-income urban areas. These products are often perceived as luxury items, and their growing availability in supermarkets and online retail platforms is contributing to the development of a niche market for premium cheese. As Chinese consumers become more discerning in their food choices, the demand for high-quality, locally-produced, and imported artisanal cheeses will continue to rise.
Increasing Cheese Product Innovation
Product innovation is another key trend influencing the China cheese market. Companies are increasingly focusing on developing new cheese varieties and flavors that cater to local tastes and preferences. For instance, a leading dairy company in China recently introduced cheese lollipops and drinkable cheese products tailored for children, which have gained significant traction in the market. Cheese products with mild, less salty, or sweet flavors are gaining popularity as they align more closely with Chinese culinary traditions. In addition to flavor innovations, new cheese formats, such as cheese snacks, spreads, and single-serve portions, are being introduced to meet the growing demand for convenient, on-the-go food options. These innovations not only attract new consumers but also help to expand the usage of cheese beyond traditional applications, such as in baking and cooking, to more casual and snack-based consumption. The continued focus on product differentiation will drive further growth and appeal in the competitive market.
Growth of E-Commerce and Online Retail Channels
The continued growth of e-commerce and online retail channels is another prominent trend influencing the Chinese cheese market. Online shopping platforms, such as Tmall, JD.com, and Suning, have become increasingly important in the distribution of cheese products, particularly for urban consumers who prefer the convenience of home delivery. The availability of a wide range of cheese brands, including both domestic and imported varieties, on these platforms has expanded access to cheese, especially in tier-2 and tier-3 cities where physical retail options may be limited. Furthermore, online platforms are helping to educate consumers about different types of cheese and their culinary uses, which is fostering greater interest in cheese products. As digital shopping continues to rise in popularity, the e-commerce sector will remain a significant driver of cheese consumption in China.
Market Challenges Analysis
Cultural Barriers and Consumer Awareness
One of the primary challenges facing the China cheese market is the cultural barrier to cheese consumption. Historically, cheese has not been a staple in traditional Chinese cuisine, and many consumers are unfamiliar with its taste and texture. Despite the growing popularity of Western food products, cheese still faces resistance in some regions, particularly in rural areas, where dairy consumption is lower. Additionally, there is a lack of awareness regarding the nutritional benefits of cheese, which can hinder its adoption among health-conscious consumers. Overcoming these cultural barriers requires continued education about the health benefits of cheese and more localized marketing strategies that appeal to Chinese tastes.
High Prices and Import Dependency
Another significant challenge is the high price of cheese, particularly premium and imported varieties. Imported cheese, which makes up a large portion of the market, is subject to tariffs, transportation costs, and other import-related expenses, driving up prices for consumers. For instance, data from the Observatory of Economic Complexity highlights that China imports a significant volume of cheese from countries like New Zealand and Australia, which adds to the cost due to logistical and tariff-related expenses. While domestic cheese production is growing, it is still not enough to meet the increasing demand for diverse cheese products. The higher cost of cheese can be a deterrent for price-sensitive consumers, particularly in lower-income regions. To mitigate this challenge, domestic producers need to scale up production and enhance efficiency, while importers may need to focus on reducing costs or promoting more affordable cheese options to capture a broader market segment.
Market Opportunities
The China cheese market presents significant opportunities for growth due to evolving consumer preferences and an expanding middle class. As urbanization continues to accelerate, more consumers in metropolitan areas are seeking diverse and convenient food options, including cheese. With rising disposable incomes, there is an increasing willingness to experiment with foreign foods, especially among younger generations who are exposed to global food trends. This creates a substantial opportunity for both domestic and international cheese brands to target urban centers, offering a range of products that cater to the tastes and dietary preferences of Chinese consumers. Additionally, the growing interest in Western-style cuisine, combined with greater awareness of cheese’s nutritional benefits, further supports the market potential for cheese in China.
Furthermore, there is a promising opportunity in the premium and artisanal cheese segment. As Chinese consumers become more sophisticated and discerning about food quality, the demand for high-end, gourmet cheese products is on the rise. Local and imported premium cheese brands that offer unique flavors, high-quality ingredients, and authenticity are likely to see increased demand. Additionally, the growing trend towards plant-based and lactose-free products presents an untapped market for plant-based cheese alternatives. By capitalizing on these shifts in consumer demand, cheese manufacturers can diversify their product offerings and cater to a broader audience, including health-conscious and environmentally aware consumers. As e-commerce continues to thrive in China, online platforms provide an efficient means for cheese brands to reach a wider demographic, particularly in smaller cities where access to specialty food products may be limited.
Market Segmentation Analysis:
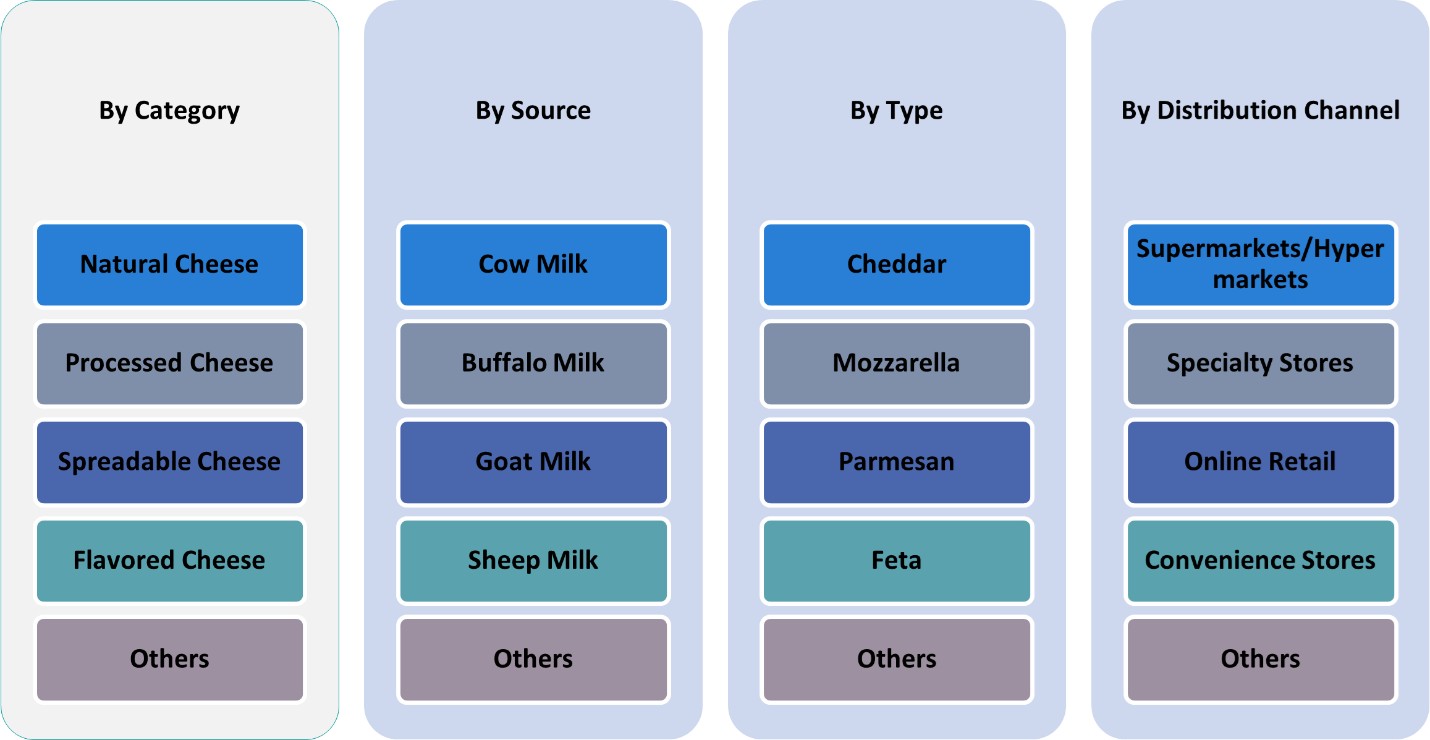
By Category:
The China cheese market is segmented into various categories, with cheddar, processed cheese, spreadable cheese, and flavored cheese being the most prominent. Cheddar cheese dominates the market due to its versatility and widespread use in sandwiches, burgers, and snacks. As Western fast food chains expand their presence in China, cheddar continues to be a favorite choice for consumers. Processed cheese, often used in ready-to-eat meals and snacks, is gaining popularity due to its convenience and affordability, making it highly appealing to the middle class and working professionals. Spreadable cheese is also seeing a rise in demand as it caters to the growing preference for easy-to-consume and convenient food products. Lastly, flavored cheese, which includes varieties such as herb-infused and spicy cheese, is expanding as consumers increasingly seek new and exotic flavors. These segments highlight a shift toward more diverse cheese products that cater to both traditional and modern food preferences in China.
By Source:
The source of milk used in cheese production also plays a key role in the market dynamics. Cow milk remains the dominant source, accounting for a significant portion of cheese production due to its widespread availability and relatively lower cost. This is particularly true for mass-produced cheese varieties, such as cheddar and processed cheese. Buffalo milk, on the other hand, is gaining popularity for its rich and creamy texture, making it ideal for high-quality cheeses such as mozzarella and paneer. As consumers increasingly seek premium products, buffalo milk-based cheeses are carving out a niche market, particularly in high-income urban areas. Goat milk and sheep milk cheeses are also emerging as a trendy alternative, particularly among health-conscious consumers who prefer lower-fat or lactose-free options. These niche products cater to growing demand for specialty and gourmet cheeses, allowing manufacturers to target a more discerning demographic. The rise of diverse milk sources reflects the evolving tastes of Chinese consumers who are open to experimenting with various types of cheese.
Segments:
Based on Category:
- Cheddar
- Processed Cheese
- Spreadable Cheese
- Flavored Cheese
- Others
Based on Source:
- Cow Milk
- Buffalo Milk
- Goat Milk
- Sheep Milk
- Others
Based on Type:
- Cheddar
- Mozzarella
- Parmesan
- Feta
- Others
Based on Distribution Channel:
- Supermarkets/Hypermarkets
- Specialty Stores
- Online Retail
- Convenience Stores
- Others
Based on the Geography:
- Beijing
- Shanghai
- Guangzhou
- Shenzhen
Regional Analysis
Beijing
Beijing, the capital city, holds the largest market share in the Chinese cheese market, accounting for approximately 25%. As the political, cultural, and economic center of the country, Beijing has a high concentration of expatriates and a large, diverse consumer base. This urban demographic, along with the growing middle class and affluent consumers, has contributed to the increased demand for imported and premium cheese products. Moreover, the city’s increasing adoption of Western cuisine, particularly fast food chains and international restaurants, has further fueled the cheese market in this region.
Shanghai
Shanghai follows closely, holding around 22% of the total market share. As China’s financial hub, Shanghai’s market is characterized by its cosmopolitan lifestyle and an affluent population that is highly receptive to international food trends. The city has witnessed a surge in cheese consumption, driven by the rising demand for premium cheeses and Western-style fast food. In addition, Shanghai’s retail landscape, which includes numerous high-end supermarkets and e-commerce platforms, provides easy access to a wide variety of cheese products, including those from local and international producers. The city’s status as a global business center makes it a significant market for both traditional and innovative cheese offerings.
Guangzhou
Guangzhou, located in southern China, accounts for approximately 18% of the market share. This region has a long-standing tradition of incorporating dairy products into its cuisine, and cheese has gradually found a place in the local diet. Guangzhou’s proximity to Hong Kong and its status as a major commercial center have also contributed to the increasing adoption of Western food culture. The demand for cheese, particularly in premium forms such as artisanal and specialty cheeses, is on the rise, driven by a growing middle class and an evolving culinary landscape that embraces both local and international foods.
Shenzhen
Shenzhen, with a market share of 15%, has witnessed significant growth in cheese consumption. As a rapidly developing city known for its innovation and technology-driven economy, Shenzhen has a younger, tech-savvy population that is more open to experimenting with Western foods, including cheese. The increasing disposable incomes of Shenzhen’s residents, coupled with the growing presence of international food brands, have created a favorable environment for the expansion of the cheese market. Additionally, the city’s status as a gateway to international markets has facilitated the importation of diverse cheese varieties, further driving demand in the region.
Shape Your Report to Specific Countries or Regions & Enjoy 30% Off!
Key Player Analysis
Competitive Analysis
The competitive landscape of the China cheese market is marked by the presence of both domestic and international players vying for market share. Leading companies such as Yili Group, Mengniu Dairy, Fonterra Co-operative Group, Meiji Holdings, Vinamilk, Mother Dairy, Parag Milk Foods, Britannia Industries, and Bega Cheese Limited are at the forefront of this growth. These players have made significant strides in product innovation, catering to the evolving preferences of Chinese consumers who are increasingly seeking premium, artisanal, and plant-based cheese options. These companies are expanding their product portfolios to include a wider range of cheese types, including premium, artisanal, and processed varieties, to cater to various market segments. International brands bring a wealth of expertise and a variety of imported cheese products that appeal to more urban, affluent consumers who are increasingly exposed to Western food trends. These players are focused on expanding their presence in major cities through both retail and online channels, capitalizing on the growing popularity of Western cuisine and convenience foods. The competition is also intensified by the rising trend of plant-based cheese alternatives, which has prompted companies to innovate in the lactose-free and vegan product space. To remain competitive, companies are investing heavily in product innovation, localized marketing strategies, and improving their distribution channels. As consumer preferences continue to evolve, these brands will need to adapt and differentiate themselves to maintain a strong position in this rapidly expanding market.
Recent Developments
- In March 2025, Arla Foods Ingredients partnered with Valley Queen in South Dakota to increase production of Nutrilac® ProteinBoost, a high-protein whey concentrate, to meet growing demand in North America.
- In March 2025, Sargento introduced three innovations—Natural American Cheese, Seasoned Shredded Cheese in collaboration with McCormick, and Shareables snack trays in partnership with Mondelez International.
- In March 2025, Saputo USA debuted its spicy mozzarella cheese at the International Pizza Expo, combining traditional mozzarella with habanero jack for a zesty twist.
- In February 2025, Kraft Heinz emphasized innovation across three platforms—taste elevation, easy-ready meals, and snacking. This includes new product launches like Lunchables Spicy Nachos and value-sized Kraft Mac & Cheese to cater to shifting consumer preferences.
- In November 2024, Lactalis highlighted emerging trends such as premiumization, hot eating cheeses like Président Extra Creamy Brie, and sustainability-focused products like Seriously Spreadable Black Pepper cheese.
Market Concentration & Characteristics
The China cheese market is moderately concentrated, with a mix of domestic and international players competing for market share. Leading domestic companies dominate the market, benefiting from established distribution networks, local production capabilities, and a deep understanding of consumer preferences. However, international brands are making significant inroads, especially in urban areas, by offering diverse and premium cheese products that cater to growing consumer demand for Western cuisine. The market is characterized by increasing consumer sophistication, with a growing interest in premium, artisanal, and specialty cheeses. Additionally, plant-based cheese alternatives are gaining traction as consumers become more health-conscious and environmentally aware. This shift is further fueling innovation within the market. While urban centers like Beijing, Shanghai, Guangzhou, and Shenzhen drive the majority of cheese consumption, there is a gradual expansion into smaller cities, indicating potential for growth across the country. Overall, the market is dynamic and evolving, with opportunities for both established and new entrants.
Report Coverage
The research report offers an in-depth analysis based on Category, Source, Type, Distribution Channel and Geography. It details leading market players, providing an overview of their business, product offerings, investments, revenue streams, and key applications. Additionally, the report includes insights into the competitive environment, SWOT analysis, current market trends, as well as the primary drivers and constraints. Furthermore, it discusses various factors that have driven market expansion in recent years. The report also explores market dynamics, regulatory scenarios, and technological advancements that are shaping the industry. It assesses the impact of external factors and global economic changes on market growth. Lastly, it provides strategic recommendations for new entrants and established companies to navigate the complexities of the market.
Future Outlook
- The China cheese market is expected to continue its growth, driven by increasing urbanization and rising disposable incomes.
- Premium and artisanal cheese products will see a rise in demand as consumers become more sophisticated and health-conscious.
- Plant-based and lactose-free cheese alternatives are likely to gain significant traction among health-aware and vegan consumers.
- There will be greater penetration of cheese products in smaller cities as awareness and acceptance of cheese grow across the country.
- Western fast food chains and international cuisine will continue to influence consumer preferences for cheese-based dishes.
- The growing interest in gourmet and specialty cheeses will lead to an increase in local production and imports of diverse varieties.
- E-commerce platforms will play a crucial role in expanding cheese availability, especially in less accessible regions.
- Increasing health consciousness will drive demand for cheeses with added nutritional benefits, such as probiotics and lower fat content.
- As the younger population becomes more adventurous with food, cheese consumption in various formats will rise.
- Domestic producers will focus on improving quality and innovation to compete with global brands and meet evolving consumer preferences.


