
Market Overview
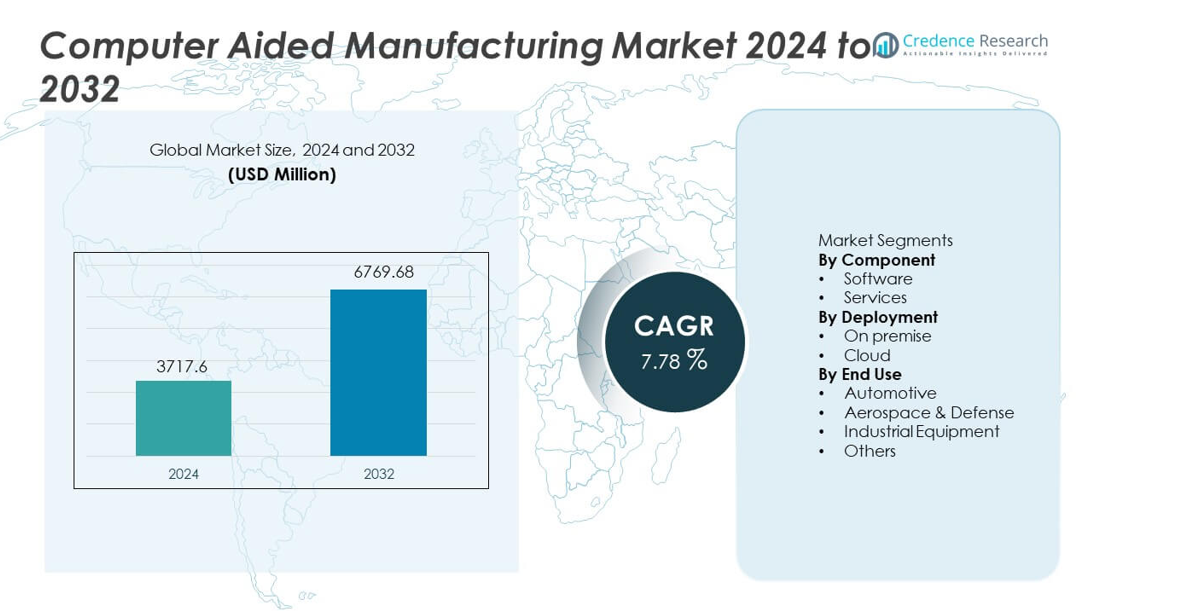
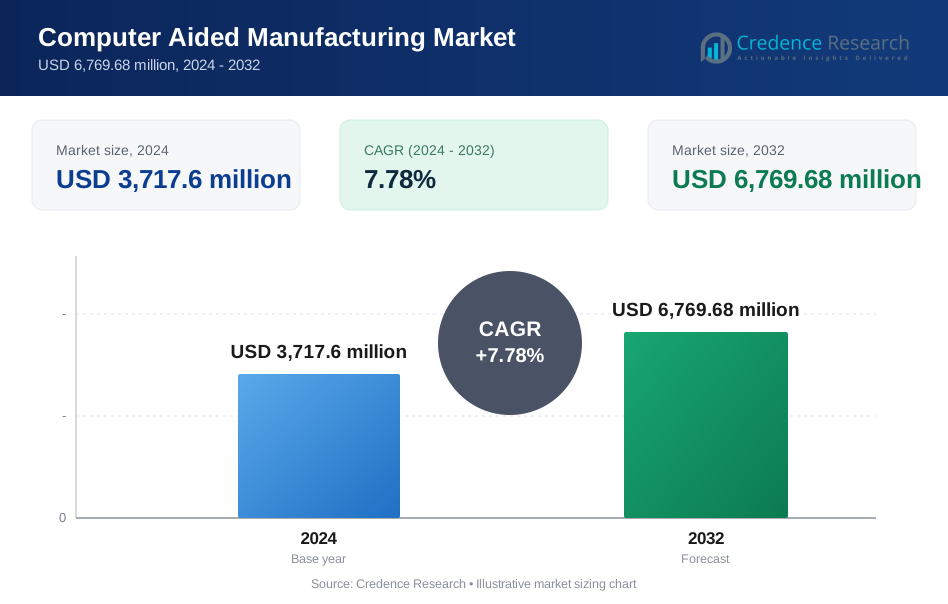
The Computer Aided Manufacturing (CAM) Market reached USD 3,717.6 million in 2024 and is projected to grow to USD 6,769.68 million by 2032, registering a CAGR of 7.78% during the forecast period.
| REPORT ATTRIBUTE | DETAILS |
|---|---|
| Historical Period | 2020-2023 |
| Base Year | 2024 |
| Forecast Period | 2025-2032 |
| Computer Aided Manufacturing Market Size 2024 | USD 3,717.6 million |
| Computer Aided Manufacturing Market, CAGR | 7.78% |
| Computer Aided Manufacturing Market Size 2032 | USD 6,769.68 million |
Top players in the Computer Aided Manufacturing market include COMSOL, Siemens, BETA CAE Systems, Autodesk, Inc., Rockwell Automation, Dassault Systèmes, Altair Engineering Inc., Bentley Systems, Incorporated, ANSYS, Inc., and ESI Group, all of which focus on advanced toolpath optimization, multi-axis machining support, and seamless integration with CAD and PLM platforms. These companies strengthen competitiveness through simulation capabilities, cloud-enabled workflows, and AI-driven automation. Asia Pacific leads the market with a 34% share, driven by rapid industrialization and high adoption of CNC technologies, while North America and Europe follow due to strong precision engineering standards and sustained investment in smart manufacturing.
Market Insights
- The Computer Aided Manufacturing market reached USD 3,717.6 million in 2024 and will grow at a CAGR of 7.78% through 2032.
- Strong market drivers include rising automation and precision machining needs, with software holding a 67% share due to its central role in toolpath control and simulation.
- Key trends highlight rapid adoption of cloud-based CAM and multi-axis machining technologies, while Asia Pacific leads with a 34% regional share driven by large-scale manufacturing growth.
- Competitive dynamics intensify as major players expand simulation capabilities, AI-driven optimization, and integration with CAD and PLM ecosystems.
- Market restraints include high implementation costs and a shortage of skilled CAM programmers, while automotive leads end-use adoption with a 36% share, reflecting strong demand for accurate and high-volume machining.
Market Segmentation Analysis:
By Component
Software dominates the component segment with a 67% share, driven by strong adoption of advanced CAM platforms that support multi-axis machining, toolpath optimization, and real-time simulation. Manufacturers rely on software solutions to reduce production errors, improve machining accuracy, and accelerate prototype-to-production cycles. Integration with CAD and PLM systems further strengthens uptake as companies seek seamless digital workflows. Services hold the remaining share and continue to expand as enterprises demand training, customization, and ongoing maintenance. Growing focus on automated manufacturing and complex part geometries keeps software as the primary growth engine in this segment.
- For instance, Siemens NX CAM enabled JK Machining to cut mold-development lead times from 20 weeks to 11 weeks. The company also reported programming time falling from several hours to under 30 minutes after adopting automated 5-axis toolpaths.
By Deployment
On-premise deployment leads the segment with a 58% share, supported by industries that require tight control over data security, high-precision machining operations, and fully customized CAM environments. Automotive and aerospace manufacturers prefer on-premise systems due to large file handling, complex workflows, and compliance needs. Cloud-based deployment holds a rising share as small and mid-sized enterprises adopt scalable, subscription-based CAM solutions. The cloud segment grows faster due to lower upfront costs, easier updates, and remote collaboration benefits. The shift toward connected factories and distributed production continues to strengthen future cloud adoption.
- For instance, Autodesk Fusion 360 helped R&D Engineering and Machining lower programming time by 40 after replacing legacy on-premise systems. The company used cloud-based toolpath automation and 3- to 5-axis machining to complete aerospace prototype jobs faster.
By End Use
Automotive is the leading end-use segment with a 36% share, driven by high demand for precision machining in engine components, molds, dies, and lightweight structures. CAM enhances manufacturing speed, reduces tool wear, and supports complex geometries required for modern vehicle designs. Aerospace and defense follow closely due to the need for accurate machining of advanced materials such as titanium and composites. Industrial equipment manufacturers rely on CAM to improve productivity in toolmaking and heavy machinery parts. The “Others” category, including consumer electronics and medical devices, grows steadily as more sectors adopt automated and digitally controlled machining processes.
Key Growth Driver
Expansion of Automated and Precision Manufacturing
Manufacturers across automotive, aerospace, and industrial equipment sectors continue to adopt automated systems that require high-precision machining. Computer Aided Manufacturing supports complex toolpaths, multi-axis machining, and advanced simulation, helping companies reduce production time and improve accuracy. Demand grows as firms aim to minimize human error and meet tighter tolerance requirements for modern components. The shift toward digital factories further accelerates CAM usage, with enterprises integrating these solutions to optimize workflows and strengthen production efficiency. Rising investments in CNC machines and robotics reinforce the long-term expansion of CAM platforms.
- For instance, DMG Mori reported that deploying its multi-axis automation can significantly reduce cycle times in aerospace part machining, and integrated simultaneous five-axis programming is used to achieve high tolerance repeatability.
Integration with CAD, PLM, and Digital Twin Systems
Growing emphasis on connected engineering environments drives demand for CAM solutions that integrate seamlessly with CAD and PLM platforms. This integration improves product design accuracy, shortens development cycles, and enhances collaboration across teams. Manufacturers use digital twins to validate machining processes before physical execution, reducing scrap rates and operational costs. As companies expand digital transformation initiatives, CAM becomes a critical part of end-to-end production planning. Strong interoperability increases adoption among enterprises aiming to streamline design-to-manufacturing workflows and improve overall operational performance.
- For instance, Dassault Systèmes confirmed that integrating DELMIA Digital Manufacturing with CATIA enabled Airbus to accelerate its design and manufacturing cycle, ensuring all engineers worked on the same design platform.
Rising Adoption in Small and Medium Enterprises
Small and medium manufacturers increasingly adopt CAM solutions to automate machining tasks, reduce manual programming, and improve productivity. Cloud-based and subscription models make these technologies more accessible by offering lower upfront investment and scalable features. SMEs use CAM to produce complex parts with better speed and accuracy, helping them compete with larger manufacturers. Growing demand for customization in consumer products further pushes smaller firms to upgrade their machining capabilities. As cost-effective digital tools become widely available, adoption accelerates across diverse industries.
Key Trend and Opportunity
Growth of Cloud-Based and Collaborative CAM Platforms
Cloud deployment is emerging as a major opportunity as companies shift workflows toward flexible, remote-access systems. Cloud CAM enables real-time updates, scalable computing, and improved collaboration between design and production teams. Distributed manufacturing models and global supply chains benefit from shared machining data and remotely managed toolpaths. This trend supports small firms seeking lower capital investment and easier software maintenance. As cybersecurity and cloud performance improve, adoption increases across industries prioritizing efficiency, scalability, and faster design-to-production transitions.
- For instance, Autodesk stated that Fusion 360’s cloud collaboration reduced programming preparation time at Swift Engineering during composite tooling programs. The switch to cloud toolpath sharing also cut offline data exchange and allowed engineering teams to review toolpaths simultaneously.
Increasing Use of Advanced Materials and Multi-Axis Machining
The rise of lightweight composites, titanium alloys, and high-strength materials creates opportunities for CAM systems that optimize machining strategies. Multi-axis capabilities enable accurate shaping of complex geometries used in aerospace, automotive, and medical applications. Advanced CAM algorithms improve tool life, reduce heat generation, and enhance cutting performance. Growth in electric vehicles and next-generation aircraft increases demand for sophisticated machining workflows. As industries innovate with new materials, CAM providers gain opportunities to deliver advanced toolpath automation and simulation technologies.
- For instance, Sandvik Coromant confirmed that its multi-axis CAM machining strategy increased tool life when cutting Ti-6Al-4V components for an aerospace application. The optimized strategy effectively managed tool wear and lowered spindle load during roughing passes, leading to improvements in machining performance and efficiency.
Key Challenge
High Initial Investment and System Complexity
Many manufacturers face financial and operational challenges when adopting advanced CAM solutions due to high licensing costs, hardware requirements, and training needs. Complex interfaces and steep learning curves slow implementation, especially for small and mid-sized enterprises. Companies must allocate significant resources to integrate CAM with existing CNC equipment and digital systems. These barriers limit adoption for firms with limited budgets or lower technical expertise. Addressing usability and affordability remains essential for broader market penetration.
Shortage of Skilled CAM and CNC Programming Professionals
A global shortage of trained CAM programmers and CNC machinists hinders effective implementation of advanced manufacturing technologies. Many facilities struggle to operate multi-axis systems or optimize toolpaths due to limited technical expertise. This skill gap results in underutilized software capabilities, inconsistent output quality, and longer production cycles. As industries adopt more complex machining processes, workforce training becomes critical. The lack of skilled professionals slows digital transformation and restricts the full potential of CAM solutions in high-precision industries.
Regional Analysis
North America
North America holds a market share of 31%, driven by strong adoption of CNC machining, industrial automation, and digital manufacturing solutions across automotive, aerospace, and medical device sectors. The region benefits from advanced manufacturing infrastructure and high investment in precision engineering technologies. Companies rely on CAM to enhance machining accuracy, reduce cycle times, and support complex multi-axis operations. The presence of major software developers accelerates innovation and integration with CAD and PLM systems. Growing reshoring efforts and expansion of smart factories further strengthen demand for CAM platforms across the region.
Europe
Europe accounts for a market share of 28%, supported by strong industrial automation, advanced engineering capabilities, and high adoption of CAM in automotive, aerospace, and heavy machinery production. Strict quality standards drive manufacturers to use CAM for precision machining and optimized toolpath control. The region’s focus on sustainability and digital transformation encourages integration of CAM with Industry 4.0 frameworks. Demand rises as companies modernize production lines and adopt multi-axis machining technologies. Collaboration between software developers and machine tool manufacturers strengthens the ecosystem, ensuring continued growth in CAM applications across Europe.
Asia Pacific
Asia Pacific leads the global market with a market share of 34%, driven by rapid industrialization, large-scale manufacturing, and growing investments in advanced machining technologies. China, Japan, India, and South Korea remain key contributors with strong automotive, electronics, and aerospace production bases. Manufacturers adopt CAM to improve accuracy, automate workflows, and manage high-volume output. Expanding CNC machine installations and rising adoption of cloud-based CAM solutions support growth. Government initiatives promoting smart factories and digital manufacturing accelerate market expansion, making Asia Pacific the fastest-growing region in the CAM landscape.
Latin America
Latin America holds an 8% market share, driven by growing industrial modernization in automotive, aerospace maintenance, and heavy equipment sectors. Manufacturers in Brazil, Mexico, and Argentina increasingly adopt CAM to enhance machining efficiency and reduce operational errors. Rising investment in CNC machinery and interest in digital manufacturing support gradual market expansion. Although adoption is slower compared to other regions, the region benefits from increasing demand for precision components and improved production quality. Import substitution efforts and regional manufacturing development programs contribute to rising CAM penetration.
Middle East & Africa
The Middle East & Africa region represents a 5% market share, supported by expanding manufacturing capabilities in aerospace maintenance, automotive components, and industrial equipment. Countries such as UAE, Saudi Arabia, and South Africa invest in advanced machining technologies to diversify economies and strengthen local production. CAM adoption grows as companies seek greater accuracy, faster turnaround times, and improved workflow automation. High interest in smart factory development and digital transformation initiatives supports long-term growth. While market maturity remains lower, rising industrial investment continues to enhance regional demand for CAM solutions.
Market Segmentations:
By Component
- Software
- Services
By Deployment
- On premise
- Cloud
By End Use
- Automotive
- Aerospace & Defense
- Industrial Equipment
- Others
By Geography
- North America
- U.S.
- Canada
- Mexico
- Europe
- Germany
- France
- U.K.
- Italy
- Spain
- Rest of Europe
- Asia Pacific
- China
- Japan
- India
- South Korea
- South-east Asia
- Rest of Asia Pacific
- Latin America
- Brazil
- Argentina
- Rest of Latin America
- Middle East & Africa
- GCC Countries
- South Africa
- Rest of the Middle East and Africa
Competitive Landscape
The competitive landscape includes COMSOL, Siemens, BETA CAE Systems, Autodesk, Inc., Rockwell Automation, Dassault Systèmes, Altair Engineering Inc., Bentley Systems, Incorporated, ANSYS, Inc., and ESI Group. These companies compete by delivering advanced CAM platforms that support multi-axis machining, simulation, and seamless integration with CAD, PLM, and digital twin environments. Vendors invest heavily in R&D to enhance toolpath accuracy, reduce machining time, and improve workflow automation across high-precision industries. Cloud-based deployment, AI-driven optimization, and real-time simulation strengthen product differentiation. Strategic collaborations with CNC machine manufacturers, along with expansion into emerging manufacturing hubs, further reinforce market presence. As industries accelerate digital transformation, competitors focus on scalable, flexible, and high-performance CAM solutions that improve productivity and lower operational costs.
Key Player Analysis
- COMSOL
- Siemens
- BETA CAE Systems
- Autodesk, Inc.
- Rockwell Automation
- Dassault Systemes
- Altair Engineering Inc.
- Bentley Systems, Incorporated
- ANSYS, Inc.
- ESI Group
Recent Developments
- In July 2025, ANSYS, Inc. released Ansys 2025 R2, adding AI-powered tools, improved solvers, cloud computing support and expanded Python compatibility.
- In March 2025, Altair Engineering Inc. - now part of Siemens Digital Industries Software - completed its acquisition by Siemens.
- In February 2025, Altair rolled out a major update across its software portfolio, specifically the release of Altair® HyperWorks® 2025.
Report Coverage
The research report offers an in-depth analysis based on Component, Deployment, End Use and Geography. It details leading market players, providing an overview of their business, product offerings, investments, revenue streams, and key applications. Additionally, the report includes insights into the competitive environment, SWOT analysis, current market trends, as well as the primary drivers and constraints. Furthermore, it discusses various factors that have driven market expansion in recent years. The report also explores market dynamics, regulatory scenarios, and technological advancements that are shaping the industry. It assesses the impact of external factors and global economic changes on market growth. Lastly, it provides strategic recommendations for new entrants and established companies to navigate the complexities of the market.
Future Outlook
- Demand for CAM solutions will rise as manufacturers pursue higher precision and faster production cycles.
- Cloud-based CAM platforms will gain wider adoption due to flexibility, scalability, and lower upfront costs.
- Integration with CAD, PLM, and digital twin systems will become a core requirement for advanced manufacturing.
- Multi-axis machining and automation will drive innovation in toolpath optimization and simulation features.
- Adoption in small and medium enterprises will grow as subscription-based models reduce cost barriers.
- AI-driven machining predictions and automated programming will enhance efficiency and reduce manual input.
- Asia Pacific will continue to lead growth due to strong manufacturing expansion and rapid CNC adoption.
- Aerospace and automotive sectors will invest heavily in CAM to support complex material machining.
- Workforce training and upskilling programs will rise to address the shortage of CAM and CNC experts.
- Continuous R&D will create next-generation CAM platforms focused on speed, accuracy, and interoperability.
Request a Free Sample
Fill in your details and we'll send you a free sample report.
- Sample data tables & charts
- Research methodology
Need a Custom Version of This Report?
Tailor the scope, geography, or segments to your exact requirements.
- Custom geography or segment scope
- Direct access to our analyst team
Frequently Asked Questions
What is the current market size for Computer Aided Manufacturing market, and what is its projected size in 2032?
At what Compound Annual Growth Rate is the Computer Aided Manufacturing market projected to grow between 2025 and 2032?
Which Computer Aided Manufacturing market segment held the largest share in 2024?
What are the primary factors fueling the growth of the Computer Aided Manufacturing market?
Who are the leading companies in the Computer Aided Manufacturing market?
Which region commanded the largest share of the Computer Aided Manufacturing market in 2024?
Table of Content
Chapter 1. Report Introduction
- 1.1 Report Description & Purpose
- 1.1.1 Report Title & Market Definition
- 1.1.2 Unique Selling Propositions (USP) & Key Differentiators
- 1.1.3 Value Proposition for Stakeholders
- 1.2 Research Objectives
- 1.2.1 Market Sizing Objectives (Volume & Revenue)
- 1.2.2 Segmentation Objectives
- 1.2.3 Competitive Intelligence Objectives
- 1.2.4 Forecast & Scenario Objectives
- 1.3 Report Scope
- 1.3.1 Computer Aided Manufacturing Scope – Types & Subtypes Covered
- 1.3.2 Geographic Scope – Regions & Countries Covered
- 1.3.3 Historical Period, Base Year & Forecast Period (2024; forecast to 2032)
- 1.3.4 Inclusions & Exclusions
- 1.4 HS Code & Classification Framework
- 1.5 Currency, Units & Pricing Basis
- 1.6 Target Stakeholders
- 1.7 Limitations & Assumptions
Chapter 2. Executive Summary
- 2.1 Global Computer Aided Manufacturing Market Snapshot
- 2.1.1 Market Size – Historical (2024) & Forecast (2024-2032) (2024: USD 3,717.6 million → 2032: USD 6,769.68 million)
- 2.1.2 Volume & Revenue – Global Totals
- 2.1.3 Key Market Highlights – Top Five Facts
- 2.2 Computer Aided Manufacturing Market Segmentation Snapshot
- 2.2.1 Market Split by Region – 2024 vs. 2032
- 2.3 Competitive Snapshot
- 2.3.1 Top 10 Players by Revenue Share – 2024
- 2.3.2 Top 10 Players by Volume Share – 2024
- 2.3.3 Recent Strategic Developments (18-Month Summary)
- 2.4 Key Investment Highlights & Strategic Conclusions
Chapter 3. Computer Aided Manufacturing Market Dynamics & Industry Analysis
- 3.1 Market Overview & Context
- 3.1.1 Computer Aided Manufacturing Market Position in the Broader Automotive Value Chain
- 3.1.2 OEM vs. Replacement Market Dynamics
- 3.1.3 Market Maturity & Development Stage by Region
- 3.2 Computer Aided Manufacturing Market Drivers
- 3.3 Computer Aided Manufacturing Market Restraints & Challenges
- 3.4 Computer Aided Manufacturing Market Opportunities
- 3.5 Porter's Five Forces Analysis
- 3.5.1 Threat of New Entrants
- 3.5.2 Bargaining Power of Suppliers
- 3.5.3 Bargaining Power of Buyers
- 3.5.4 Threat of Substitutes
- 3.5.5 Competitive Rivalry – Intensity Assessment
- 3.6 Computer Aided Manufacturing Value Chain Analysis
- 3.6.1 Upstream – Raw Material/Input Suppliers
- 3.6.1.1 Raw Material/Input 1
- 3.6.1.2 Raw Material/Input 2
- 3.6.1.3 Raw Material/Input 3
- 3.6.2 Midstream – Production/Manufacturing/Service Delivery
- 3.6.2.1 Production/Process Overview
- 3.6.2.2 Key Facility Locations & Capacity by Manufacturer
- 3.6.3 Downstream – Distribution & End Consumer
- 3.6.3.1 Primary Channel – B2B/OEM
- 3.6.3.2 Secondary Channels – Dealer, Retail, Online, Direct
- 3.6.4 Value Chain Profitability Analysis
- 3.6.1 Upstream – Raw Material/Input Suppliers
- 3.7 PESTEL Analysis
- 3.7.1 Political Factors
- 3.7.2 Economic Factors
- 3.7.3 Social Factors
- 3.7.4 Technological Factors
- 3.7.5 Environmental Factors
- 3.7.6 Legal Factors
- 3.8 Computer Aided Manufacturing Supply Chain Analysis
- 3.8.1 Raw Material/Input Supply Risk Assessment
- 3.8.2 Manufacturing Concentration Risk (Geographic Exposure)
- 3.8.3 Trade Disruption Impact Analysis
- 3.9 Regulatory & Policy Landscape
Note: The regulatory and policy landscape section covers regulations based on their applicability to the market, Computer Aided Manufacturing category, geography, and scope of the study. Only regulatory frameworks with a material impact on operations, compliance, trade, sustainability, or market access are analyzed in detail.
Chapter 4. Key Investment Pockets & Opportunity Analysis
- 4.1 Computer Aided Manufacturing Market Attractiveness Analysis
- 4.1.1 By Region – Investment Attractiveness Matrix (Volume × CAGR)
- 4.2 Absolute Revenue Growth Opportunity
- 4.2.1 By Region – Absolute USD Growth Through 2032
- 4.3 Incremental Volume Opportunity
- 4.3.1 By Region – Incremental Volume Through 2032
- 4.3.2 Segment – Incremental Volume
- 4.4 Emerging Submarket Opportunity Deep Dive (Subject to Applicability)
- 4.5 Emerging Market Opportunity Scorecards
- 4.5.1 United States
- 4.5.2 Europe
- 4.5.3 Asia
- 4.5.4 Middle East & Africa
Note: Emerging Market Opportunity Scorecards will be included based on relevance and strategic importance. Regions listed are indicative and may vary depending on data availability and market dynamics.
Chapter 5. Computer Aided Manufacturing Import-Export Analysis & Trade Flows
- 5.1 Global Trade Overview
- 5.1.1 Global Export Value by Country (2024)
- 5.1.2 Global Export Volume by Country (2024)
- 5.1.3 Global Import Value by Country (2024)
- 5.1.4 Global Import Volume by Country (2024)
- 5.1.5 Net Trade Balance by Country (2024)
- 5.2 Export Analysis – Segment
- 5.2.1 Type 1 (HS Code)
- 5.2.2 Type 2 (HS Code)
- 5.2.3 Type 3 (HS Code)
- 5.2.4 Type 4 (HS Code)
- 5.2.5 Type 5 (HS Code)
- 5.3 Import Analysis – Segment
- 5.3.1 Type 1 (HS Code)
- 5.3.2 Type 2 (HS Code)
- 5.3.3 Type 3 (HS Code)
- 5.3.4 Type 4 (HS Code)
- 5.3.5 Type 5 (HS Code)
- 5.4 Average Unit Trade Prices
- 5.4.1 Average Export Price – Segment & Country
- 5.4.2 Average Import Price – Segment & Source Country
- 5.4.3 Price Trends (2024)
- 5.5 Key Trade Route Analysis
- 5.5.1 Trade Route 1
- 5.5.2 Trade Route 2
- 5.5.3 Trade Route 3
- 5.5.4 Trade Route 4
- 5.5.5 Trade Route 5
- 5.6 Trade Policy Impact Assessment
- 5.6.1 US Anti-Dumping & Section 301 Tariffs
- 5.6.2 EU Customs Union Impact
- 5.6.3 Major Free Trade Agreements
- 5.6.4 USMCA Rules of Origin
Note: Trade policy analysis will be included only where relevant to the Computer Aided Manufacturing market.
Chapter 6. Competitive Landscape & Company Benchmarking
- 6.1 Computer Aided Manufacturing Market Concentration & Structure
- 6.1.1 Herfindahl-Hirschman Index (HHI) – vs. 2024
- 6.1.2 Tier 1, Tier 2 & Tier 3 Market Structure
- 6.1.3 Global, Regional & Local Player Dynamics
- 6.2 Computer Aided Manufacturing Market Share Analysis – 2024
- 6.2.1 Global Revenue Share by Company
- 6.2.2 Global Volume Share by Company
- 6.2.3 Regional Revenue Share
- 6.2.4 Market Share Evolution ( vs. 2024)
- 6.2.5 OEM Segment Share by Company
- 6.2.6 Replacement Segment Share by Company
- 6.3 Production/Delivery Capacity & Facility Analysis
- 6.3.1 Global Installed Capacity
- 6.3.2 Capacity Utilization Rates
- 6.3.3 Production/Output Volume
- 6.3.4 Facility Locations & Capacity Map
- 6.3.5 Planned Capacity Additions
- 6.4 Computer Aided Manufacturing Competitive Benchmarking Matrix
- 6.4.1 Revenue, Volume, CAGR & Profitability Comparison
- 6.4.2 Channel Revenue Mix
- 6.4.3 Geographic Revenue Exposure
- 6.4.4 R&D Intensity
- 6.4.5 Sustainability Maturity
- 6.5 Strategic Developments in Computer Aided Manufacturing (Last 24 Months)
- 6.5.1 Mergers, Acquisitions & Divestments
- 6.5.2 New Computer Aided Manufacturing Launches
- 6.5.3 Facility Expansions
- 6.5.4 Strategic Alliances, Joint Ventures & Partnerships
- 6.5.5 Distribution Expansion & Market Entry
- 6.5.6 Sustainability & ESG Initiatives
- 6.6 Competitive Strategy Mapping
- 6.6.1 Leader, Challenger, Follower & Niche Classification
- 6.6.2 Pricing Strategy Comparison
- 6.6.3 Channel Strategy Matrix
Note: Strategic developments are included based on their materiality and the availability of reliable information.
Chapter 7. Global Computer Aided Manufacturing Market – By Distribution Channel
- 7.1 Segment Overview
- 7.1.1 Volume & Revenue Split by Channel (2024 & 2032)
- 7.1.2 Channel Mix Evolution (2024-2032)
Chapter 8. Regional Market Analysis – Global Overview
- 8.1 Global Regional Overview
- 8.1.1 Regional Volume Share
- 8.1.2 Regional Revenue Share
- 8.1.3 Regional Volume by Region
- 8.1.4 Regional Revenue by Region
- 8.1.5 Regional Forecast Through 2032
- 8.2 Cross-Regional Segment Analysis
- 8.2.1 By Distribution Channel
- 8.2.2 By Brand/Price Tier
Chapter 9. North America Computer Aided Manufacturing Market
- 9.1 United States
- 9.2 Canada
- 9.3 Mexico
Chapter 10. Europe Computer Aided Manufacturing Market
- 10.1 Germany
- 10.2 France
- 10.3 Italy
- 10.4 United Kingdom
- 10.5 Spain
- 10.6 Poland
- 10.7 Russia
- 10.8 Netherlands
- 10.9 Belgium
- 10.10 Sweden
- 10.11 Denmark
- 10.12 Norway
- 10.13 Rest of Europe
Chapter 11. Asia Pacific Computer Aided Manufacturing Market
- 11.1 China
- 11.2 India
- 11.3 Japan
- 11.4 South Korea
- 11.5 Thailand
- 11.6 Indonesia
- 11.7 Vietnam
- 11.8 Malaysia
- 11.9 Australia
- 11.10 Rest of Asia Pacific
Chapter 12. Latin America Computer Aided Manufacturing Market
- 12.1 Brazil
- 12.2 Argentina
- 12.3 Colombia
- 12.4 Chile
- 12.5 Rest of Latin America
Chapter 13. Middle East Computer Aided Manufacturing Market
- 13.1 Saudi Arabia
- 13.2 United Arab Emirates
- 13.3 Turkey
- 13.4 Israel
- 13.5 Iran
- 13.6 Rest of the Middle East
Chapter 14. Africa Computer Aided Manufacturing Market
- 14.1 South Africa
- 14.2 Egypt
- 14.3 Nigeria
- 14.4 Morocco
- 14.5 Rest of Africa
Chapter 15. Computer Aided Manufacturing Company Profiles
- 15.1 [Company 01]
- 15.1.1 Company Overview
- 15.1.2 Key Management Personnel
- 15.1.3 Products & Services Portfolio
- 15.1.4 Financial Performance
- 15.1.5 Key Market Focus & Geographic Presence
- 15.1.6 Recent Developments & Strategic Initiatives
Note: The company profile list is preliminary and may change based on research findings, market developments, data availability, and client requirements.
Chapter 16. Appendices
- Appendix A – List of Abbreviations & Acronyms
- Appendix B – Industry Classification Code Reference – Full Series
- Appendix C – Production & Capacity Data Tables
- Appendix D – End-Use & Demand Base Tables
- Appendix E – Consumption & Replacement Rate Assumptions
- Appendix F – ASP Reference Tables
- Appendix G – Manufacturing & Facility Database
- Appendix H – Import-Export Data Tables
- Appendix I – Regulatory Summary Tables
- Appendix J – Primary Research Participant List (Anonymized)
- Appendix K – Primary Research Questionnaire Framework
- Appendix L – Data Sources & Bibliography
- Appendix M – Market Size Divergence & Source Comparison
Chapter 17. Research Methodology
- 17.1 Research Framework & Philosophy
- 17.2 Secondary Research – Sources, Hierarchy & Data Extraction
- 17.3 Data Modeling – Bottom-Up & Top-Down Market Sizing
- 17.4 Primary Research – Stakeholder Framework, LOI & Sample Sizes
- 17.5 Forecast Methodology – Regression, Scenario & Sensitivity Analysis
- 17.6 Quality Control – Four-Layer Validation Framework
- 17.7 Limitations & Standard Assumptions
- 17.8 Disclaimer
