Market Overview
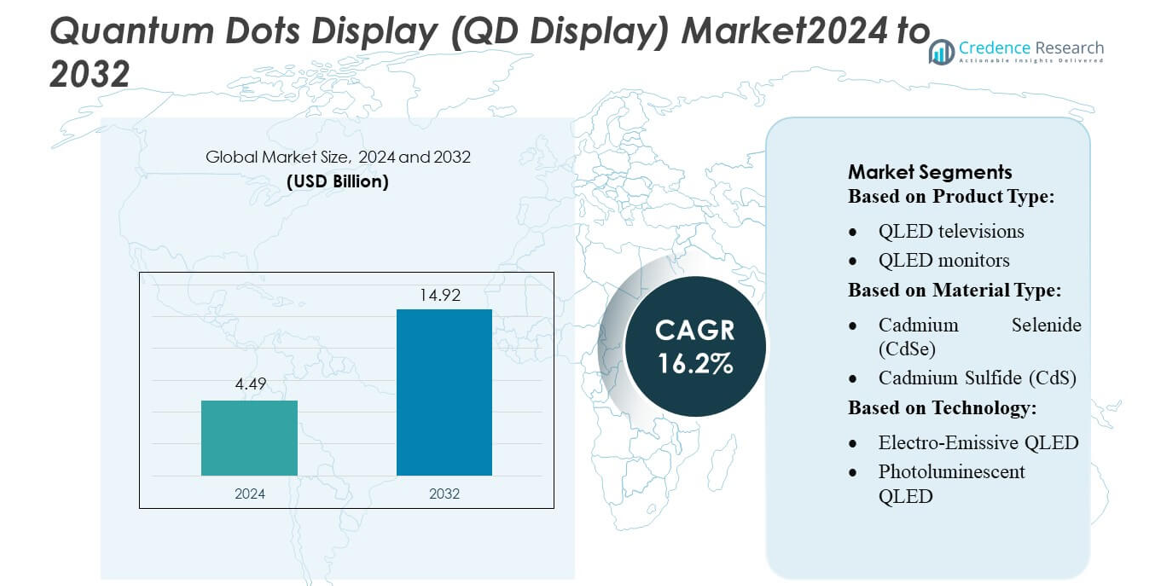
Quantum Dots Display (QD Display) Market size was valued USD 4.49 billion in 2024 and is anticipated to reach USD 14.92 billion by 2032, at a CAGR of 16.2% during the forecast period.
| REPORT ATTRIBUTE |
DETAILS |
| Historical Period |
2020-2023 |
| Base Year |
2024 |
| Forecast Period |
2025-2032 |
| Quantum Dots Display (QD Display) Market Size 2024 |
USD 4.49 billion |
| Quantum Dots Display (QD Display) Market, CAGR |
16.2% |
| Quantum Dots Display (QD Display) Market Size 2032 |
USD 14.92 billion |
The Quantum Dots Display market is led by key companies including The Dow Chemical Company, InVisage Technologies (Apple), Nanoco Group plc, Shoei Electronic Materials, Inc., NN-Labs (NNCrystal US Corporation), Ocean NanoTech, SAMSUNG, QD Laser, QLight Nanotech, and Quantum Materials Corporation. These players drive market growth through extensive R&D, strategic partnerships, and innovations in cadmium-free quantum dots and high-performance QLED technologies. Samsung dominates in high-volume QLED televisions, while other companies focus on material development and niche applications such as quantum dot lighting and flexible displays. Asia-Pacific emerges as the leading region, capturing approximately 35% of the global market, fueled by strong consumer electronics adoption, large-scale manufacturing capabilities, and rising demand for premium displays. Collaborative efforts and technological advancements in this region continue to solidify its leadership position in the QD Display market.
Market Insights
- The Quantum Dots Display (QD Display) market size was valued at USD 4.49 billion in 2024 and is expected to reach USD 14.92 billion by 2032, growing at a CAGR of 16.2% during the forecast period.
- Growth is driven by increasing adoption of QLED televisions, monitors, smartphones, and tablets, as well as demand for cadmium-free and eco-friendly quantum dot materials.
- Key trends include expansion into commercial displays and lighting, development of flexible and foldable QD displays, and continuous innovation in quantum efficiency and color performance.
- The market is competitive, with major players focusing on R&D, strategic partnerships, and technological innovations, while challenges include high production costs and material stability.
- Asia-Pacific leads the market with approximately 35% share due to strong manufacturing capacity and consumer demand, followed by North America and Europe; QLED televisions dominate the product segment, accounting for the largest market share globally.
Access crucial information at unmatched prices!
Request your sample report today & start making informed decisions powered by Credence Research Inc.!
Download Sample
Market Segmentation Analysis:
By Product Type:
The QD Display market is segmented into QLED displays, QLED televisions, QLED monitors, QLED smartphones, QLED tablets, quantum dot lighting, and other products. QLED televisions dominate the product segment, accounting for over 45% of the market share, driven by rising consumer preference for premium displays with enhanced color accuracy, brightness, and energy efficiency. Adoption in the television sector is further fueled by increasing 4K and 8K content availability and smart TV integration. Quantum dot lighting is also witnessing steady growth due to industrial and architectural applications, complementing display adoption across electronics.
- For instance, Lumineq’s TASEL® transparent EL displays operate with an active viewing height (AVH) ELT256.120.90 model has an active display area height of 108 mm (and width of 230.4 mm). The displays maintain a high transparency level, typically ranging from 73% to over 80%, close to that of plain glass.
By Material Type:
Material segmentation includes cadmium-based quantum dots (CdSe, CdS, CdTe), cadmium-free quantum dots (InP, ZnS), silicon-based quantum dots, and graphene quantum dots. Cadmium-free quantum dots, particularly Indium Phosphide (InP), hold the dominant position with a market share exceeding 50%, propelled by regulatory restrictions on cadmium usage in consumer electronics and environmental compliance initiatives. The demand for safer, non-toxic materials in TVs, monitors, and mobile devices supports this sub-segment. Meanwhile, silicon and graphene quantum dots are gaining traction in niche applications due to their tunable optical properties and potential for flexible display integration.
- For instance, Orbit Electronics Group’s Rugged EL displays operate from –40 °C to +71 °C without performance degradation, as documented in the company’s EL product brochure.
By Technology:
The market is segmented into electro-emissive QLED, photoluminescent QLED, and quantum dot enhancement film (QDEF) technologies. QDEF leads the technology segment with a market share of approximately 60%, owing to its compatibility with existing LCD backlighting systems and cost-effective implementation. The strong demand for high-brightness, wide-color-gamut displays in televisions, monitors, and smartphones drives adoption. Electro-emissive QLED is emerging in premium displays, offering self-emissive capabilities, while photoluminescent QLED continues to grow steadily, leveraging improved efficiency in next-generation commercial and industrial display applications.
Key Growth Drivers
Increasing Adoption of QLED Televisions and Premium Displays
The rising consumer preference for high-performance televisions, monitors, and mobile devices is driving growth in the QD Display market. QLED technology offers superior color accuracy, brightness, and energy efficiency, prompting manufacturers to integrate quantum dots into premium products. Expanding 4K and 8K content availability, coupled with smart TV adoption, further boosts demand. The cost-effectiveness of quantum dot enhancement films (QDEF) for backlighting LCD panels accelerates implementation across consumer electronics, making this segment the leading driver of market expansion globally.
- For instance, Nixology’s “Smart Socket” driving modules are used for EL (electroluminescent) displays, allowing a microcontroller to control the switching of a high-voltage AC supply for individual segments. The modules are compatible with 5-volt logic and use a serial interface, typically at 9600 baud, to receive commands.
Regulatory Push for Environmentally Friendly Materials
Stringent environmental regulations on cadmium-based quantum dots are accelerating the adoption of cadmium-free alternatives such as Indium Phosphide (InP) and Zinc Sulfide (ZnS). Manufacturers are increasingly focusing on non-toxic, eco-friendly materials to comply with global standards, particularly in North America, Europe, and Asia-Pacific. This regulatory shift stimulates R&D in safer quantum dot solutions, enhancing market acceptance in consumer electronics, lighting, and industrial applications. The demand for sustainable materials ensures long-term growth and supports the replacement of conventional display technologies.
- For instance, DRR USA EV Safari 4×4 is an all-electric All-Terrain Vehicle (ATV). It is designed for off-road use, including trails, farms, and job sites, and is noted for its silent operation and zero emissions.
Advancements in Quantum Dot Manufacturing and Technology
Technological advancements in quantum dot synthesis and display integration are key growth drivers. Improved quantum efficiency, stability, and uniformity in cadmium-free and self-emissive QLEDs enhance product performance. Innovations such as electro-emissive QLEDs and flexible quantum dot displays are expanding applications in smartphones, tablets, and wearable devices. Concurrently, scalable production techniques reduce costs, enabling wider adoption across both consumer and commercial sectors. Continuous innovation strengthens the market’s competitive landscape and positions quantum dots as a preferred solution for next-generation display technologies.
Key Trends & Opportunities
Expansion of QD Lighting and Commercial Displays
Quantum dot technology is extending beyond consumer electronics into commercial lighting, signage, and architectural applications. QD-based lighting offers high color rendering, energy efficiency, and long operational life, creating opportunities in offices, retail spaces, and smart cities. The increasing focus on high-quality, sustainable illumination solutions positions quantum dot lighting as a complementary growth segment. Additionally, the integration of quantum dots in public displays and professional monitors provides manufacturers avenues to diversify product portfolios and increase market penetration.
- For instance, Eco Charger’s Lithium POWER 4WD quad uses a bespoke 72 V lithium-ion battery pack and drives power through a selectable 4WD shaft-driven chassis with lockable front differential.
Integration with Next-Generation Mobile and Flexible Devices
Quantum dots are increasingly being integrated into smartphones, tablets, and wearable devices due to their thin form factor, high brightness, and superior color gamut. Flexible and foldable displays leverage quantum dots to maintain image quality while enabling innovative form factors. This trend provides opportunities for device makers to differentiate products in a competitive market and attract premium consumers. Growing consumer demand for immersive viewing experiences and portable entertainment further accelerates adoption, creating a lucrative growth pathway for QD technology in mobile electronics.
- For instance, Panasonic Corporation’s TOUGHBOOK 40 is officially certified to meet MIL-STD-810H standards. This is a military standard covering a wide range of ruggedness tests, including drops, shocks, and vibrations.
Regional Market Expansion and Strategic Collaborations
Emerging markets in Asia-Pacific and Latin America are witnessing rapid adoption of QD displays due to rising disposable incomes and increasing consumer electronics penetration. Companies are entering strategic collaborations and licensing agreements to enhance production capacity and distribution networks. These initiatives allow manufacturers to address regional preferences, expand product availability, and reduce costs. Growing investments in R&D and regional partnerships provide opportunities to introduce innovative QD display products, strengthening market share and driving revenue growth across high-potential international markets.
Key Challenges
High Production Costs and Scalability Issues
The production of high-quality quantum dots, particularly cadmium-free variants, remains cost-intensive due to complex synthesis processes and stringent quality control requirements. Scaling manufacturing to meet growing demand while maintaining efficiency and uniformity presents a challenge for suppliers. High costs can limit adoption in price-sensitive markets, particularly in emerging regions. Manufacturers must invest in advanced production techniques and supply chain optimization to reduce unit costs, improve yield, and sustain competitive pricing, balancing profitability with market expansion.
Technological Limitations and Device Integration Constraints
Despite advancements, quantum dot integration faces technical limitations, including material stability under prolonged use, blue light efficiency, and compatibility with existing LCD and OLED technologies. These constraints can impact display lifespan, color consistency, and overall performance. Device manufacturers must carefully optimize QD film thickness, encapsulation, and thermal management to prevent degradation. Overcoming these integration challenges is critical to sustaining market growth, as product reliability and user experience remain decisive factors in adoption, especially in high-end televisions, monitors, and mobile devices.
Regional Analysis
North America:
North America holds a significant share of the QD Display market, accounting for approximately 28% in 2024, driven by strong consumer adoption of premium QLED televisions, monitors, and mobile devices. The U.S. leads the regional demand due to high disposable incomes, early adoption of advanced display technologies, and increasing content availability in 4K and 8K resolutions. Technological innovation by major players and the regulatory push toward cadmium-free quantum dots further bolster market growth. Investments in R&D and collaborations with electronics manufacturers strengthen the region’s position, while rising demand for QD-based professional displays supports sustained expansion in North America.
Europe:
Europe represents nearly 22% of the global QD Display market, fueled by environmentally conscious adoption of cadmium-free quantum dots and energy-efficient QLED displays. Germany, the U.K., and France drive regional growth through high consumer spending on premium TVs, monitors, and smart devices. Policy frameworks promoting sustainable materials and electronic waste management accelerate demand for eco-friendly QD solutions. Technological advancements in QDEF-based displays and collaborations with leading electronics brands enhance regional market penetration. The growing emphasis on immersive entertainment experiences, combined with increasing commercial display adoption in corporate and retail sectors, supports Europe’s steady market expansion.
Asia-Pacific:
Asia-Pacific dominates the global QD Display market with a share exceeding 35%, led by China, South Korea, and Japan. The region benefits from robust consumer electronics manufacturing, rising disposable incomes, and rapid adoption of QLED televisions, monitors, and mobile devices. Strong government support for technological innovation, coupled with the presence of major display manufacturers, drives regional growth. Increasing demand for high-brightness, wide-color-gamut displays in both consumer and commercial segments further fuels expansion. Strategic collaborations between local and international companies, along with scalable production of cadmium-free quantum dots, position Asia-Pacific as the fastest-growing market globally.
Latin America:
Latin America accounts for approximately 7% of the QD Display market, with growth driven by rising urbanization, expanding middle-class populations, and increasing penetration of smart TVs and mobile devices. Brazil and Mexico lead regional adoption, supported by growing consumer awareness of advanced display technologies. Demand for energy-efficient and premium-quality QLED displays is rising across residential and commercial applications. Challenges such as limited local manufacturing and higher import costs are mitigated by collaborations with international electronics brands. Market expansion is further supported by investments in retail infrastructure, technology upgrades, and gradual adoption of environmentally compliant cadmium-free quantum dot materials.
Middle East & Africa:
The Middle East & Africa contributes roughly 8% to the global QD Display market, driven by growing demand for premium televisions, monitors, and commercial displays in the UAE, Saudi Arabia, and South Africa. Increasing disposable income, urbanization, and expansion of modern retail channels support market growth. Adoption of cadmium-free QD technology is promoted by environmental awareness and regulatory standards. The market also benefits from government initiatives to modernize educational, commercial, and public infrastructure with advanced display solutions. Rising investments in luxury consumer electronics and collaborations with global manufacturers position the region for steady growth over the forecast period.
Market Segmentations:
By Product Type:
- QLED televisions
- QLED monitors
By Material Type:
- Cadmium Selenide (CdSe)
- Cadmium Sulfide (CdS)
By Technology:
- Electro-Emissive QLED
- Photoluminescent QLED
By Geography
- North America
- Europe
- Germany
- France
- U.K.
- Italy
- Spain
- Rest of Europe
- Asia Pacific
- China
- Japan
- India
- South Korea
- South-east Asia
- Rest of Asia Pacific
- Latin America
- Brazil
- Argentina
- Rest of Latin America
- Middle East & Africa
- GCC Countries
- South Africa
- Rest of the Middle East and Africa
Competitive Landscape
The QD Display market include The Dow Chemical Company, InVisage Technologies (Apple), Nanoco Group plc, Shoei Electronic Materials, Inc., NN-Labs (NNCrystal US Corporation), Ocean NanoTech, SAMSUNG, QD Laser, QLight Nanotech, and Quantum Materials Corporation. The Quantum Dots Display market is highly competitive, driven by rapid technological innovation, increasing consumer demand for high-performance displays, and expansion into emerging markets. Companies are focusing on product differentiation through superior color accuracy, brightness, and energy efficiency, as well as developing cadmium-free and eco-friendly quantum dot materials. Strategic initiatives such as partnerships, licensing agreements, and investments in advanced manufacturing processes enhance market reach and production capabilities. The adoption of next-generation technologies, including electro-emissive QLEDs, quantum dot enhancement films, and flexible displays, further intensifies competition. Continuous R&D and efforts to optimize cost-efficiency and scalability remain central to maintaining market leadership and capturing growth opportunities in both consumer electronics and commercial display segments.
Shape Your Report to Specific Countries or Regions & Enjoy 30% Off!
Key Player Analysis
- QD Laser
- Nanoco Group plc
- SAMSUNG
- NN-Labs (NNCrystal US Corporation)
- InVisage Technologies (Apple)
- Quantum Materials Corporation
- QLight Nanotech
- The Dow Chemical Company
- Shoei Electronic Materials, Inc.
- Ocean NanoTech
Recent Developments
- In May 2025, Samsung Electronics announced that its latest lineup of QLED TVs has received ‘Real Quantum Dot Display’ certification from TÜV Rheinland, an international certification organization based in Germany. The certification verifies that Samsung’s QLED TVs meet global standards for quantum dot display structure, reinforcing the company’s technological leadership in the premium TV market.
- In March 2025, New research by Curtin University has achieved a breakthrough in eco-friendly display technology, creating highly efficient and stable blue quantum dot LEDs. Researchers created a highly efficient and stable blue quantum dot LEDs (QLEDs) that could power the next-generation televisions, smartphones, VR headsets, and energy-efficient lighting.
- In February 2025, UbiQD acquired BlueDot Photonics, a Seattle-based company, to expand its solar innovation by integrating BlueDot’s perovskite-based quantum cutting technology. This acquisition, which includes the intellectual property developed at the University of Washington, aims to increase the efficiency of silicon solar panels by converting high-energy photons into a greater number of lower-energy photons, thereby lowering the cost of solar energy
Report Coverage
The research report offers an in-depth analysis based on Product Type, Material Type, Technology and Geography. It details leading market players, providing an overview of their business, product offerings, investments, revenue streams, and key applications. Additionally, the report includes insights into the competitive environment, SWOT analysis, current market trends, as well as the primary drivers and constraints. Furthermore, it discusses various factors that have driven market expansion in recent years. The report also explores market dynamics, regulatory scenarios, and technological advancements that are shaping the industry. It assesses the impact of external factors and global economic changes on market growth. Lastly, it provides strategic recommendations for new entrants and established companies to navigate the complexities of the market.
Future Outlook
- Demand for QD displays is expected to grow steadily across televisions, monitors, and mobile devices.
- Adoption of cadmium-free quantum dots will accelerate due to environmental regulations and consumer awareness.
- Flexible and foldable QD displays will gain traction in smartphones, tablets, and wearable devices.
- Advancements in quantum efficiency and color performance will drive premium product adoption.
- Integration of QD technology in commercial displays and lighting will expand market opportunities.
- Asia-Pacific will remain the fastest-growing region due to manufacturing capacity and rising consumer demand.
- Strategic collaborations and partnerships will increase to strengthen global production and distribution.
- R&D investments will focus on improving stability, scalability, and cost-efficiency of QD materials.
- Next-generation electro-emissive and photoluminescent QLED technologies will enhance market competitiveness.
- Overall, the market will experience continuous innovation and diversification across applications and regions.


