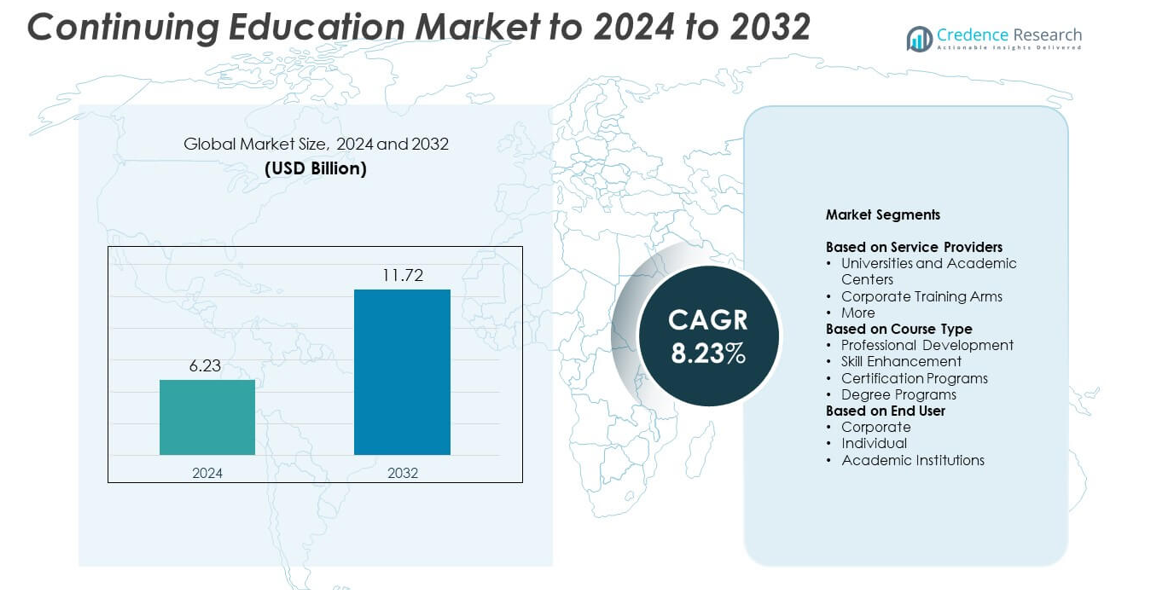
Continuing Education Market By Delivery Mode (Classroom Learning, E-learning, Regularly Schedules Series, Journals, and Others), By Profession (Healthcare Workers, Engineers, Accountants, Educators, Architects, Lawyers and other), By End User (Students, Professionals) Growth, Future Prospects & Competitive Analysis, 2024 – 2032

Price: $4999

Published: | Report ID: 17847 | Report Format : PDF

Key Highlights of the report

How are the major segments performing in the Continuing Education market?

  • In 2022, the E-learning segment accounted for the largest share of the market as it is widely offering a wide range of educational content, including interactive modules, multimedia presentations, videos, quizzes, and assessments.
  • In 2022, the Healthcare Workers segment was anticipated to hold a prominent share in the global Continuing Education market as it is Healthcare is a field that continuously evolves with new research findings, medical treatments, and technological advancements.
  • In 2022, the educational institutions segment was anticipated to hold a prominent share in the global Continuing Education market as offer a diverse range of courses and programs tailored to different industries and professions.

What is the Market Size of Continuing Education regarding value?

The global Continuing Education market is anticipated to grow at a substantial CAGR of 10.25% in the upcoming years. The global Continuing Education industry was estimated to be worth USD 37,415.69 million in 2023 and was expected to be worth USD 90,045.32 million by 2032.

Design Element 2

Access crucial information at unmatched prices!

Request your free sample report today & start making informed decisions powered by Credence Research!

Download Free Sample
CTA Design Element 3

Which region dominated the Continuing Education market?

In 2022, the North American region was anticipated to hold a prominent share in the global Continuing Education market. In the U.S., has a strong and well-established education system with renowned universities, colleges, and training institutions. The region is home to many prestigious educational institutions that offer a wide range of continuing education programs and courses.

Which are the key countries in the Continuing Education market?

In 2022, the Germany was anticipated to hold a prominent share in the global Continuing Education market. In Germany, there is a strong emphasis on professional development and lifelong learning. Professionals in various fields, such as healthcare, business, technology, and engineering, seek continuing education to stay updated with the latest industry trends, maintain certifications, and enhance their career prospects.

In 2022, the China was anticipated to hold a prominent share in the global Continuing Education market. The Indian government has launched various digital initiatives to promote e-learning and digital literacy. One prominent example is the Digital India campaign, which aims to transform India into a digitally empowered society and knowledge economy. These initiatives have created awareness and provided infrastructure support for online learning, including continuing education programs.

How is the economy impacting the global Continuing Education growth?

The transition towards online learning across many industries, including continuing education, has been expedited by the pandemic. Traditional classroom-based learning was made difficult by social isolation policies and limitations on in-person gatherings. In order to offer online continuing education programmes, educational institutions and training companies swiftly adapted to remote learning methods. Due to the shift to online learning, continuing education opportunities are now more readily available and accessible because students may easily access educational resources from their homes.

What is the competitive environment of the Continuing Education market?

The Continuing Education industry’s competitive environment provides information on the entire economic profit made by suppliers and businesses, the sales and revenues created in this sector, the Continuing Education market share globally, the business organization summary, the introduction of new products, and the opportunities for the industrial Continuing Education market. For instance, in February 2022, Coursera announced a collaboration with the University of Chicago to launch a Master of Science in Analytics degree program. This partnership showcases the competition among online platforms to team up with prestigious institutions to offer recognized credentials and attract learners seeking advanced education. Also, In March 2022, LinkedIn Learning announced the addition of over 100 new courses to its library, covering a wide range of topics, including leadership, data science, programming, and digital marketing. This expansion demonstrates the competitive nature of the market, with platforms striving to offer diverse and relevant courses to attract learners.

Executive Summary

What are the key trends in the Continuing Education market?

  • The advancement of technology, widespread internet access, and the COVID-19 pandemic have accelerated the adoption of online learning methods.
  • The focus of continuing education has shifted towards acquiring practical skills that align with industry needs and job market demands.
  • The continuing education market has witnessed increased collaboration between educational institutions, training providers, and corporations.

How are educational institutions Teaming Up with Stakeholders in Continuing Education Market?

To provide pertinent and sector-specific continuing education programmes, educational institutions work with partners in industry, such as businesses, associations, and organisations. Through these collaborations, universities are better able to match their curricula to market trends and make sure that the information is useful and applicable to real-world situations. Industry partners may make suggestions for programme design, help with the creation of course materials, and deliver guest lectures or workshops tailored to their particular industries. In order to align their continuing education programmes with the specifications and standards established by these organisations, educational institutions frequently collaborate closely with certification and licencing authorities. Institutions can offer courses that give students the credentials they need to succeed in the workplace by collaborating with these organisations. This partnership guarantees that the programmes adhere to the relevant professional and regulatory standards and allows students to improve their employment chances.

Continuing Education Market

Which are the key investments by the Continuing Education market players?

Leading players operating in the Continuing Education market are focusing on key investments to enhance their offerings, expand their reach, and provide a seamless learning experience. For instance in march 2021, Udemy, a popular online learning platform, has attracted significant investments from various sources. It secured $50 million in funding from Learn Capital and a Series F financing round. This investment is aimed at further expanding Udemy’s course offerings, improving its platform, and enhancing the learning experience for its users.

Some major players in the Continuing Education market are 360 Training, Coursera, Udemy, LinkedIn Learning, Skillsoft , Pluralsight ,Rosetta Stone ,Duolingo, Project Management Institute (PMI), Kaplan, Codecademy, General Assembly, The Princeton Review, Magoosh, HealthStream, Others

What are the Major Driving Factors for the Continuing Education Market?

The increased need for worker upskilling and reskilling is a key driver driving the market for continuing education. Rapid technological development, automation, and digital transformation have changed the kinds of jobs that are needed and the skillsets that are required in different industries. As a result, in order to stay current, develop their skill sets, and improve their employability, professionals and individuals are looking for chances for continuous learning. The demand for upskilling and reskilling arises from several factors. First, technological advancements are disrupting traditional job roles and creating a need for new skills.

What are the Major Risks for the Continuing Education Market?

The price of obtaining education and professional development is a major barrier for the market for continuing education. The cost of continuing education programmes, particularly those provided by recognised institutions and organisations, is frequently a substantial barrier for people looking to advance their knowledge and abilities. The cost of continuing education can include tuition fees, course materials, certification exams, and other related expenses. These costs can add up, particularly for individuals who wish to pursue multiple courses or programs over time. Financial constraints may prevent some individuals from accessing the educational resources and opportunities they desire, thereby limiting their ability to upskill or reskill.

Which is the key application in the Continuing Education market?

The traditional method of learning that takes place in physical classrooms or educational institutions is referred to as the classroom learning portion of the continuing education industry. It incorporates direct contact between teachers and students, resulting in a controlled and all-encompassing learning environment. It offers several advantages that make it a preferred choice for many individuals seeking continuing education. Firstly, it allows for direct interaction with instructors and fellow learners, promoting engagement and active participation. Learners have the opportunity to ask questions, seek clarifications, and engage in discussions, fostering a deeper understanding of the subject matte..

How is the Continuing Education market performing in regions?

Asia Pacific market is anticipated to witness fastest growth in the global Continuing Education market during the forecast period. One key factor contributing to the popularity of online continuing education programs in Asia Pacific is the region’s robust technological infrastructure. Countries like China, India, Japan, South Korea, and Singapore have made significant investments in internet connectivity and digital infrastructure, ensuring widespread access to the internet. This infrastructure has created a conducive environment for e-learning platforms to thrive and has enabled learners to access educational resources conveniently from anywhere at any time. Hence, all of these elements are responsible for driving the market revenue growth of the region during the forecast period.

What is the regulatory landscape for the Continuing Education market?

Systems of accreditation have been set up in several nations to guarantee the validity and excellence of continuing education programmes. On the basis of a set of requirements, accreditation agencies assess and approve educational institutions, programmes, and courses. The confidence that their education satisfies particular requirements is provided to students by accreditation. Certain occupations may additionally need professional certifications and licences, and continuing education programmes must meet the standards established by relevant professional associations.

Shape Your Report to Specific Countries or Regions & Enjoy 30% Off!

What are the major players planning for the future of the Continuing Education market?

Growing regional existence and investment in downstream applications are anticipated to deliver a competitive edge in the market. For instance, in 2020, Vista Equity Partners, a leading investment firm, announced a substantial USD 3.5 billion investment in Pluralsight. This investment has provided Pluralsight with a substantial capital infusion to accelerate its growth initiatives. With this funding, Pluralsight has been able to expand its course offerings, develop new content, enhance its learning platform, and make strategic acquisitions to further strengthen its position in the technology-focused continuing education market.

REPORT ATTRIBUTE DETAILS
Continuing Education Market by Volume No
Continuing Education Market by Value Yes
Continuing Education Market, Tornado Analysis Yes
Continuing Education Market, STAR Analysis Yes
Continuing Education Market, SRC Analysis Yes
Continuing Education Market, Import-Export Data Yes (On Demand)
Continuing Education Market Pricing Analysis Yes (On Demand)
Continuing Education Market Segment Analysis By Delivery Mode (Classroom Learning, E-learning, Regularly Schedules Series, Journals, and Others)

By Profession (Healthcare Workers, Engineers, Accountants, Educators, Architects, Lawyers and other)

By Providers (Educational Institutions, Educational Companies, Non-profit Organizations and Others)

Continuing Education Market, Regional Analysis North America (US, Canada, Mexico)

Europe (Germany, UK, France, Italy, Spain, and Rest of Europe)

Asia Pacific (China, India, Japan, South Korea, South East Asia, and Rest of Asia Pacific)

Latin America (Brazil, Argentina, and Rest of Latin America)

Middle East and Africa (GCC Countries, South Africa, and Rest of Middle East and Africa)

Continuing Education Market Key Companies 360training, Aceable, Acadoodle, Albert Einstein College of Medicine, Advancement Courses,

Antidote Education Company, AMA EDHUB

AO North America, AcademicCME, AffinityCE, Amedco, American Medical Seminar, AXIS Medical Education, Aspirus, BooqSmart.com

Continuing Education Market Competitive Landscape Market Share Analysis

Competitive Benchmarking

Key Players Market Positioning

Geographical Presence Analysis

Major Strategies Adopted

Segmentation of Global Continuing Education Market-

Global Continuing Education Market – By Delivery Modes

  • Classroom Learning
  • E-learning
  • Regularly Schedules Series
  • Journals, and Others
  • Others

Global Continuing Education Market – By Profession

  • Healthcare Workers
  • Engineers
  • Accountants
  • Educators
  • Architects
  • Lawyers, and Others

Global Continuing Education Market – By Providers

  • Educational Institutions
  • Educational Companies
  • Non-profit Organizations
  • Others

Global Continuing Education Market – By End User

  • Students
  • Professionals

Global Continuing Education Market – By Region

  • North America
    • U.S.
    • Canada
    • Mexico
  • Europe
    • Germany
    • France
    • U.K.
    • Italy
    • Spain
    • Rest of Europe
  • Asia Pacific
    • China
    • Japan
    • India
    • South Korea
    • South-east Asia
    • Rest of Asia Pacific
  • Latin America
    • Brazil
    • Argentina
    • Rest of Latin America
  • Middle East & Africa
    • GCC Countries
    • South Africa
    • Rest of Middle East and Africa

Table of Content

Chapter No. 1 :………. Introduction.. 26

1.1.1.  Report Description. 26

Purpose of the Report. 26

USP & Key Offerings. 26

1.1.2.  Key Benefits for Stakeholders. 26

1.1.3.  Target Audience. 27

1.1.4.  Report Scope   27

1.1.5.  Regional Scope   28

Chapter No. 2 :………. Executive Summary. 29

2.1.     Continuing Education Market Snapshot. 29

2.1.1.  Global Continuing Education Market, 2018 – 2032 (USD Million). 30

Chapter No. 3 :………. Geopolitical Crisis Impact Analysis. 31

3.1.     Russia-Ukraine and Israel-Palestine War Impacts. 31

Chapter No. 4 :………. Continuing Education Market – Industry Analysis. 32

4.1.     Introduction   32

4.2.     Market Drivers  33

4.2.1.  Driving Factor 1 Analysis. 33

4.2.2.  Driving Factor 2 Analysis. 34

4.3.     Market Restraints. 35

4.3.1.  Restraining Factor Analysis. 35

4.4.     Market Opportunities. 36

4.4.1.  Market Opportunity Analysis. 36

4.5.     Porter’s Five Forces Analysis. 37

4.6.     Value Chain Analysis. 38

4.7.     Buying Criteria  39

Chapter No. 5 :………. Analysis Competitive Landscape. 40

5.1.     Company Market Share Analysis – 2023. 40

5.1.1.  Global Continuing Education Market: Company Market Share, by Volume, 2023. 40

5.1.2.  Global Continuing Education Market: Company Market Share, by Revenue, 2023. 41

5.1.3.  Global Continuing Education Market: Top 6 Company Market Share, by Revenue, 2023. 41

5.1.4.  Global Continuing Education Market: Top 3 Company Market Share, by Revenue, 2023. 42

5.2.     Global Continuing Education Market Company Volume Market Share, 2023. 43

5.3.     Global Continuing Education Market Company Revenue Market Share, 2023. 44

5.4.     Company Assessment Metrics, 2023. 45

5.4.1.  Stars  45

5.4.2.  Emerging Leaders. 45

5.4.3.  Pervasive Players. 45

5.4.4.  Participants  45

5.5.     Start-ups /SMEs Assessment Metrics, 2023. 45

5.5.1.  Progressive Companies. 45

5.5.2.  Responsive Companies. 45

5.5.3.  Dynamic Companies. 45

5.5.4.  Starting Blocks  45

5.6.     Strategic Developments. 46

5.6.1.  Acquisitions & Mergers. 46

New Product Launch. 46

Regional Expansion. 46

5.7.     Key Players Product Matrix. 47

Chapter No. 6 :………. PESTEL & Adjacent Market Analysis. 48

6.1.     PESTEL  48

6.1.1.  Political Factors. 48

6.1.2.  Economic Factors. 48

6.1.3.  Social Factors  48

6.1.4.  Technological Factors. 48

6.1.5.  Environmental Factors. 48

6.1.6.  Legal Factors  48

6.2.     Adjacent Market Analysis. 48

Chapter No. 7 :………. Continuing Education Market – By Delivery Modes Segment Analysis  49

7.1.     Continuing Education Market Overview, by Delivery Modes Segment. 49

7.1.1.  Continuing Education Market Revenue Share, By Delivery Modes, 2023 & 2032. 50

7.1.2.  Continuing Education Market Attractiveness Analysis, By Delivery Modes. 51

7.1.3.  Incremental Revenue Growth Opportunity, by Delivery Modes, 2024 – 2032. 51

7.1.4.  Continuing Education Market Revenue, By Delivery Modes, 2018, 2023, 2027 & 2032. 52

7.2.     Classroom Learning. 53

7.2.1.  Global Classroom Learning Continuing Education Market Revenue, By Region, 2018 – 2023 (USD Million)  54

7.2.2.  Global Classroom Learning Continuing Education Market Revenue, By Region, 2024 – 2032 (USD Million)  54

7.3.     E-learning  55

7.3.1.  Global E-learning Continuing Education Market Revenue, By Region, 2018 – 2023 (USD Million)  56

7.3.2.  Global E-learning Continuing Education Market Revenue, By Region, 2024 – 2032 (USD Million)  56

7.4.     Regularly Schedules Series. 57

7.4.1.  Global Regularly Schedules Series Continuing Education Market Revenue, By Region, 2018 – 2023 (USD Million)  58

7.4.2.  Global Regularly Schedules Series Continuing Education Market Revenue, By Region, 2024 – 2032 (USD Million)  58

7.5.     Journals  59

7.5.1.  Global Journals Continuing Education Market Revenue, By Region, 2018 – 2023 (USD Million)  60

7.5.2.  Global Journals Continuing Education Market Revenue, By Region, 2024 – 2032 (USD Million)  60

7.6.     Others  61

7.6.1.  Global Others Continuing Education Market Revenue, By Region, 2018 – 2023 (USD Million)  62

7.6.2.  Global Others Continuing Education Market Revenue, By Region, 2024 – 2032 (USD Million)  62

Chapter No. 8 :………. Continuing Education Market – By Profession Segment Analysis  63

8.1.     Continuing Education Market Overview, by Profession Segment. 63

8.1.1.  Continuing Education Market Revenue Share, By Profession, 2023 & 2032. 64

8.1.2.  Continuing Education Market Attractiveness Analysis, By Profession. 65

8.1.3.  Incremental Revenue Growth Opportunity, by Profession, 2024 – 2032. 65

8.1.4.  Continuing Education Market Revenue, By Profession, 2018, 2023, 2027 & 2032. 66

8.2.     Healthcare Workers. 67

8.2.1.  Global Healthcare Workers Continuing Education Market Revenue, By Region, 2018 – 2023 (USD Million)  68

8.2.2.  Global Healthcare Workers Continuing Education Market Revenue, By Region, 2024 – 2032 (USD Million)  68

8.3.     Engineers  69

8.3.1.  Global Engineers Continuing Education Market Revenue, By Region, 2018 – 2023 (USD Million)  70

8.3.2.  Global Engineers Continuing Education Market Revenue, By Region, 2024 – 2032 (USD Million)  70

8.4.     Accountants  71

8.4.1.  Global Accountants Continuing Education Market Revenue, By Region, 2018 – 2023 (USD Million)  72

8.4.2.  Global Accountants Continuing Education Market Revenue, By Region, 2024 – 2032 (USD Million)  72

8.5.     Educators  73

8.5.1.  Global Educators Continuing Education Market Revenue, By Region, 2018 – 2023 (USD Million)  74

8.5.2.  Global Educators Continuing Education Market Revenue, By Region, 2024 – 2032 (USD Million)  74

8.6.     Architects & Lawyers. 75

8.6.1.  Global Architects & Lawyers Continuing Education Market Revenue, By Region, 2018 – 2023 (USD Million)  76

8.6.2.  Global Architects & Lawyers Continuing Education Market Revenue, By Region, 2024 – 2032 (USD Million)  76

Chapter No. 9 :………. Continuing Education Market – By End-user Segment Analysis  77

9.1.     Continuing Education Market Overview, by End-user Segment. 77

9.1.1.  Continuing Education Market Revenue Share, By End-user, 2023 & 2032. 78

9.1.2.  Continuing Education Market Attractiveness Analysis, By End-user. 79

9.1.3.  Incremental Revenue Growth Opportunity, by End-user, 2024 – 2032. 79

9.1.4.  Continuing Education Market Revenue, By End-user, 2018, 2023, 2027 & 2032. 80

9.2.     Students  81

9.2.1.  Global Students Continuing Education Market Revenue, By Region, 2018 – 2023 (USD Million)  82

9.2.2.  Global Students Continuing Education Market Revenue, By Region, 2024 – 2032 (USD Million)  82

9.3.     Professionals  83

9.3.1.  Global Professionals Continuing Education Market Revenue, By Region, 2018 – 2023 (USD Million)  84

9.3.2.  Global Professionals Continuing Education Market Revenue, By Region, 2024 – 2032 (USD Million)  84

Chapter No. 10 :…….. Continuing Education Market – By Providers Segment Analysis  85

10.1.   Continuing Education Market Overview, by Providers Segment. 85

10.1.1. Continuing Education Market Revenue Share, By Providers, 2023 & 2032. 86

10.1.2. Continuing Education Market Attractiveness Analysis, By Providers. 87

10.1.3. Incremental Revenue Growth Opportunity, by Providers, 2024 – 2032. 87

10.1.4. Continuing Education Market Revenue, By Providers, 2018, 2023, 2027 & 2032. 88

10.2.   Educational Institutions. 89

10.2.1. Global Educational Institutions Continuing Education Market Revenue, By Region, 2018 – 2023 (USD Million)  90

10.2.2. Global Educational Institutions Continuing Education Market Revenue, By Region, 2024 – 2032 (USD Million)  90

10.3.   Educational Companies. 91

10.3.1. Global Educational Companies Continuing Education Market Revenue, By Region, 2018 – 2023 (USD Million)  92

10.3.2. Global Educational Companies Continuing Education Market Revenue, By Region, 2024 – 2032 (USD Million)  92

10.4.   Non-profit Organizations. 93

10.4.1. Global Non-profit Organizations Continuing Education Market Revenue, By Region, 2018 – 2023 (USD Million)  94

10.4.2. Global Non-profit Organizations Continuing Education Market Revenue, By Region, 2024 – 2032 (USD Million)  94

Chapter No. 11 :…….. Continuing Education Market – Regional Analysis. 95

11.1.   Continuing Education Market Overview, by Regional Segments. 95

11.2.   Region   96

11.2.1. Global Continuing Education Market Revenue Share, By Region, 2023 & 2032. 96

11.2.2. Continuing Education Market Attractiveness Analysis, By Region. 97

11.2.3. Incremental Revenue Growth Opportunity, by Region, 2024 – 2032. 97

11.2.4. Continuing Education Market Revenue, By Region, 2018, 2023, 2027 & 2032. 98

11.2.5. Global Continuing Education Market Revenue, By Region, 2018 – 2023 (USD Million). 99

11.2.6. Global Continuing Education Market Revenue, By Region, 2024 – 2032 (USD Million). 99

11.3.   Delivery Modes. 100

11.3.1. Global Continuing Education Market Revenue, By Delivery Modes, 2018 – 2023 (USD Million)  100

11.4.   Global Continuing Education Market Revenue, By Delivery Modes, 2024 – 2032 (USD Million)  100

11.5.   Profession   101

11.5.1. Global Continuing Education Market Revenue, By Profession, 2018 – 2023 (USD Million). 101

11.5.2. Global Continuing Education Market Revenue, By Profession, 2024 – 2032 (USD Million). 101

11.6.   End-user  102

11.6.1. Global Continuing Education Market Revenue, By End-user, 2018 – 2023 (USD Million). 102

11.6.2. Global Continuing Education Market Revenue, By End-user, 2024 – 2032 (USD Million). 102

11.7.   Providers  103

11.7.1. Global Continuing Education Market Revenue, By Providers, 2018 – 2023 (USD Million). 103

11.7.2. Global Continuing Education Market Revenue, By Providers, 2024 – 2032 (USD Million). 103

Chapter No. 12 :…….. Continuing Education Market – North America.. 104

12.1.   North America  104

12.1.1. Key Highlights  104

12.1.2. North America Continuing Education Market Revenue, By Country, 2018 – 2023 (USD Million)  105

12.1.3. North America Continuing Education Market Revenue, By Delivery Modes, 2018 – 2023 (USD Million)  106

12.1.4. North America Continuing Education Market Revenue, By Profession, 2018 – 2023 (USD Million)  107

12.1.5. North America Continuing Education Market Revenue, By End-user, 2018 – 2023 (USD Million)  108

12.1.6. North America Continuing Education Market Revenue, By Providers, 2018 – 2023 (USD Million)  109

12.2.   U.S. 110

12.3.   Canada  110

12.4.   Mexico   110

Chapter No. 13 :…….. Continuing Education Market – Europe. 111

13.1.   Europe   111

13.1.1. Key Highlights  111

13.1.2. Europe Continuing Education Market Revenue, By Country, 2018 – 2023 (USD Million). 112

13.1.3. Europe Continuing Education Market Revenue, By Delivery Modes, 2018 – 2023 (USD Million)  113

13.1.4. Europe Continuing Education Market Revenue, By Profession, 2018 – 2023 (USD Million). 114

13.1.5. Europe Continuing Education Market Revenue, By End-user, 2018 – 2023 (USD Million). 115

13.1.6. Europe Continuing Education Market Revenue, By Providers, 2018 – 2023 (USD Million). 116

13.2.   UK   117

13.3.   France   117

13.4.   Germany  117

13.5.   Italy  117

13.6.   Spain   117

13.7.   Russia  117

13.8.   Belgium    117

13.9.   Netherland   117

13.10.  Austria  117

13.11.  Sweden   117

13.12.  Poland   117

13.13.  Denmark  117

13.14.  Switzerland   117

13.15.  Rest of Europe   117

Chapter No. 14 :…….. Continuing Education Market – Asia Pacific. 118

14.1.   Asia Pacific  118

14.1.1. Key Highlights  118

14.1.2. Asia Pacific Continuing Education Market Revenue, By Country, 2018 – 2023 (USD Million)  119

14.1.3. Asia Pacific Continuing Education Market Revenue, By Delivery Modes, 2018 – 2023 (USD Million)  120

14.1.4. Asia Pacific Continuing Education Market Revenue, By Profession, 2018 – 2023 (USD Million)  121

14.1.5. Asia Pacific Continuing Education Market Revenue, By End-user, 2018 – 2023 (USD Million)  122

14.1.6. Asia Pacific Continuing Education Market Revenue, By Providers, 2018 – 2023 (USD Million)  123

14.2.   China  124

14.3.   Japan   124

14.4.   South Korea  124

14.5.   India  124

14.6.   Australia  124

14.7.   Thailand   124

14.8.   Indonesia  124

14.9.   Vietnam    124

14.10.  Malaysia  124

14.11.  Philippines  124

14.12.  Taiwan   124

14.13.  Rest of Asia Pacific. 124

Chapter No. 15 :…….. Continuing Education Market – Latin America.. 125

15.1.   Latin America  125

15.1.1. Key Highlights  125

15.1.2. Latin America Continuing Education Market Revenue, By Country, 2018 – 2023 (USD Million)  126

15.1.3. Latin America Continuing Education Market Revenue, By Delivery Modes, 2018 – 2023 (USD Million)  127

15.1.4. Latin America Continuing Education Market Revenue, By Profession, 2018 – 2023 (USD Million)  128

15.1.5. Latin America Continuing Education Market Revenue, By End-user, 2018 – 2023 (USD Million)  129

15.1.6. Latin America Continuing Education Market Revenue, By Providers, 2018 – 2023 (USD Million)  130

15.2.   Brazil 131

15.3.   Argentina  131

15.4.   Peru   131

15.5.   Chile   131

15.6.   Colombia  131

15.7.   Rest of Latin America. 131

Chapter No. 16 :…….. Continuing Education Market – Middle East. 132

16.1.   Middle East  132

16.1.1. Key Highlights  132

16.1.2. Middle East Continuing Education Market Revenue, By Country, 2018 – 2023 (USD Million)  133

16.1.3. Middle East Continuing Education Market Revenue, By Delivery Modes, 2018 – 2023 (USD Million)  134

16.1.4. Middle East Continuing Education Market Revenue, By Profession, 2018 – 2023 (USD Million)  135

16.1.5. Middle East Continuing Education Market Revenue, By End-user, 2018 – 2023 (USD Million)  136

16.1.6. Middle East Continuing Education Market Revenue, By Providers, 2018 – 2023 (USD Million)  137

16.2.   UAE  138

16.3.   KSA   138

16.4.   Israel 138

16.5.   Turkey  138

16.6.   Iran   138

16.7.   Rest of Middle East. 138

Chapter No. 17 :…….. Continuing Education Market – Africa.. 139

17.1.   Africa  139

17.1.1. Key Highlights  139

17.1.2. Africa Continuing Education Market Revenue, By Country, 2018 – 2023 (USD Million). 140

17.1.3. Africa Continuing Education Market Revenue, By Delivery Modes, 2018 – 2023 (USD Million)  141

17.1.4. Africa Continuing Education Market Revenue, By Profession, 2018 – 2023 (USD Million). 142

17.1.5. Africa Continuing Education Market Revenue, By End-user, 2018 – 2023 (USD Million). 143

17.1.6. Africa Continuing Education Market Revenue, By Providers, 2018 – 2023 (USD Million). 144

17.2.   Egypt  145

17.3.   Nigeria  145

17.4.   Algeria  145

17.5.   Morocco   145

17.6.   Rest of Africa  145

Chapter No. 18 :…….. Company Profiles. 146

18.1.   360 Training  146

18.1.1. Company Overview.. 146

18.1.2. Product Portfolio. 146

18.1.3. Swot Analysis  146

18.1.4. Business Strategy. 147

18.1.5. Financial Overview.. 147

18.2.   Coursera  148

18.3.   Udemy  148

18.4.   LinkedIn Learning. 148

18.5.   Skillsoft  148

18.6.   Pluralsight  148

18.7.   Rosetta Stone   148

18.8.   Duolingo   148

18.9.   Project Management Institute (PMI). 148

18.10.  Kaplan   148

18.11.  Codecademy  148

18.12.  General Assembly. 148

18.13.  The Princeton Review.. 148

18.14.  Magoosh   148

18.15.  HealthStream    148

18.16.  American Red Cross. 148

Chapter No. 19 :…….. Research Methodology. 149

19.1.   Research Methodology. 149

19.1.1. Phase I – Secondary Research. 150

19.1.2. Phase II – Data Modeling. 150

Company Share Analysis Model 151

Revenue Based Modeling. 151

19.1.3. Phase III – Primary Research. 152

19.1.4. Research Limitations. 153

Assumptions. 153


List of Figures

FIG NO. 1………. Global Continuing Education Market Revenue, 2018 – 2032 (USD Million) 29

FIG NO. 2………. Porter’s Five Forces Analysis for Global Continuing Education Market 36

FIG NO. 3………. Value Chain Analysis for Global Continuing Education Market 37

FIG NO. 4………. Company Share Analysis, 2023. 39

FIG NO. 5………. Company Share Analysis, 2023. 40

FIG NO. 6………. Company Share Analysis, 2023. 40

FIG NO. 7………. Company Share Analysis, 2023. 41

FIG NO. 8………. Continuing Education Market – Company Volume  Market Share, 2023. 42

FIG NO. 9………. Continuing Education Market – Company Revenue Market Share, 2023. 43

FIG NO. 10……… Continuing Education Market Revenue Share, By Delivery Modes, 2023 & 2032. 49

FIG NO. 11……… Market Attractiveness Analysis, By Delivery Modes. 50

FIG NO. 12……… Incremental Revenue Growth Opportunity by Delivery Modes, 2024 – 2032. 50

FIG NO. 13……… Continuing Education Market Revenue, By Delivery Modes, 2018, 2023, 2027 & 2032. 51

FIG NO. 14……… Global Continuing Education Market for Classroom Learning, Revenue (USD Million) 2018 – 2032  52

FIG NO. 15……… Global Continuing Education Market for E-learning, Revenue (USD Million) 2018 – 2032. 54

FIG NO. 16……… Global Continuing Education Market for Regularly Schedules Series, Revenue (USD Million) 2018 – 2032  56

FIG NO. 17……… Global Continuing Education Market for Journals, Revenue (USD Million) 2018 – 2032. 58

FIG NO. 18……… Global Continuing Education Market for Others, Revenue (USD Million) 2018 – 2032. 60

FIG NO. 19……… Continuing Education Market Revenue Share, By Profession, 2023 & 2032. 63

FIG NO. 20……… Market Attractiveness Analysis, By Profession. 64

FIG NO. 21……… Incremental Revenue Growth Opportunity by Profession, 2024 – 2032. 64

FIG NO. 22……… Continuing Education Market Revenue, By Profession, 2018, 2023, 2027 & 2032. 65

FIG NO. 23……… Global Continuing Education Market for Healthcare Workers, Revenue (USD Million) 2018 – 2032  66

FIG NO. 24……… Global Continuing Education Market for Engineers, Revenue (USD Million) 2018 – 2032. 68

FIG NO. 25……… Global Continuing Education Market for Accountants, Revenue (USD Million) 2018 – 2032. 70

FIG NO. 26……… Global Continuing Education Market for Educators, Revenue (USD Million) 2018 – 2032. 72

FIG NO. 27……… Global Continuing Education Market for Architects & Lawyers, Revenue (USD Million) 2018 – 2032  74

FIG NO. 28……… Continuing Education Market Revenue Share, By End-user, 2023 & 2032. 77

FIG NO. 29……… Market Attractiveness Analysis, By End-user. 78

FIG NO. 30……… Incremental Revenue Growth Opportunity by End-user, 2024 – 2032. 78

FIG NO. 31……… Continuing Education Market Revenue, By End-user, 2018, 2023, 2027 & 2032. 79

FIG NO. 32……… Global Continuing Education Market for Students, Revenue (USD Million) 2018 – 2032. 80

FIG NO. 33……… Global Continuing Education Market for Professionals, Revenue (USD Million) 2018 – 2032. 82

FIG NO. 34……… Continuing Education Market Revenue Share, By Providers, 2023 & 2032. 85

FIG NO. 35……… Market Attractiveness Analysis, By Providers. 86

FIG NO. 36……… Incremental Revenue Growth Opportunity by Providers, 2024 – 2032. 86

FIG NO. 37……… Continuing Education Market Revenue, By Providers, 2018, 2023, 2027 & 2032. 87

FIG NO. 38……… Global Continuing Education Market for Educational Institutions, Revenue (USD Million) 2018 – 2032  88

FIG NO. 39……… Global Continuing Education Market for Educational Companies, Revenue (USD Million) 2018 – 2032  90

FIG NO. 40……… Global Continuing Education Market for Non-profit Organizations, Revenue (USD Million) 2018 – 2032  92

FIG NO. 41……… Global Continuing Education Market Revenue Share, By Region, 2023 & 2032. 95

FIG NO. 42……… Market Attractiveness Analysis, By Region. 96

FIG NO. 43……… Incremental Revenue Growth Opportunity by Region, 2024 – 2032. 96

FIG NO. 44……… Continuing Education Market Revenue, By Region, 2018, 2023, 2027 & 2032. 97

FIG NO. 45……… North America Continuing Education Market Revenue, 2018 – 2032 (USD Million) 103

FIG NO. 46……… Europe Continuing Education Market Revenue, 2018 – 2032 (USD Million) 110

FIG NO. 47……… Asia Pacific Continuing Education Market Revenue, 2018 – 2032 (USD Million) 117

FIG NO. 48……… Latin America Continuing Education Market Revenue, 2018 – 2032 (USD Million) 124

FIG NO. 49……… Middle East Continuing Education Market Revenue, 2018 – 2032 (USD Million) 131

FIG NO. 50……… Africa Continuing Education Market Revenue, 2018 – 2032 (USD Million) 138

FIG NO. 51……… Research Methodology – Detailed View.. 148

FIG NO. 52……… Research Methodology. 149


List of Tables

TABLE NO. 1. :…. Global Continuing Education Market: Snapshot 27

TABLE NO. 2. :…. Drivers for the Continuing Education Market: Impact Analysis. 31

TABLE NO. 3. :…. Restraints for the Continuing Education Market: Impact Analysis. 33

TABLE NO. 4. :…. Global Classroom Learning Continuing Education Market Revenue, By Region, 2018 – 2023 (USD Million) 52

TABLE NO. 5. :…. Global Classroom Learning Continuing Education Market Revenue, By Region, 2024 – 2032 (USD Million) 52

TABLE NO. 6. :…. Global E-learning Continuing Education Market Revenue, By Region, 2018 – 2023 (USD Million) 54

TABLE NO. 7. :…. Global E-learning Continuing Education Market Revenue, By Region, 2024 – 2032 (USD Million) 54

TABLE NO. 8. :…. Global Regularly Schedules Series Continuing Education Market Revenue, By Region, 2018 – 2023 (USD Million) 56

TABLE NO. 9. :…. Global Regularly Schedules Series Continuing Education Market Revenue, By Region, 2024 – 2032 (USD Million) 56

TABLE NO. 10. :.. Global Journals Continuing Education Market Revenue, By Region, 2018 – 2023 (USD Million) 58

TABLE NO. 11. :.. Global Journals Continuing Education Market Revenue, By Region, 2024 – 2032 (USD Million) 58

TABLE NO. 12. :.. Global Others Continuing Education Market Revenue, By Region, 2018 – 2023 (USD Million) 60

TABLE NO. 13. :.. Global Others Continuing Education Market Revenue, By Region, 2024 – 2032 (USD Million) 60

TABLE NO. 14. :.. Global Healthcare Workers Continuing Education Market Revenue, By Region, 2018 – 2023 (USD Million) 66

TABLE NO. 15. :.. Global Healthcare Workers Continuing Education Market Revenue, By Region, 2024 – 2032 (USD Million) 66

TABLE NO. 16. :.. Global Engineers Continuing Education Market Revenue, By Region, 2018 – 2023 (USD Million) 68

TABLE NO. 17. :.. Global Engineers Continuing Education Market Revenue, By Region, 2024 – 2032 (USD Million) 68

TABLE NO. 18. :.. Global Accountants Continuing Education Market Revenue, By Region, 2018 – 2023 (USD Million) 70

TABLE NO. 19. :.. Global Accountants Continuing Education Market Revenue, By Region, 2024 – 2032 (USD Million) 70

TABLE NO. 20. :.. Global Educators Continuing Education Market Revenue, By Region, 2018 – 2023 (USD Million) 72

TABLE NO. 21. :.. Global Educators Continuing Education Market Revenue, By Region, 2024 – 2032 (USD Million) 72

TABLE NO. 22. :.. Global Architects & Lawyers Continuing Education Market Revenue, By Region, 2018 – 2023 (USD Million) 74

TABLE NO. 23. :.. Global Architects & Lawyers Continuing Education Market Revenue, By Region, 2024 – 2032 (USD Million) 74

TABLE NO. 24. :.. Global Students Continuing Education Market Revenue, By Region, 2018 – 2023 (USD Million) 80

TABLE NO. 25. :.. Global Students Continuing Education Market Revenue, By Region, 2024 – 2032 (USD Million) 80

TABLE NO. 26. :.. Global Professionals Continuing Education Market Revenue, By Region, 2018 – 2023 (USD Million) 82

TABLE NO. 27. :.. Global Professionals Continuing Education Market Revenue, By Region, 2024 – 2032 (USD Million) 82

TABLE NO. 28. :.. Global Educational Institutions Continuing Education Market Revenue, By Region, 2018 – 2023 (USD Million) 88

TABLE NO. 29. :.. Global Educational Institutions Continuing Education Market Revenue, By Region, 2024 – 2032 (USD Million) 88

TABLE NO. 30. :.. Global Educational Companies Continuing Education Market Revenue, By Region, 2018 – 2023 (USD Million) 90

TABLE NO. 31. :.. Global Educational Companies Continuing Education Market Revenue, By Region, 2024 – 2032 (USD Million) 90

TABLE NO. 32. :.. Global Non-profit Organizations Continuing Education Market Revenue, By Region, 2018 – 2023 (USD Million) 92

TABLE NO. 33. :.. Global Non-profit Organizations Continuing Education Market Revenue, By Region, 2024 – 2032 (USD Million) 92

TABLE NO. 34. :.. Global Continuing Education Market Revenue, By Region, 2018 – 2023 (USD Million) 97

TABLE NO. 35. :.. Global Continuing Education Market Revenue, By Region, 2024 – 2032 (USD Million) 97

TABLE NO. 36. :.. Global Continuing Education Market Revenue, By Delivery Modes, 2018 – 2023 (USD Million) 98

TABLE NO. 37. :.. Global Continuing Education Market Revenue, By Delivery Modes, 2024 – 2032 (USD Million) 98

TABLE NO. 38. :.. Global Continuing Education Market Revenue, By Profession, 2018 – 2023 (USD Million) 99

TABLE NO. 39. :.. Global Continuing Education Market Revenue, By Profession, 2024 – 2032 (USD Million) 99

TABLE NO. 40. :.. Global Continuing Education Market Revenue, By End-user, 2018 – 2023 (USD Million) 100

TABLE NO. 41. :.. Global Continuing Education Market Revenue, By End-user, 2024 – 2032 (USD Million) 100

TABLE NO. 42. :.. Global Continuing Education Market Revenue, By Providers, 2018 – 2023 (USD Million) 101

TABLE NO. 43. :.. Global Continuing Education Market Revenue, By Providers, 2024 – 2032 (USD Million) 101

TABLE NO. 44. :.. North America Continuing Education Market Revenue, By Country, 2018 – 2023 (USD Million) 103

TABLE NO. 45. :.. North America Continuing Education Market Revenue, By Country, 2024 – 2032 (USD Million) 103

TABLE NO. 46. :.. North America Continuing Education Market Revenue, By Delivery Modes, 2018 – 2023 (USD Million) 104

TABLE NO. 47. :.. North America Continuing Education Market Revenue, By Delivery Modes, 2024 – 2032 (USD Million) 104

TABLE NO. 48. :.. North America Continuing Education Market Revenue, By Profession, 2018 – 2023 (USD Million) 105

TABLE NO. 49. :.. North America Continuing Education Market Revenue, By Profession, 2024 – 2032 (USD Million) 105

TABLE NO. 50. :.. North America Continuing Education Market Revenue, By End-user, 2018 – 2023 (USD Million) 106

TABLE NO. 51. :.. North America Continuing Education Market Revenue, By End-user, 2024 – 2032 (USD Million) 106

TABLE NO. 52. :.. North America Continuing Education Market Revenue, By Providers, 2018 – 2023 (USD Million) 107

TABLE NO. 53. :.. North America Continuing Education Market Revenue, By Providers, 2024 – 2032 (USD Million) 107

TABLE NO. 54. :.. Europe Continuing Education Market Revenue, By Country, 2018 – 2023 (USD Million) 110

TABLE NO. 55. :.. Europe Continuing Education Market Revenue, By Country, 2024 – 2032 (USD Million) 110

TABLE NO. 56. :.. Europe Continuing Education Market Revenue, By Delivery Modes, 2018 – 2023 (USD Million) 111

TABLE NO. 57. :.. Europe Continuing Education Market Revenue, By Delivery Modes, 2024 – 2032 (USD Million) 111

TABLE NO. 58. :.. Europe Continuing Education Market Revenue, By Profession, 2018 – 2023 (USD Million) 112

TABLE NO. 59. :.. Europe Continuing Education Market Revenue, By Profession, 2024 – 2032 (USD Million) 112

TABLE NO. 60. :.. Europe Continuing Education Market Revenue, By End-user, 2018 – 2023 (USD Million) 113

TABLE NO. 61. :.. Europe Continuing Education Market Revenue, By End-user, 2024 – 2032 (USD Million) 113

TABLE NO. 62. :.. Europe Continuing Education Market Revenue, By Providers, 2018 – 2023 (USD Million) 114

TABLE NO. 63. :.. Europe Continuing Education Market Revenue, By Providers, 2024 – 2032 (USD Million) 114

TABLE NO. 64. :.. Asia Pacific Continuing Education Market Revenue, By Country, 2018 – 2023 (USD Million) 117

TABLE NO. 65. :.. Asia Pacific Continuing Education Market Revenue, By Country, 2024 – 2032 (USD Million) 117

TABLE NO. 66. :.. Asia Pacific Continuing Education Market Revenue, By Delivery Modes, 2018 – 2023 (USD Million) 118

TABLE NO. 67. :.. Asia Pacific Continuing Education Market Revenue, By Delivery Modes, 2024 – 2032 (USD Million) 118

TABLE NO. 68. :.. Asia Pacific Continuing Education Market Revenue, By Profession, 2018 – 2023 (USD Million) 119

TABLE NO. 69. :.. Asia Pacific Continuing Education Market Revenue, By Profession, 2024 – 2032 (USD Million) 119

TABLE NO. 70. :.. Asia Pacific Continuing Education Market Revenue, By End-user, 2018 – 2023 (USD Million) 120

TABLE NO. 71. :.. Asia Pacific Continuing Education Market Revenue, By End-user, 2024 – 2032 (USD Million) 120

TABLE NO. 72. :.. Asia Pacific Continuing Education Market Revenue, By Providers, 2018 – 2023 (USD Million) 121

TABLE NO. 73. :.. Asia Pacific Continuing Education Market Revenue, By Providers, 2024 – 2032 (USD Million) 121

TABLE NO. 74. :.. Latin America Continuing Education Market Revenue, By Country, 2018 – 2023 (USD Million) 124

TABLE NO. 75. :.. Latin America Continuing Education Market Revenue, By Country, 2024 – 2032 (USD Million) 124

TABLE NO. 76. :.. Latin America Continuing Education Market Revenue, By Delivery Modes, 2018 – 2023 (USD Million) 125

TABLE NO. 77. :.. Latin America Continuing Education Market Revenue, By Delivery Modes, 2024 – 2032 (USD Million) 125

TABLE NO. 78. :.. Latin America Continuing Education Market Revenue, By Profession, 2018 – 2023 (USD Million) 126

TABLE NO. 79. :.. Latin America Continuing Education Market Revenue, By Profession, 2024 – 2032 (USD Million) 126

TABLE NO. 80. :.. Latin America Continuing Education Market Revenue, By End-user, 2018 – 2023 (USD Million) 127

TABLE NO. 81. :.. Latin America Continuing Education Market Revenue, By End-user, 2024 – 2032 (USD Million) 127

TABLE NO. 82. :.. Latin America Continuing Education Market Revenue, By Providers, 2018 – 2023 (USD Million) 128

TABLE NO. 83. :.. Latin America Continuing Education Market Revenue, By Providers, 2024 – 2032 (USD Million) 128

TABLE NO. 84. :.. Middle East Continuing Education Market Revenue, By Country, 2018 – 2023 (USD Million) 131

TABLE NO. 85. :.. Middle East Continuing Education Market Revenue, By Country, 2024 – 2032 (USD Million) 131

TABLE NO. 86. :.. Middle East Continuing Education Market Revenue, By Delivery Modes, 2018 – 2023 (USD Million) 132

TABLE NO. 87. :.. Middle East Continuing Education Market Revenue, By Delivery Modes, 2024 – 2032 (USD Million) 132

TABLE NO. 88. :.. Middle East Continuing Education Market Revenue, By Profession, 2018 – 2023 (USD Million) 133

TABLE NO. 89. :.. Middle East Continuing Education Market Revenue, By Profession, 2024 – 2032 (USD Million) 133

TABLE NO. 90. :.. Middle East Continuing Education Market Revenue, By End-user, 2018 – 2023 (USD Million) 134

TABLE NO. 91. :.. Middle East Continuing Education Market Revenue, By End-user, 2024 – 2032 (USD Million) 134

TABLE NO. 92. :.. Middle East Continuing Education Market Revenue, By Providers, 2018 – 2023 (USD Million) 135

TABLE NO. 93. :.. Middle East Continuing Education Market Revenue, By Providers, 2024 – 2032 (USD Million) 135

TABLE NO. 94. :.. Africa Continuing Education Market Revenue, By Country, 2018 – 2023 (USD Million) 138

TABLE NO. 95. :.. Africa Continuing Education Market Revenue, By Country, 2024 – 2032 (USD Million) 138

TABLE NO. 96. :.. Africa Continuing Education Market Revenue, By Delivery Modes, 2018 – 2023 (USD Million) 139

TABLE NO. 97. :.. Africa Continuing Education Market Revenue, By Delivery Modes, 2024 – 2032 (USD Million) 139

TABLE NO. 98. :.. Africa Continuing Education Market Revenue, By Profession, 2018 – 2023 (USD Million) 140

TABLE NO. 99. :.. Africa Continuing Education Market Revenue, By Profession, 2024 – 2032 (USD Million) 140

TABLE NO. 100. : Africa Continuing Education Market Revenue, By End-user, 2018 – 2023 (USD Million) 141

TABLE NO. 101. : Africa Continuing Education Market Revenue, By End-user, 2024 – 2032 (USD Million) 141

TABLE NO. 102. : Africa Continuing Education Market Revenue, By Providers, 2018 – 2023 (USD Million) 142

TABLE NO. 103. : Africa Continuing Education Market Revenue, By Providers, 2024 – 2032 (USD Million) 142

Frequently asked questions

How does COVID-19 Impact the global Continuing Education market?

COVID-19 has had a substantial impact on the market due to the outbreak of the COVID-19 pandemic, With the closure of physical classrooms and training centers, there has been a rapid increase in the adoption of online learning platforms for continuing education.

Which is the leading region of the market for Continuing Education?

North America accounted for the most heightened share in the global Continuing Education market.

What are the key drivers for the growth of the Continuing Education market?

Skill Enhancement and Career Advancement, Technological Advancements and Digital Transformation, Industry and Regulatory Requirements the Continuing Education market.

Which is the major segment in the Continuing Education market By Delivery Mode?

The E-learning segment had a major share in the global market in 2022.

Which is the major segment in the Continuing Education market By Profession?

The Healthcare Workers segment had a major share in the global market.

Simulation Software Market

Published:
Report ID: 36908

Bioinformatics Market

Published:
Report ID: 14530

Fish Hook Sensor Market

Published:
Report ID: 36774

Big Data Services Market

Published:
Report ID: 3020

Saudi Arabia Managed Security Services Market

Published:
Report ID: 36393

Microwave Oven Market

Published:
Report ID: 36314

Inkjet Coders Market

Published:
Report ID: 6669

Rich Communication Services Market

Published:
Report ID: 35774

Middle East and Africa Real-Time Payments Market

Published:
Report ID: 35770

Vietnam Managed Security Services (MSS) Market

Published:
Report ID: 35766

Middle East and Africa EdTech and Smart Classroom Market

Published:
Report ID: 35756

Digital Business Support System (DBSS) Market

Published:
Report ID: 35732

Purchase Options

$2999
Delivery Format: Excel.
$4999
Designed for the individual purchaser.
$6999
Users located at a single corporate site or regional office.
$7999
Allowed for unlimited sharing globally within one company.
Smallform of Sample request

Have a question?

User Profile

Don’t settle for less – trust Mitul to help you find the best solution.

Report delivery within 24 to 48 hours

– Other Info –

What people say?-

User Review

I am very impressed with the information in this report. The author clearly did their research when they came up with this product and it has already given me a lot of ideas.

Jana Schmidt
CEDAR CX Technologies

– Connect with us –

Phone

+91 6232 49 3207


support

24/7 Research Support


sales@credenceresearch.com

– Research Methodology –

Going beyond the basics: advanced techniques in research methodology

– Trusted By –

Pepshi, LG, Nestle
Motorola, Honeywell, Johnson and johnson
LG Chem, SIEMENS, Pfizer
Unilever, Samsonite, QIAGEN