
Market Overview:
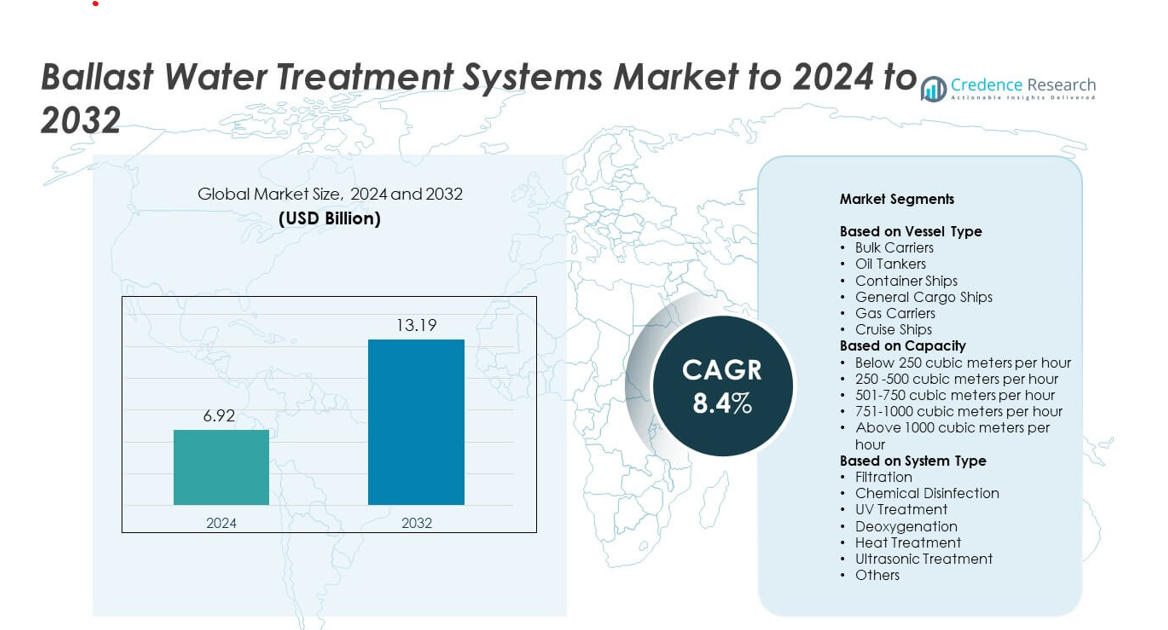
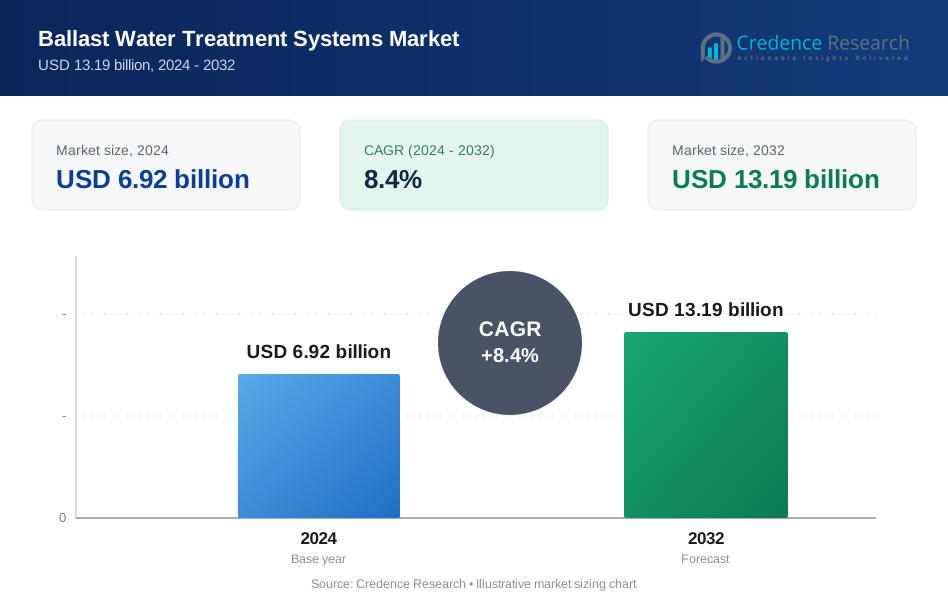
Ballast Water Treatment Systems Market size was valued at USD 6.92 billion in 2024 and is anticipated to reach USD 13.19 billion by 2032, at a CAGR of 8.4% during the forecast period.
| REPORT ATTRIBUTE | DETAILS |
|---|---|
| Historical Period | 2020-2023 |
| Base Year | 2024 |
| Forecast Period | 2025-2032 |
| Ballast Water Treatment Systems Market Size 2024 | USD 6.92 billion |
| Ballast Water Treatment Systems Market, CAGR | 8.4% |
| Ballast Water Treatment Systems Market Size 2032 | USD 13.19 billion |
The Ballast Water Treatment Systems market includes major players such as Optimarin AS, MH Systems Inc., Veolia, Auramarine Ltd, GenSys GmbH, Hyde Marine Inc., Damen Shipyards Group, NEI Treatment Systems, Evac, Wärtsilä, ALFA LAVAL, and Coldharbour Marine Ltd. These companies compete through advanced UV, filtration, and hybrid systems that support compliance with global maritime rules. North America led the market in 2024 with about 36% share due to strong regulatory enforcement and high retrofit activity. Europe followed with roughly 29% share, supported by strict environmental standards and active fleet modernization across major shipping nations.
Market Insights
- The market was valued at USD 6.92 billion in 2024 and is projected to reach USD 13.19 billion by 2032, growing at a CAGR of 8.4%.
- Strong regulatory pressure from global maritime authorities drives large-scale adoption, with bulk carriers holding about 34% share due to high ballast volumes and strict compliance demands.
- UV treatment systems lead the technology segment with nearly 42% share as operators prefer chemical-free and low-maintenance solutions that improve efficiency and reduce environmental impact.
- Competition intensifies as leading companies expand retrofit solutions, introduce compact modular systems, and integrate automation features that enhance operational reliability and reduce downtime.
- North America commands around 36% share, followed by Europe at 29% and Asia Pacific at 26%, while systems above 1000 cubic meters per hour represent roughly 37% share due to strong use in large cargo and tanker fleets.
Market Segmentation Analysis:
By Vessel Type
Bulk carriers led the vessel type segment in 2024 with about 34% share due to their large fleet size and high ballast water volumes on long-haul routes. These ships face strict compliance needs under the IMO Ballast Water Management Convention, which drives strong installation demand. Oil tankers and container ships followed as operators upgraded older fleets to avoid penalties at major global ports. Cruise ships and gas carriers showed steady uptake as high passenger safety standards and emissions rules encouraged rapid adoption of advanced ballast treatment technologies.
- For instance, Alfa Laval has sold over 9,000 PureBallast systems worldwide, as reported in company information from late 2024/early 2025, a product line essential for ballast water treatment in the marine industry
By Capacity
Systems above 1000 cubic meters per hour dominated the capacity segment in 2024 with nearly 37% share, supported by widespread use in large tankers, bulk carriers, and container vessels. High-capacity systems are preferred because they manage rapid ballast operations during tight port schedules. Mid-range systems between 501 and 750 cubic meters per hour also recorded growth as medium-sized cargo ships retrofitted to meet regulatory deadlines. Small-capacity systems showed moderate demand from coastal and short-sea operators shifting toward cost-efficient compliance solutions.
- For instance, Ecochlor’s president stated that the company targets vessels with ballast flow rates from 2,000 to 16,000 cubic meters per hour, focusing on mid- to high-capacity ballast systems.
By System Type
UV treatment led the system type segment in 2024 with about 42% share, driven by strong adoption across commercial fleets due to chemical-free operation and low environmental impact. Filtration systems followed as they serve as core pre-treatment units across most installations. Chemical disinfection gained use in large vessels operating in variable water conditions. Emerging technologies such as ultrasonic treatment and deoxygenation expanded gradually as operators sought energy-efficient solutions. Heat treatment remained niche but relevant for specialized ships requiring high-temperature processes for operational safety.
Key Growth Drivers
Stricter Global Maritime Regulations
International rules such as the IMO Ballast Water Management Convention continue to push shipowners toward mandatory installation of approved treatment systems. Growing enforcement at major ports increases compliance pressure on both new builds and older vessels. Fleet operators upgrade systems to avoid detentions and delays, which boosts long-term demand. Rising inspections across Asia, Europe, and North America strengthen the regulatory push and support steady market expansion.
- For instance, Ecochlor reported in a 2023 industry Q&A that 317 of its ballast water systems had been installed, with another 54 systems on order, giving a total of 371 units supplied under tightening global regulations.
Expansion of Global Cargo and Fleet Size
Trade growth increases vessel movement across regions, which raises the need for safe ballast water management. Larger fleets, especially bulk carriers and tankers, require reliable systems to meet operational timelines while staying compliant. Growing shipbuilding in China, South Korea, and Japan adds new installation demand. Fleet modernization programs across commercial segments also accelerate system adoption as operators seek energy-efficient and rules-compliant solutions.
- For instance, the ERMA TECH GROUP, which includes the ERMA FIRST brand, states it has over 4,100 Ballast Water Treatment Systems (BWTS) installed globally as of late 2024 and mid-2025 data, covering a broad share of the active commercial fleet.
Rising Focus on Marine Ecosystem Protection
Concerns about invasive aquatic species entering local waters drive governments to tighten environmental oversight. Port authorities promote treatment solutions that prevent ecological disruption and support biodiversity goals. Environmental protection groups and sustainability policies encourage shipowners to adopt low-impact technologies such as UV and filtration. This shift aligns market growth with global conservation efforts and reinforces long-term investment in advanced systems.
Key Trends and Opportunities
Increase in Retrofits Across Older Fleets
A large share of vessels sailing globally still operates without modern ballast treatment systems, creating a rising retrofit opportunity. Shipowners accelerate upgrades to avoid operational restrictions at high-traffic ports. The retrofit wave supports service providers, engineering firms, and component suppliers. Growing demand for compact, modular systems further boosts adoption across older ships with tight equipment space.
- For instance, Scienco/FAST reported selling 12 InTank systems and completing 14 installations in 2022, many on existing semi-submersibles and barges, highlighting active retrofit demand.
Shift Toward Low-Energy and Eco-Friendly Technologies
Ship operators focus on treatment technologies that reduce fuel use and lower operating emissions. UV-based and hybrid systems attract attention due to minimal chemical discharge and reduced maintenance needs. Growing sustainability commitments across shipping companies create demand for energy-efficient solutions. Manufacturers continue to introduce greener and smarter systems that align with evolving environmental standards.
- For instance, Wärtsilä’s Aquarius UV range lists the AQ-125-UV model with a ballast capacity up to 125 cubic meters per hour at 19.0 kilowatts total installed power, and the AQ-1000-UV model with 1,000 cubic meters per hour at 100.0 kilowatts total installed power, illustrating energy-optimized UV treatment options.
Integration of Digital Monitoring and Automation
Smart sensors and automated controls improve system reliability and help operators track compliance in real time. Digital tools support predictive maintenance, reducing downtime during voyages. Automated performance logs also simplify inspections at major ports. This trend creates opportunities for technology suppliers offering advanced control platforms and cloud-linked monitoring features.
Key Challenges
High Installation and Maintenance Costs
Many shipowners face financial pressure due to high upfront installation costs and ongoing maintenance requirements. Smaller operators struggle to balance compliance needs with budget limits. System downtime, component replacement, and periodic calibration add to lifecycle expenses. These cost barriers slow adoption, especially among older vessels nearing the end of operational life.
Operational Complexity and Performance Variability
Ballast water treatment systems must handle diverse water conditions such as high turbidity or varying salinity, which can affect system performance. Some vessels experience delays when treatment cycles take longer than planned. Crew training requirements add another layer of complexity. Performance inconsistency in challenging environments reduces system efficiency and impacts overall operational planning.
Regional Analysis
North America
North America held about 36% share in 2024 due to strict enforcement of ballast water discharge rules by the United States Coast Guard and strong compliance adoption among commercial fleets. Ports along the Gulf and Atlantic coasts increased inspection frequency, which encouraged rapid system installation across bulk carriers, tankers, and container ships. Shipowners favored UV and filtration systems for reliability and lower operating risks. Growing retrofit activity in older fleets and steady new-build deliveries continued to support market demand across the United States and Canada during the forecast period.
Europe
Europe accounted for nearly 29% share in 2024, supported by strong regulatory alignment with IMO conventions and high sustainability commitments within the maritime sector. Major shipping hubs such as Rotterdam, Antwerp, and Hamburg enforced strict compliance checks that accelerated system adoption. Fleet modernization across Nordic and Western European countries further supported demand. Increased investments in eco-friendly maritime technologies and the presence of advanced system manufacturers strengthened regional growth, particularly among cargo carriers and cruise vessels.
Asia Pacific
Asia Pacific captured about 26% share in 2024 and remained one of the fastest-growing regions due to extensive shipbuilding activity in China, South Korea, and Japan. Large commercial fleets operating in regional and international routes adopted treatment systems to meet compliance deadlines. Rising port traffic and expanding export volumes supported demand for high-capacity systems. Countries in Southeast Asia also increased environmental oversight, which accelerated installations across bulk carriers, tankers, and general cargo vessels operating in coastal and deep-sea routes.
Latin America
Latin America held around 5% share in 2024, driven by increasing regulatory adoption in major ports across Brazil, Mexico, and Chile. Growing maritime trade in agricultural and mineral exports created demand for compliant vessels equipped with efficient ballast treatment systems. Regional operators gradually upgraded fleets to avoid delays during international port calls. Limited shipbuilding capacity slowed early adoption, but strengthened port inspections and alignment with IMO standards continued to expand market presence across key trade routes.
Middle East and Africa
\Middle East and Africa accounted for about 4% share in 2024, supported by rising maritime activities in the Gulf region and expanding port infrastructure in the UAE, Saudi Arabia, and Oman. Large tanker fleets serving oil and gas routes fueled demand for high-capacity ballast water systems. Africa’s coastal nations increased environmental monitoring, encouraging compliance among regional cargo vessels. Although adoption remained slower than other regions, stronger enforcement efforts and growing international trade flows continued to improve system installation rates across the region.
Market Segmentations:
By Vessel Type
- Bulk Carriers
- Oil Tankers
- Container Ships
- General Cargo Ships
- Gas Carriers
- Cruise Ships
By Capacity
- Below 250 cubic meters per hour
- 250 -500 cubic meters per hour
- 501-750 cubic meters per hour
- 751-1000 cubic meters per hour
- Above 1000 cubic meters per hour
By System Type
- Filtration
- Chemical Disinfection
- UV Treatment
- Deoxygenation
- Heat Treatment
- Ultrasonic Treatment
- Others
By Geography
- North America
- U.S.
- Canada
- Mexico
- Europe
- Germany
- France
- U.K.
- Italy
- Spain
- Rest of Europe
- Asia Pacific
- China
- Japan
- India
- South Korea
- South-east Asia
- Rest of Asia Pacific
- Latin America
- Brazil
- Argentina
- Rest of Latin America
- Middle East & Africa
- GCC Countries
- South Africa
- Rest of the Middle East and Africa
Competitive Landscape
The competitive landscape of the Ballast Water Treatment Systems market is shaped by leading companies such as Optimarin AS, MH Systems Inc., Veolia, Auramarine Ltd, GenSys GmbH, Hyde Marine Inc., Damen Shipyards Group, NEI Treatment Systems, Evac, Wärtsilä, ALFA LAVAL, and Coldharbour Marine Ltd. The market features strong competition driven by advanced filtration, UV, and hybrid technologies designed to meet strict global compliance needs. Manufacturers invest in compact, energy-efficient systems that support easy retrofitting and reliable performance across diverse water conditions. Many suppliers focus on automation and digital monitoring to strengthen operational accuracy and reduce system downtime. Partnerships with shipyards and fleet operators help expand global reach, while service agreements support long-term maintenance. Increasing regulatory pressure encourages continuous innovation, pushing companies to enhance system efficiency, minimize environmental impact, and deliver solutions that comply with both IMO and regional standards.
Key Player Analysis
- Optimarin AS
- MH Systems Inc.
- Veolia
- Auramarine Ltd
- GenSys GmbH
- Hyde Marine Inc.
- Damen Shipyards Group
- NEI Treatment Systems
- Evac
- Wärtsilä
- ALFA LAVAL
- Coldharbour Marine Ltd.
Recent Developments
- In 2024, Alfa Laval secured a large contract focused on replacing aging ballast water systems, demonstrating ongoing retrofit demand in the shipping industry.
- In 2024, Optimarin acquired Hyde Marine from De Nora. This strategic move was made to strengthen the combined entity's position in the ballast water treatment market, leveraging Optimarin's global service network to support existing Hyde customers and help them comply with increasingly stringent IMO and USCG regulations
- In 2023, Wärtsilä introduced its existing Aquarius UV ballast water treatment system with a brand-new filtration solution: the 'Manta' filter.
Report Coverage
The research report offers an in-depth analysis based on Vessel Type, Capacity, System Type and Geography. It details leading market players, providing an overview of their business, product offerings, investments, revenue streams, and key applications. Additionally, the report includes insights into the competitive environment, SWOT analysis, current market trends, as well as the primary drivers and constraints. Furthermore, it discusses various factors that have driven market expansion in recent years. The report also explores market dynamics, regulatory scenarios, and technological advancements that are shaping the industry. It assesses the impact of external factors and global economic changes on market growth. Lastly, it provides strategic recommendations for new entrants and established companies to navigate the complexities of the market.
Future Outlook
- The market will expand as global port authorities strengthen compliance enforcement.
- Retrofit demand will rise across aging fleets to meet regulatory deadlines.
- Shipyards will integrate advanced treatment systems into most new-build vessels.
- UV and hybrid technologies will gain wider adoption for low-impact operation.
- Digital monitoring tools will support real-time compliance tracking and system automation.
- Energy-efficient solutions will attract operators seeking lower operating costs.
- Chemical-free systems will grow as environmental standards tighten worldwide.
- Service and maintenance providers will see higher demand from retrofit cycles.
- System designs will become more compact to fit space-restricted engine rooms.
- Regional adoption will accelerate as emerging economies align with IMO rules.
Request a Free Sample
Fill in your details and we'll send you a free sample report.
- Sample data tables & charts
- Research methodology
Need a Custom Version of This Report?
Tailor the scope, geography, or segments to your exact requirements.
- Custom geography or segment scope
- Direct access to our analyst team
Frequently Asked Questions
What is the current market size for the Ballast Water Treatment Systems market, and what is its projected size in 2032?
At what Compound Annual Growth Rate is the Ballast Water Treatment Systems marketprojected to grow between 2025 and 2032?
Who are the major players in the global Ballast Water Treatment Systems Market?
What are the major market drivers of the Ballast Water Treatment Systems industry?
What are the major market restraints of the Ballast Water Treatment Systems industry?
What are the major market opportunities of the Ballast Water Treatment Systems industry?
Table of Content
Chapter 1. Report Introduction
- 1.1 Report Description & Purpose
- 1.1.1 Report Title & Market Definition
- 1.1.2 Unique Selling Propositions (USP) & Key Differentiators
- 1.1.3 Value Proposition for Stakeholders
- 1.2 Research Objectives
- 1.2.1 Market Sizing Objectives (Volume & Revenue) (Volume Where Applicable)
- 1.2.2 Segmentation Objectives
- 1.2.3 Competitive Intelligence Objectives
- 1.2.4 Forecast & Scenario Objectives
- 1.3 Report Scope
- 1.3.1 Ballast Water Treatment Systems Scope – Segments & Subsegments Covered
- 1.3.2 Geographic Scope – Regions & Countries Covered
- 1.3.3 Historical Period, Base Year & Forecast Period (2024; forecast to 2032)
- 1.3.4 Inclusions & Exclusions
- 1.4 Industry Classification & Applicable Codes
- 1.5 Currency, Measurement Units & Valuation Basis
- 1.6 Target Stakeholders
- 1.7 Limitations & Assumptions
Chapter 2. Executive Summary
- 2.1 Global Ballast Water Treatment Systems Market Snapshot
- 2.1.1 Market Size – Historical (2024) & Forecast (2024-2032) (2024: USD 6.92 billion → 2032: USD 13.19 billion)
- 2.1.2 Volume & Revenue – Global Totals (Volume Where Applicable)
- 2.1.3 Key Market Highlights – Top Five Facts
- 2.2 Ballast Water Treatment Systems Market Segmentation Snapshot
- 2.2.1 Market Split by Region – 2024 vs. 2032
- 2.3 Competitive Snapshot
- 2.3.1 Top 10 Players by Revenue Share – 2024
- 2.3.2 Top 10 Players by Volume Share – 2024 (Volume Where Applicable)
- 2.3.3 Recent Strategic Developments (18-Month Summary)
- 2.4 Key Investment Highlights & Strategic Conclusions
Chapter 3. Ballast Water Treatment Systems Market Dynamics & Industry Analysis
- 3.1 Market Overview & Context
- 3.1.1 Ballast Water Treatment Systems Market Position in the Broader Industry Value Chain
- 3.1.2 Demand Structure & Purchasing Dynamics
- 3.1.3 Market Maturity & Development Stage by Region
- 3.2 Ballast Water Treatment Systems Market Drivers
- 3.3 Ballast Water Treatment Systems Market Restraints & Challenges
- 3.4 Ballast Water Treatment Systems Market Opportunities
- 3.5 Porter's Five Forces Analysis
- 3.5.1 Threat of New Entrants
- 3.5.2 Bargaining Power of Suppliers
- 3.5.3 Bargaining Power of Buyers
- 3.5.4 Threat of Substitutes
- 3.5.5 Competitive Rivalry – Intensity Assessment
- 3.6 Ballast Water Treatment Systems Value Chain Analysis
- 3.6.1 Upstream – Key Inputs, Resources & Suppliers
- 3.6.1.1 Key Input/Resource 1
- 3.6.1.2 Key Input/Resource 2
- 3.6.1.3 Key Input/Resource 3
- 3.6.2 Midstream – Core Operations & Value Creation
- 3.6.2.1 Operating Model & Process Overview
- 3.6.2.2 Key Operating Locations & Capabilities by Company
- 3.6.3 Downstream – Market Channels & End Users
- 3.6.3.1 Direct Sales & Customer Engagement Channels
- 3.6.3.2 Indirect Sales, Intermediaries & Partner Channels
- 3.6.4 Value Chain Profitability Analysis
- 3.6.1 Upstream – Key Inputs, Resources & Suppliers
- 3.7 PESTEL Analysis
- 3.7.1 Political Factors
- 3.7.2 Economic Factors
- 3.7.3 Social Factors
- 3.7.4 Technological Factors
- 3.7.5 Environmental Factors
- 3.7.6 Legal Factors
- 3.8 Ballast Water Treatment Systems Supply Chain Analysis
- 3.8.1 Critical Input & Resource Availability Risk Assessment
- 3.8.2 Supplier & Operational Concentration Risk (Geographic Exposure)
- 3.8.3 Supply & Service Disruption Impact Analysis
- 3.9 Regulatory & Policy Landscape
Note: The regulatory and policy landscape section covers regulations based on their applicability to the market, Ballast Water Treatment Systems category, geography, and scope of the study. Only regulatory frameworks with a material impact on operations, compliance, trade, sustainability, or market access are analyzed in detail.
Chapter 4. Key Investment Pockets & Opportunity Analysis
- 4.1 Ballast Water Treatment Systems Market Attractiveness Analysis
- 4.1.1 By Region – Investment Attractiveness Matrix (Market Size × CAGR)
- 4.2 Absolute Revenue Growth Opportunity
- 4.2.1 By Region – Absolute Revenue Growth Through 2032
- 4.3 Incremental Demand Opportunity
- 4.3.1 By Region – Incremental Demand Through 2032
- 4.3.2 Segment – Incremental Demand
- 4.4 Emerging Submarket Opportunity Deep Dive (Subject to Applicability)
- 4.5 Priority Market Opportunity Scorecards
- 4.5.1 United States
- 4.5.2 Europe
- 4.5.3 Asia
- 4.5.4 Middle East & Africa
Note: Priority market opportunity scorecards reflect the geographic scope and strategic relevance of the study. Listed markets are indicative and may be adapted to the industry.
Chapter 5. Ballast Water Treatment Systems Cross-Border Trade & Market Access Analysis
- 5.1 International Trade & Cross-Border Activity Overview
- 5.1.1 Global Export Value by Country (2024)
- 5.1.2 Global Export Volume by Country (2024) (Volume Where Applicable)
- 5.1.3 Global Import Value by Country (2024)
- 5.1.4 Global Import Volume by Country (2024) (Volume Where Applicable)
- 5.1.5 Net Trade Balance by Country (2024)
- 5.2 Export Analysis – Segment
- 5.2.1 Category 1 (Applicable Classification Code)
- 5.2.2 Category 2 (Applicable Classification Code)
- 5.2.3 Category 3 (Applicable Classification Code)
- 5.2.4 Category 4 (Applicable Classification Code)
- 5.2.5 Category 5 (Applicable Classification Code)
- 5.3 Import Analysis – Segment
- 5.3.1 Category 1 (Applicable Classification Code)
- 5.3.2 Category 2 (Applicable Classification Code)
- 5.3.3 Category 3 (Applicable Classification Code)
- 5.3.4 Category 4 (Applicable Classification Code)
- 5.3.5 Category 5 (Applicable Classification Code)
- 5.4 Cross-Border Pricing & Transaction Benchmarks
- 5.4.1 Export Pricing – Segment & Country
- 5.4.2 Import Pricing – Segment & Source Country
- 5.4.3 Price Trends (2024)
- 5.5 Key Cross-Border Trade & Delivery Routes
- 5.5.1 Cross-Border Trade/Delivery Route 1
- 5.5.2 Cross-Border Trade/Delivery Route 2
- 5.5.3 Cross-Border Trade/Delivery Route 3
- 5.5.4 Cross-Border Trade/Delivery Route 4
- 5.5.5 Cross-Border Trade/Delivery Route 5
- 5.6 Trade Policy & Market Access Impact Assessment
- 5.6.1 Tariff & Non-Tariff Barriers
- 5.6.2 Regional Trade & Economic Integration Frameworks
- 5.6.3 Bilateral & Multilateral Trade Agreements
- 5.6.4 Cross-Border Operating, Licensing & Localization Requirements
Note: This chapter applies where cross-border trade or delivery is relevant to Ballast Water Treatment Systems. Goods, services, and digital offerings are assessed using applicable classifications and transaction measures. Import-export volumes, trade balances, and route analyses are included only where meaningful to the market.
Chapter 6. Competitive Landscape & Company Benchmarking
- 6.1 Ballast Water Treatment Systems Market Concentration & Structure
- 6.1.1 Herfindahl-Hirschman Index (HHI) – vs. 2024
- 6.1.2 Leading, Mid-Sized & Emerging Player Structure
- 6.1.3 Global, Regional & Local Player Dynamics
- 6.2 Ballast Water Treatment Systems Market Share Analysis – 2024
- 6.2.1 Global Revenue Share by Company
- 6.2.2 Global Volume Share by Company (Volume Where Applicable)
- 6.2.3 Regional Revenue Share
- 6.2.4 Market Share Evolution ( vs. 2024)
- 6.2.5 Company Market Share by Key Segment
- 6.2.6 Company Market Share by Customer Group
- 6.3 Operating Scale, Capacity & Infrastructure Analysis
- 6.3.1 Global Operating Scale & Supply Capacity
- 6.3.2 Resource Utilization & Operating Efficiency
- 6.3.3 Output, Service Delivery & Activity Metrics
- 6.3.4 Operating Footprint & Infrastructure Map
- 6.3.5 Planned Operational & Capacity Expansion
- 6.4 Ballast Water Treatment Systems Competitive Benchmarking Matrix
- 6.4.1 Revenue, Growth, Profitability & Operating Metric Comparison
- 6.4.2 Channel Revenue Mix
- 6.4.3 Geographic Revenue Exposure
- 6.4.4 R&D Intensity
- 6.4.5 Sustainability Maturity
- 6.5 Strategic Developments in Ballast Water Treatment Systems (Last 24 Months)
- 6.5.1 Mergers, Acquisitions & Divestments
- 6.5.2 New Products, Services & Solutions in Ballast Water Treatment Systems
- 6.5.3 Operational & Infrastructure Expansions
- 6.5.4 Strategic Alliances, Joint Ventures & Partnerships
- 6.5.5 Distribution Expansion & Market Entry
- 6.5.6 Sustainability & ESG Initiatives
- 6.6 Competitive Strategy Mapping
- 6.6.1 Leader, Challenger, Follower & Niche Classification
- 6.6.2 Pricing Strategy Comparison
- 6.6.3 Channel Strategy Matrix
Note: Strategic developments are included based on their materiality and the availability of reliable information.
Chapter 7. Global Ballast Water Treatment Systems Market – By Sales & Delivery Channel
- 7.1 Segment Overview
- 7.1.1 Volume & Revenue Split by Channel (2024 & 2032) (Volume Where Applicable)
- 7.1.2 Channel Mix Evolution (2024-2032)
Chapter 8. Regional Market Analysis – Global Overview
- 8.1 Global Regional Overview
- 8.1.1 Regional Volume Share (Volume Where Applicable)
- 8.1.2 Regional Revenue Share
- 8.1.3 Regional Volume by Region (Volume Where Applicable)
- 8.1.4 Regional Revenue by Region
- 8.1.5 Regional Forecast Through 2032
- 8.2 Cross-Regional Segment Analysis
- 8.2.1 By Sales & Delivery Channel
- 8.2.2 By Competitive Positioning & Price Tier
Chapter 9. North America Ballast Water Treatment Systems Market
- 9.1 United States
- 9.2 Canada
- 9.3 Mexico
Chapter 10. Europe Ballast Water Treatment Systems Market
- 10.1 Germany
- 10.2 France
- 10.3 Italy
- 10.4 United Kingdom
- 10.5 Spain
- 10.6 Poland
- 10.7 Russia
- 10.8 Netherlands
- 10.9 Belgium
- 10.10 Sweden
- 10.11 Denmark
- 10.12 Norway
- 10.13 Rest of Europe
Chapter 11. Asia Pacific Ballast Water Treatment Systems Market
- 11.1 China
- 11.2 India
- 11.3 Japan
- 11.4 South Korea
- 11.5 Thailand
- 11.6 Indonesia
- 11.7 Vietnam
- 11.8 Malaysia
- 11.9 Australia
- 11.10 Rest of Asia Pacific
Chapter 12. Latin America Ballast Water Treatment Systems Market
- 12.1 Brazil
- 12.2 Argentina
- 12.3 Colombia
- 12.4 Chile
- 12.5 Rest of Latin America
Chapter 13. Middle East Ballast Water Treatment Systems Market
- 13.1 Saudi Arabia
- 13.2 United Arab Emirates
- 13.3 Turkey
- 13.4 Israel
- 13.5 Iran
- 13.6 Rest of the Middle East
Chapter 14. Africa Ballast Water Treatment Systems Market
- 14.1 South Africa
- 14.2 Egypt
- 14.3 Nigeria
- 14.4 Morocco
- 14.5 Rest of Africa
Chapter 15. Ballast Water Treatment Systems Company Profiles
- 15.1 [Company 01]
- 15.1.1 Company Overview
- 15.1.2 Key Management Personnel
- 15.1.3 Products & Services Portfolio
- 15.1.4 Financial Performance
- 15.1.5 Key Market Focus & Geographic Presence
- 15.1.6 Recent Developments & Strategic Initiatives
Note: The company profile list is preliminary and may change based on research findings, market developments, data availability, and client requirements.
Chapter 16. Appendices
- Appendix A – List of Abbreviations & Acronyms
- Appendix B – Industry Classification Code Reference – Full Series
- Appendix C – Supply, Output & Operating Capacity Data Tables
- Appendix D – End-Use & Demand Base Tables
- Appendix E – Demand, Adoption & Usage Assumptions
- Appendix F – Pricing & Revenue Metric Reference Tables
- Appendix G – Company Operations & Infrastructure Database
- Appendix H – Cross-Border Trade & Activity Data Tables (Where Applicable)
- Appendix I – Regulatory Summary Tables
- Appendix J – Primary Research Participant List (Anonymized)
- Appendix K – Primary Research Questionnaire Framework
- Appendix L – Data Sources & Bibliography
- Appendix M – Market Size Divergence & Source Comparison
Chapter 17. Research Methodology
- 17.1 Research Framework & Philosophy
- 17.2 Secondary Research – Sources, Hierarchy & Data Extraction
- 17.3 Data Modeling – Bottom-Up & Top-Down Market Sizing
- 17.4 Primary Research – Stakeholder Framework, LOI & Sample Sizes
- 17.5 Forecast Methodology – Regression, Scenario & Sensitivity Analysis
- 17.6 Quality Control – Four-Layer Validation Framework
- 17.7 Limitations & Standard Assumptions
- 17.8 Disclaimer
