Outsourced trials and lab work carry sponsor pipelines
The global contract research organization services (CROS) market was valued at USD 74.60 billion in 2025 and is projected to increase from USD 79.97 billion in 2026 to USD 149.52 billion by 2035, registering a CAGR of 7.20% during 2026–2035. Demand comes from drug and biologic sponsors that outsource clinical trials, early development, bioanalytical and safety testing, and data handling, and from device makers that need clinical evidence. North America held the largest regional share, 44.0% in 2025, because the United States hosts the most industry-sponsored trials and the largest sponsor base. Asia Pacific is the fastest-growing region at 8.6% a year, as China shortens trial reviews and Australia draws early-phase studies. The main commercial change is a shift toward data and technology, with large providers buying endpoint, safety and analytics platforms to defend margins as AI tools cut the manual labor that once set the price of each trial.
Sponsors buy capacity, speed and regulatory-grade data
The market counts fee-based work that sponsors buy from outside providers, covering Phase I to Phase IV and real-world evidence studies, chemistry, manufacturing and controls support, preclinical toxicology and pharmacology, analytical and bioanalytical testing, regulatory consulting and clinical data management and safety reporting. Contracts run as full-service awards, functional service provision or unit-priced laboratory work.
Contract manufacturing, site fees paid directly by sponsors, sponsors' internal research staff and pure software licenses are excluded. Value is split between the provider that designs and runs the study, the investigator sites that enroll patients, and the laboratories and technology vendors whose data reach regulators.
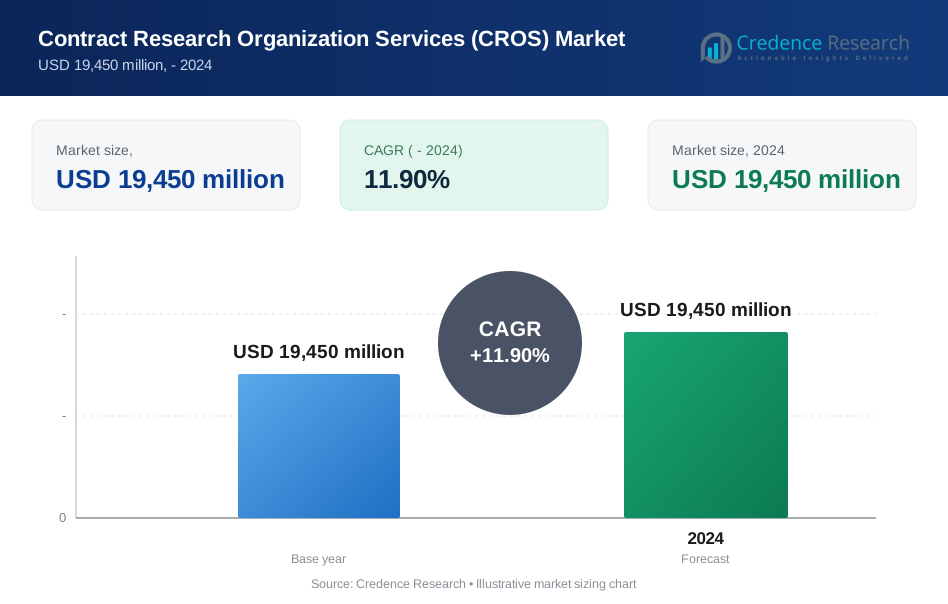
Contract Research Organization Services (CROS) Market Insights
- The global contract research organization services (CROS) market was valued at USD 74.60 billion in 2025 and is projected to reach USD 149.52 billion by 2035, growing at a 7.20% CAGR during 2026–2035.
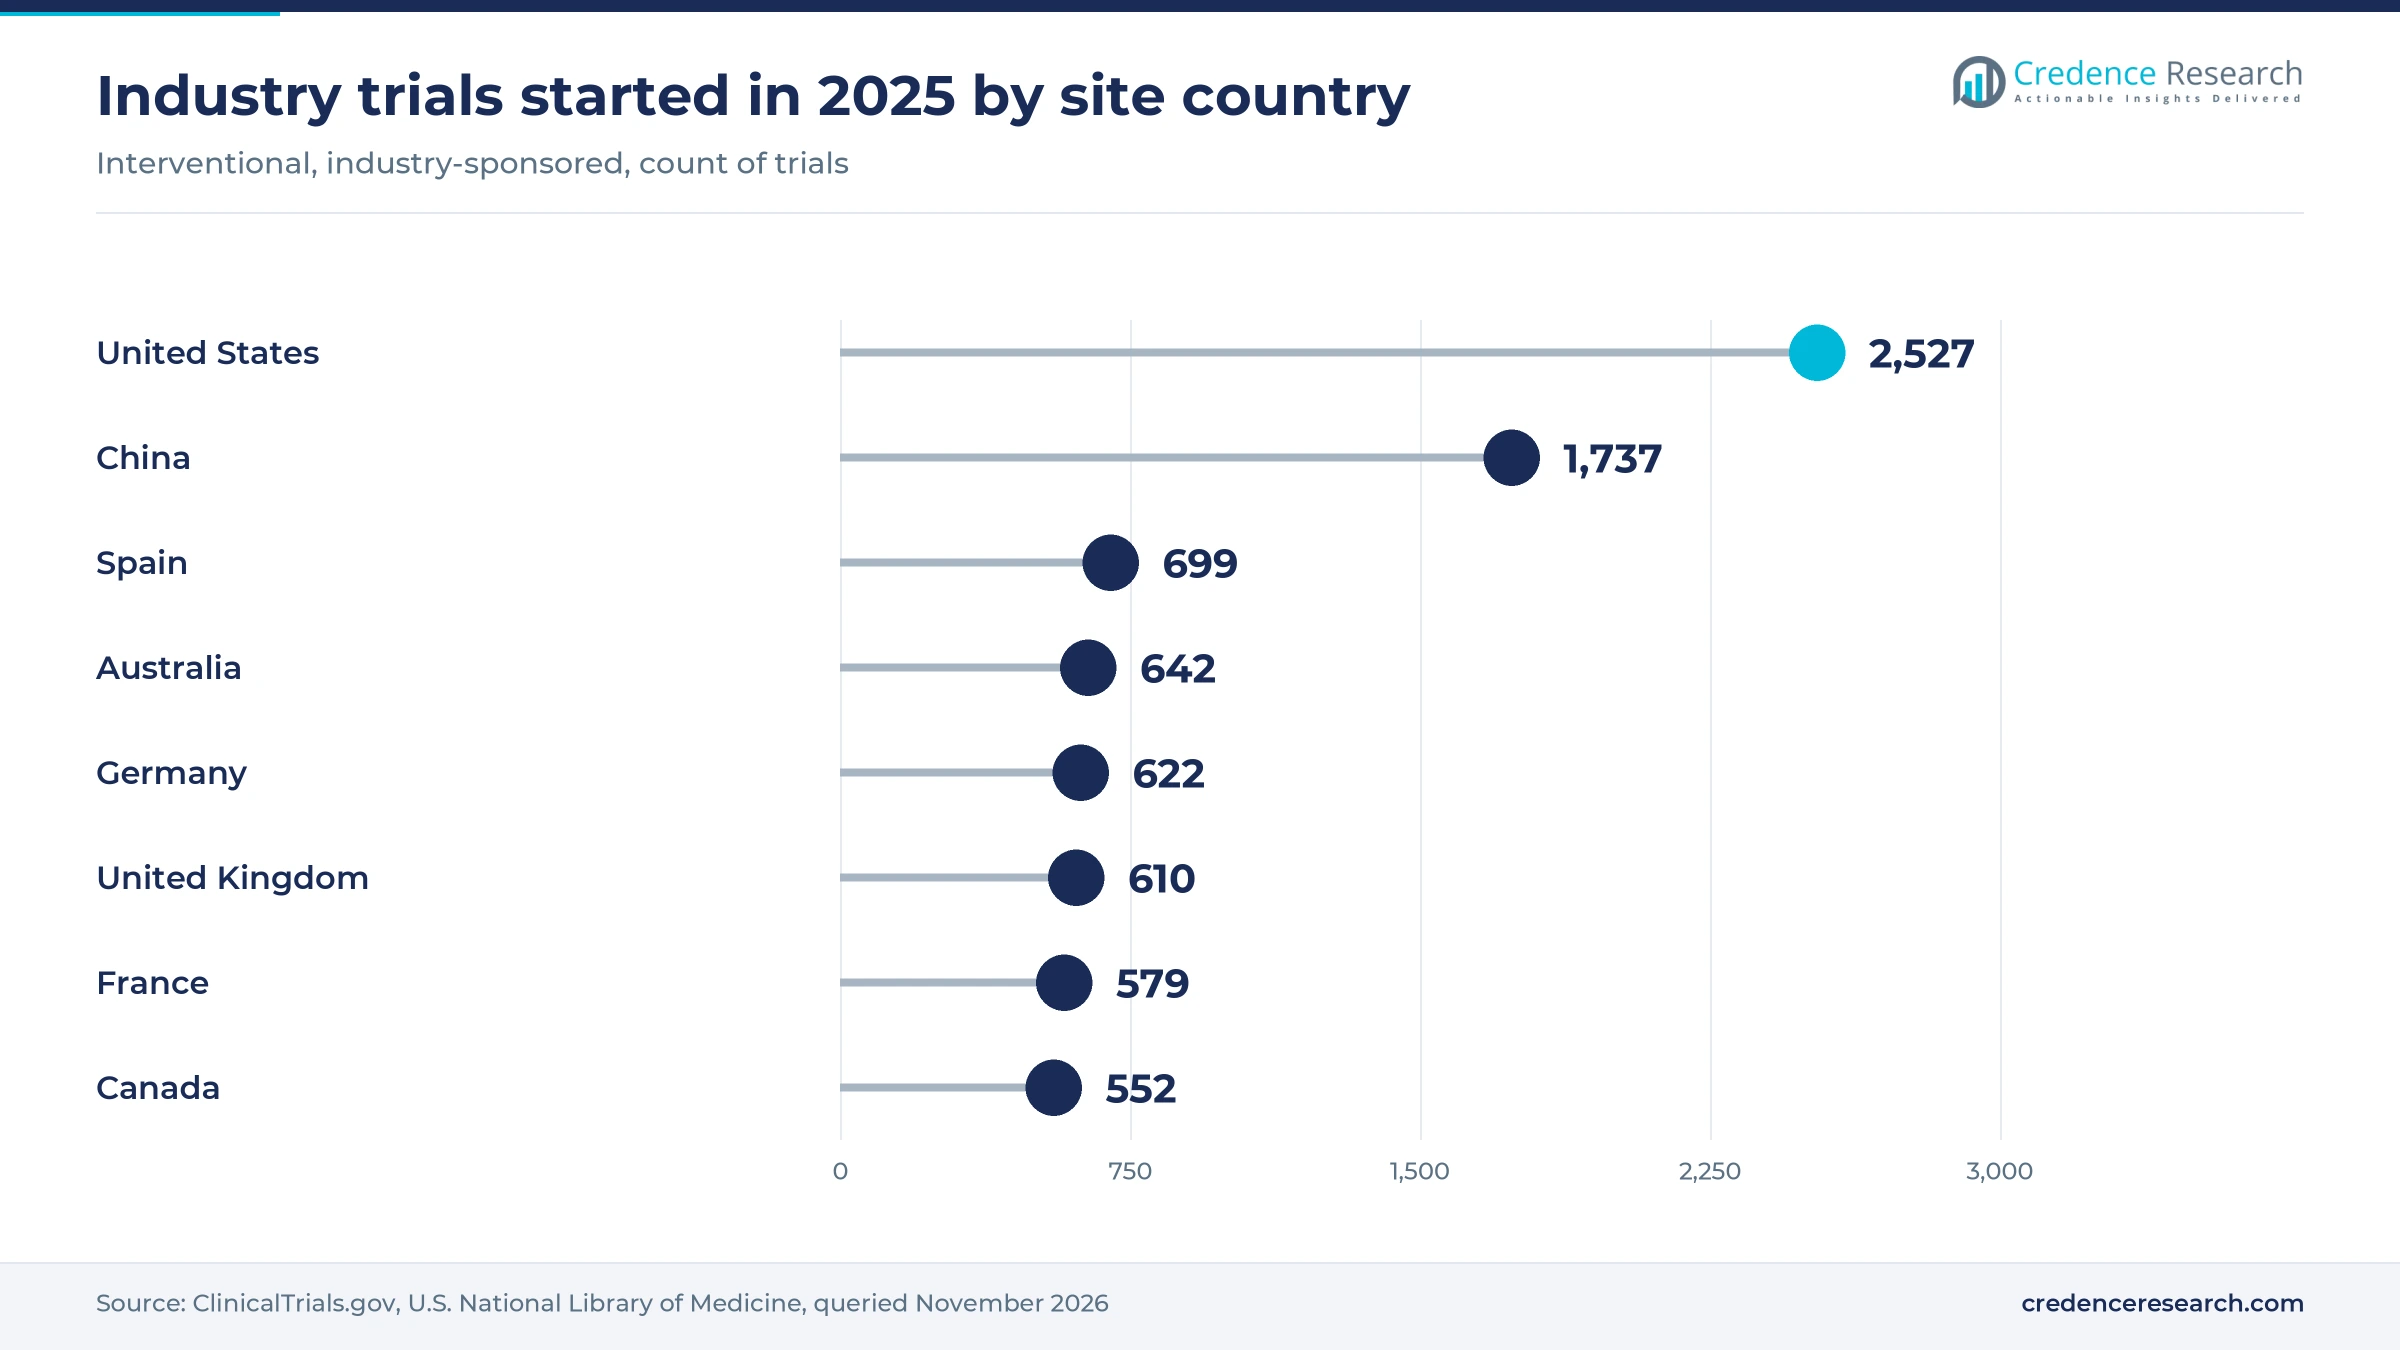
- North America held 44.0% of 2025 value, as the United States hosted 2,527 industry-sponsored interventional trials that started in 2025.
- Clinical research services held 56.0% of 2025 value, because Phase II and Phase III studies consume most outsourced budgets.
- Thermo Fisher completed its USD 8.875 billion purchase of endpoint data provider Clario on March 24, 2026, adding data infrastructure to its clinical research business.
- ICON reported a 1.56x net book-to-bill ratio in the third quarter of 2026, a sign that sponsor awards are running ahead of revenue.
Clinical studies lead as data work grows fastest
Clinical studies lead while data and safety work grow fastest
Based on type, the market is categorized into clinical research services, early phase development services, laboratory services, consulting services and data management services. Clinical Research Services led with 56.0% of 2025 value because later-phase studies are the costliest outsourced step, and ClinicalTrials.gov lists 1,012 industry-sponsored Phase 3 trials that started in 2025. Data Management Services grow fastest at 8.7% a year as automation moves safety and data work to platforms, and Parexel acquired AI pharmacovigilance platform provider Vitrana on April 29, 2026. Consulting stays small because sponsors often buy it inside larger awards.
Oncology holds the largest budget as obesity trials multiply
Based on therapeutic area, the market is categorized into oncology, neurology, metabolic disorders/endocrinology, immunological disorders, infectious diseases, CVS disorders and other therapeutic areas. Oncology led with 30.0% of 2025 value because cancer studies need biomarker testing, imaging and long follow-up, and ClinicalTrials.gov lists 1,391 industry cancer trials that started in 2025, about 23.5% of the total. Metabolic Disorders/Endocrinology grows fastest at 8.9% a year as obesity programs expand, with industry obesity trial starts rising from 174 in 2024 to 229 in 2025. Biologic programs such as monoclonal antibodies add immunogenicity and bioanalytical testing, and the FDA's April 2025 plan to phase out animal testing starts with monoclonal antibodies.
Drug sponsors dominate as device makers add clinical studies
Based on end user, the market is categorized into pharmaceutical and biopharmaceutical companies, medical device companies and academic institutes. Pharmaceutical & Biopharmaceutical Companies led with 80.0% of 2025 value because drug sponsors fund the largest multi-country trials, as the bookings ratios described in the drivers show. Medical Device Companies grow fastest at 8.0% a year as European rules require new clinical evidence, and ClinicalTrials.gov lists 1,001 industry device trials that started in 2025 against 974 in 2024. Academic buyers remain a small group that depends on public grants and foundation funding.
| Segment Group | Leading Sub-segment | Share, 2025 | Fastest-growing Sub-segment | CAGR, 2026–2035 |
|---|---|---|---|---|
| By Type | Clinical Research Services | 56.0% | Data Management Services | 8.7% |
| By Therapeutic Area | Oncology | 30.0% | Metabolic Disorders/Endocrinology | 8.9% |
| By End User | Pharmaceutical & Biopharmaceutical Companies | 80.0% | Medical Device Companies | 8.0% |
Per-study budgets follow phase, design and staff hours
Full-service trials are priced per study from a budget of staff hours, site visits, patient procedures and pass-through costs, while laboratories charge per sample or per test package. Phase, enrollment size, therapeutic area and the number of countries move the price most. Functional service contracts bill hourly rates, which caps provider margins, whereas platform-based data and endpoint work carries higher margins. The federal per-phase averages below date from 2014 and understate current budgets, and no newer official per-phase figures are published, so the laboratory and hourly rows are Credence Research estimates.
| Offer or segment | Typical price or fee | Basis |
|---|---|---|
| Phase 1 study, United States | USD 3.80 million weighted average per study | HHS ASPE study, July 2014 |
| Phase 2 study, United States | USD 13.35 million weighted average per study | HHS ASPE study, July 2014 |
| Phase 3 study, United States | USD 19.89 million weighted average per study | HHS ASPE study, July 2014 |
| Clinical research associate, functional service | USD 120 to 200 per hour | Credence Research estimate |
| Regulated bioanalytical sample analysis | USD 100 to 400 per sample | Credence Research estimate |
Request a Free Sample
Fill in your details and we'll send you a free sample report.
- Sample data tables & charts
- Research methodology
Bookings recovery and faster trial approvals lift demand
Sponsor awards are running ahead of provider revenue
Sponsors are signing new work faster than providers can bill it, which builds the pipeline of revenue for 2027 and beyond after two years of cautious spending. ICON reported gross bookings up 26.9% in the third quarter of 2026 and a net book-to-bill ratio of 1.56x. IQVIA reported research and development net new bookings up 15% in the same quarter and a 1.2x book-to-bill ratio, its strongest clinical bookings quarter since 2022. Both companies released these quarterly results on Oct. 27, 2026, covering the quarter to Sept. 30. Large full-service providers benefit first, because big sponsors are placing multi-year programs, while smaller providers wait for biotech awards to follow.
More industry trials and shorter Chinese reviews add volume
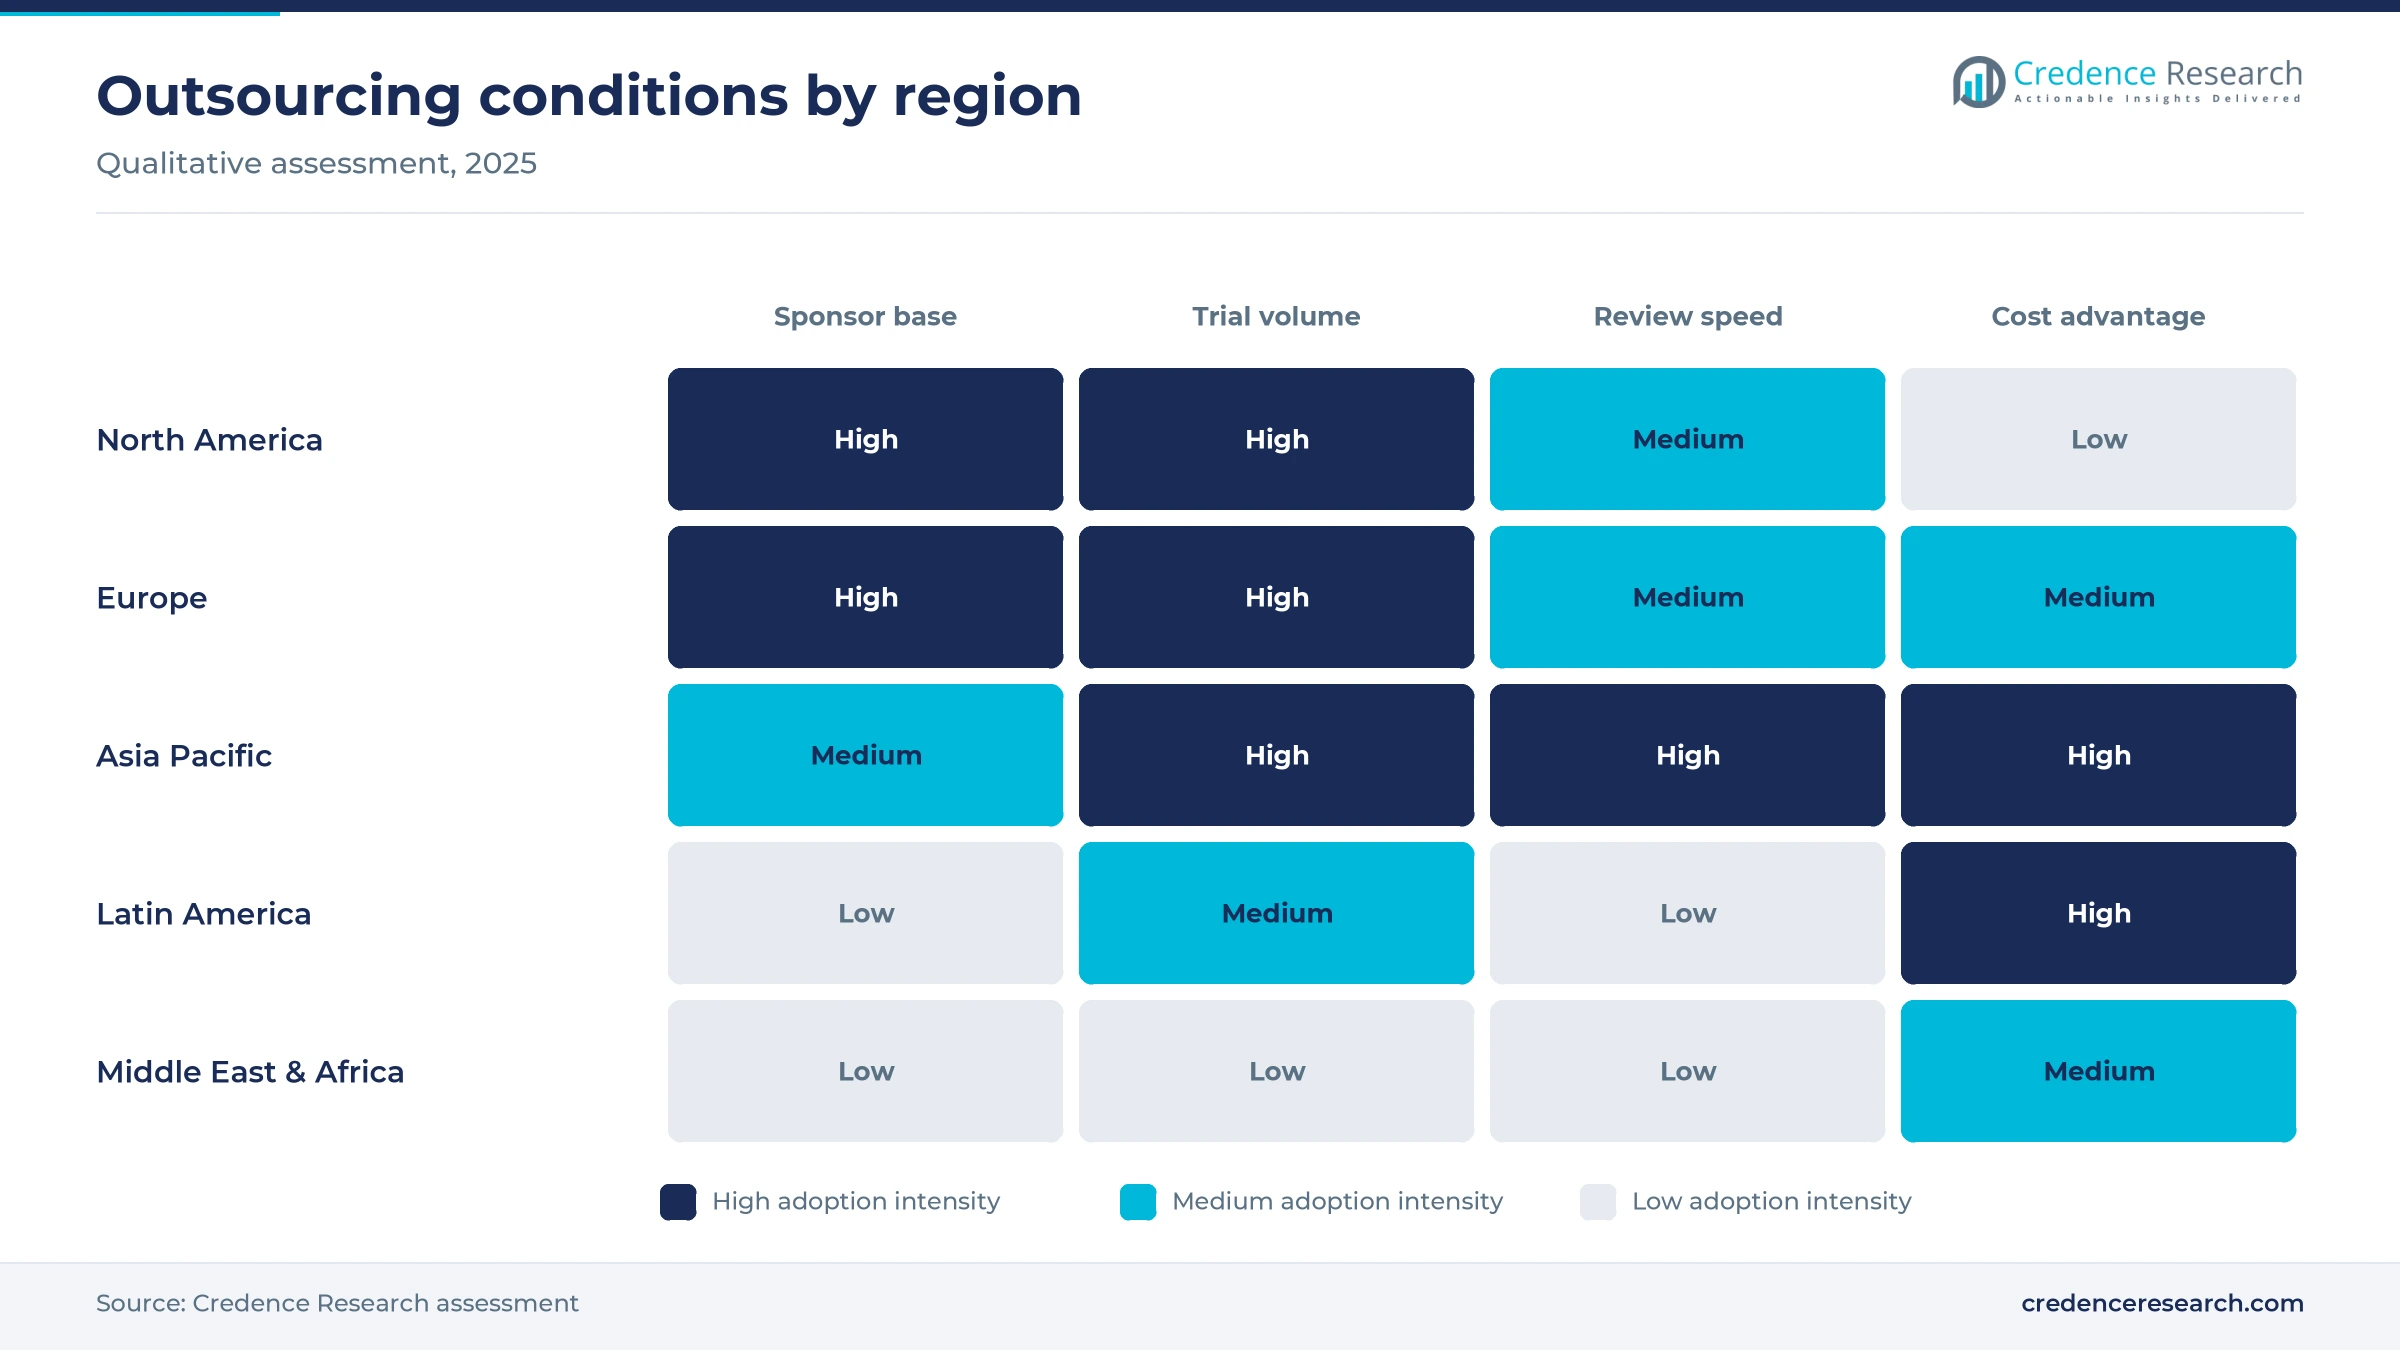
Trial counts are rising again, so providers have more studies to staff, monitor and analyze, especially in Asia. ClinicalTrials.gov lists 5,919 industry-sponsored interventional trials with a 2025 start date, up from 5,606 in 2024, and trials with a site in China rose from 1,526 to 1,737. That volume adds demand for monitoring, data management and laboratory work through 2026 and 2027. China's NMPA introduced a 30-working-day review for eligible innovative drug trial applications on Sept. 9, 2025, and sponsors must start the trial within 12 weeks of approval. Providers with Chinese site networks and regulatory teams gain most, since sponsors now place early-phase work in China to reach global data sooner.
Risk-based trial rules raise demand for specialist oversight
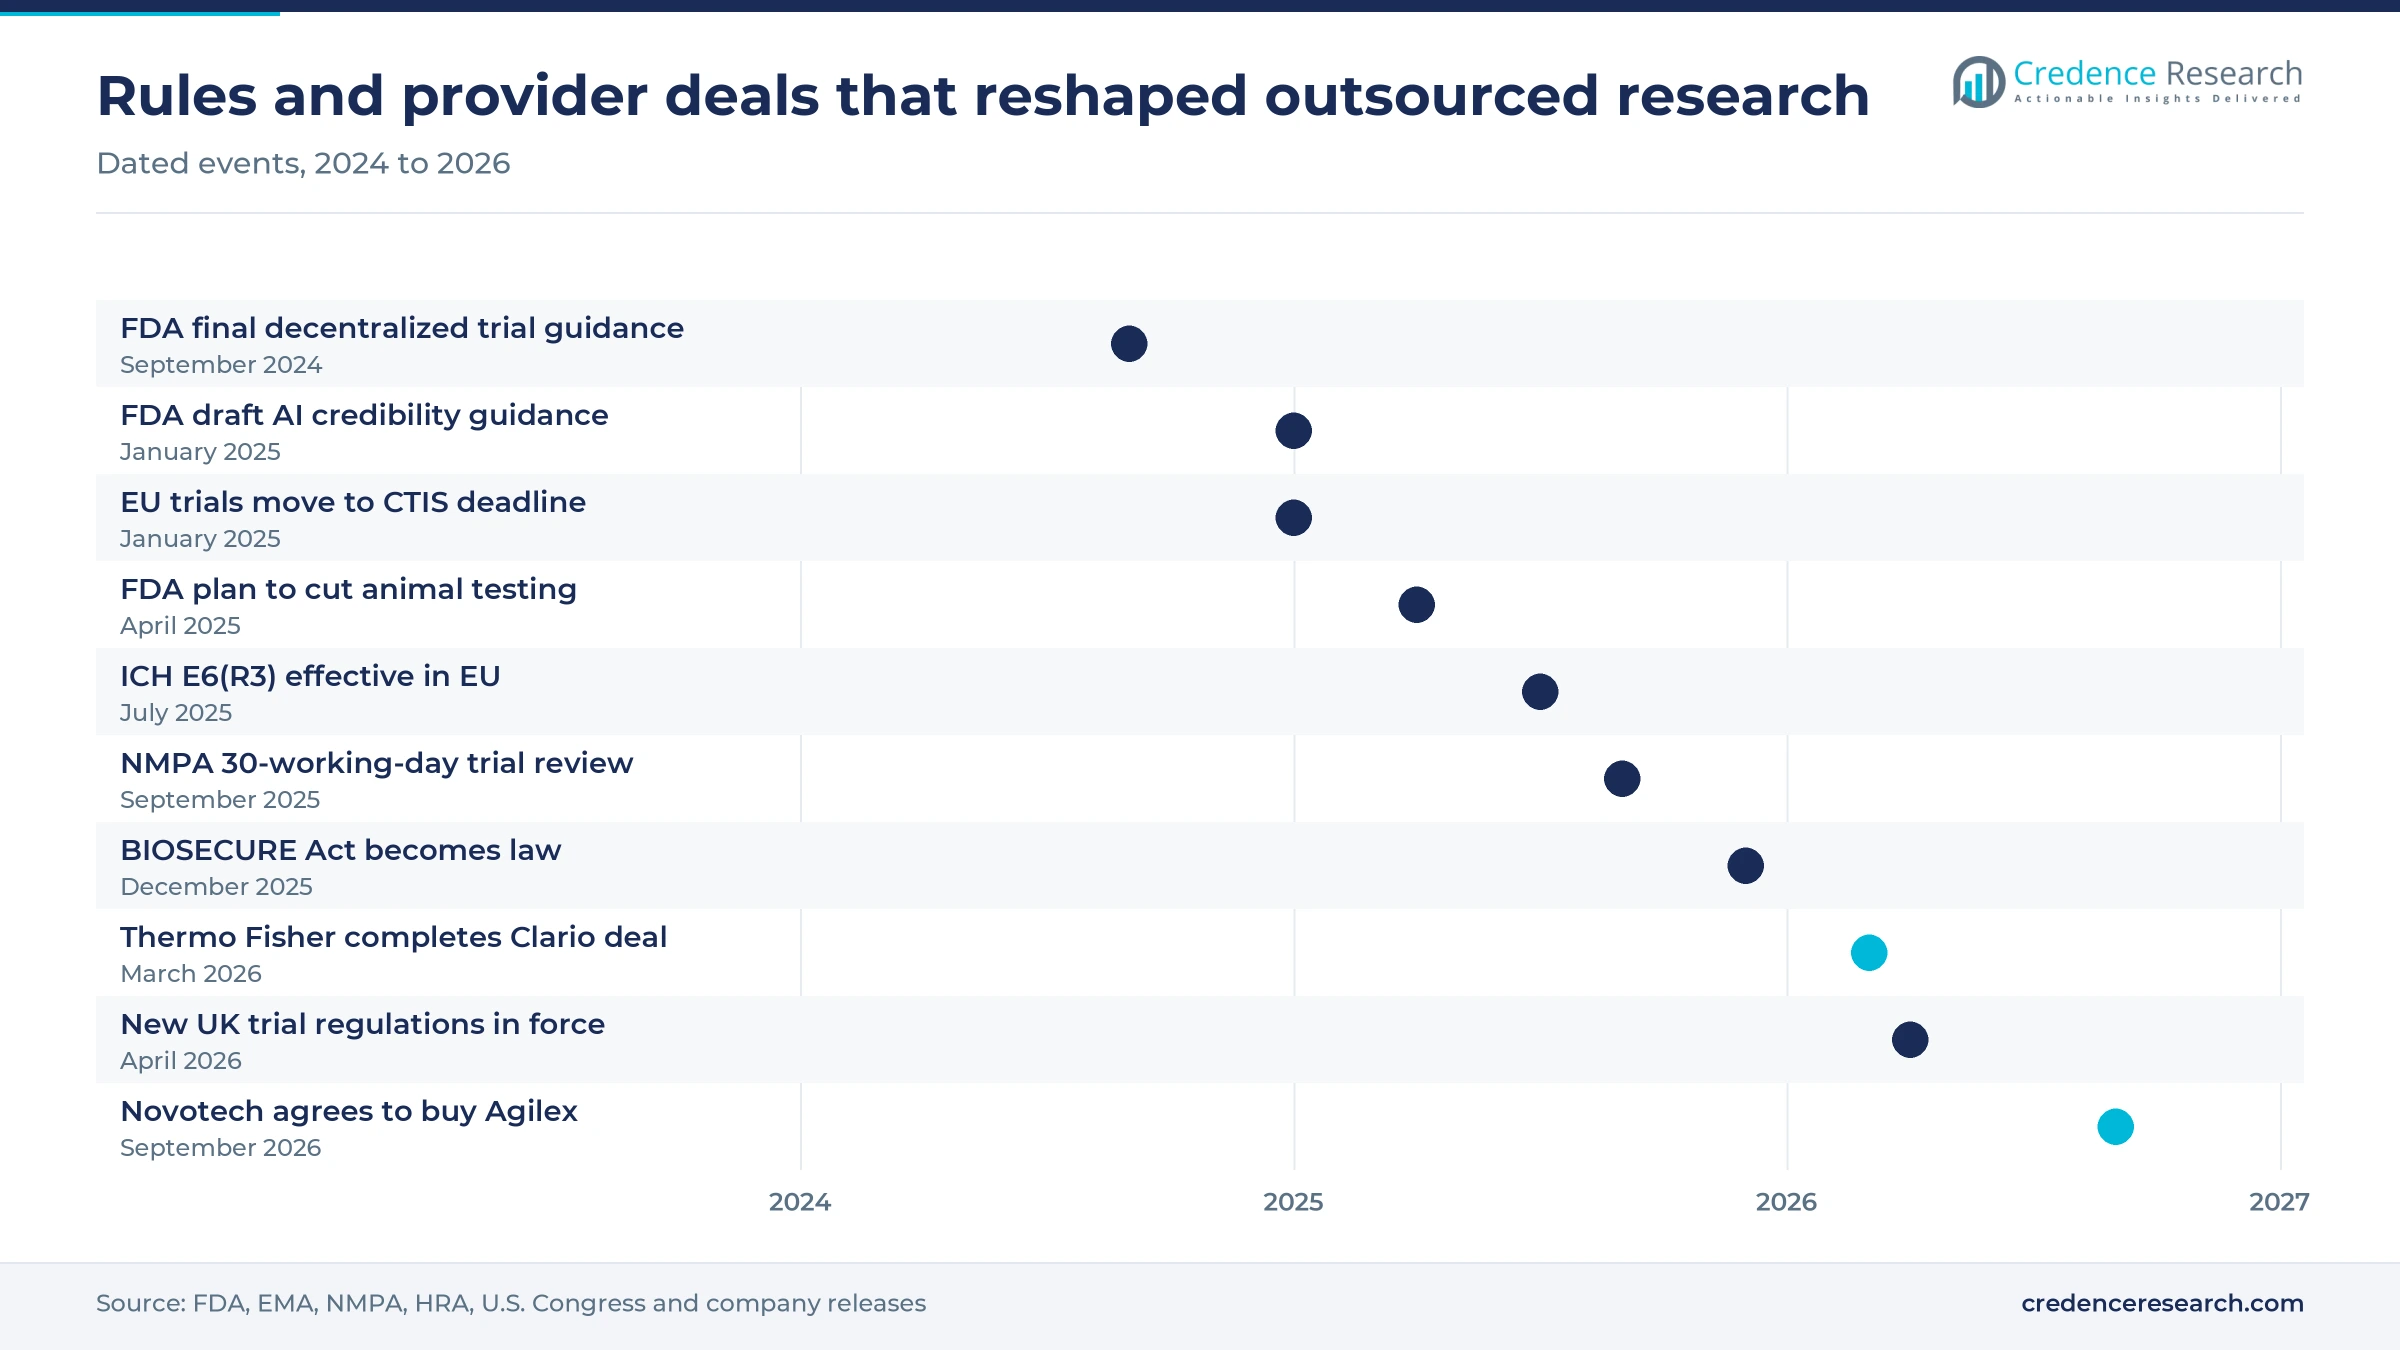
New trial rules reward sponsors that plan monitoring around risk, which favors providers with central monitoring, data review and regulatory teams over those that sell site visits alone. The revised ICH E6(R3) good clinical practice guideline took effect in the European Union on July 23, 2025, and encourages a risk-based and proportionate approach to trial conduct. All ongoing EU trials had to move to the Clinical Trials Information System by Jan. 31, 2025. The FDA issued final guidance on trials with decentralized elements in September 2024, which lets home visits and local providers replace some site work. Site monitoring made up 14.3% of Phase 3 costs in an HHS Office of the Assistant Secretary for Planning and Evaluation study, so risk-based plans target a large cost line.
European device rules push manufacturers to buy clinical evidence
Device makers must rebuild clinical evidence for products sold under old certificates, which creates outsourced study and consulting work that many mid-sized manufacturers cannot staff in-house. Under Regulation (EU) 2023/607, the Irish regulator HPRA states that class III and class IIb implantable devices must meet MDR rules by 2027. Other class IIb, class IIa and class Is and Im devices follow in 2028. Manufacturers had to apply to a notified body by May 26, 2024, and sign an agreement by Sept. 26, 2024, so studies are now running against fixed deadlines. Providers with device trial and clinical trial management system expertise gain from this fixed demand.
AI agents and animal-free testing reshape delivery
Providers are shifting toward AI agents in trial operations
Large providers are shifting toward AI agents for protocol drafting, site selection and data review to address cost pressure from sponsors, creating openings for platform-led pricing across Phase II and Phase III work. IQVIA cited more than 400 AI agents deployed to date in its October 2026 results. ICON's chief executive Barry Balfe said in the same month that its AI-enabled digital platform continues to resonate with customers. The FDA issued draft guidance on Jan. 6, 2025, that sets a seven-step credibility framework for AI models whose output supports regulatory decisions. The same HHS study put administrative staff at 20.4% of Phase 3 costs, the cost line that agents target first. Providers that document model credibility can bill for speed, while labor-heavy providers face price cuts on routine monitoring.
Preclinical testing is shifting toward animal-free methods
Preclinical providers are shifting toward new approach methodologies such as organoids, organ-on-a-chip systems and computational toxicity models, to address FDA policy and the cost and supply limits of animal studies. The FDA said on April 10, 2025, that it would phase out animal testing requirements for monoclonal antibodies and other drugs, starting with investigational new drug applications. Charles River announced on Jan. 12, 2026, that it would buy the remaining 79% of PathoQuest for EUR 51.6 million to add sequencing-based safety testing. The same announcement included a USD 510 million purchase of a primate supplier, which shows animal models will persist for years. Preclinical demand is moving step by step toward in vitro toxicology testing for early safety work.
Endpoint data platforms open a higher-margin layer of work
Sponsors need regulatory-grade endpoint data from devices, sites and patients, which opens a higher-margin layer of work above monitoring labor for providers that own the data platform. Thermo Fisher completed its purchase of Clario on March 24, 2026, for USD 8.875 billion in cash, and says the platform supported about 70% of FDA and EMA novel drug approvals over the past decade. The filing adds up to USD 400 million of earn-outs tied to 2026 and 2027 results. Providers that combine endpoint capture with eClinical software can lock in sponsors for full programs, since switching data systems mid-trial puts regulatory submissions at risk.
Australia and North Asia offer early-phase capacity openings
Sponsors want quick first-in-human studies outside the United States, which gives providers with laboratories and sites in Australia and North Asia an opening in early development. Novotech agreed in September 2026 to buy Agilex Biolabs, an Adelaide bioanalytical laboratory, with completion still subject to regulatory clearances. Syneos Health completed its purchase of Shanghai-based CRO Bestudy on March 20, 2026, keeping it as an independent unit. ClinicalTrials.gov lists 642 industry trials with an Australian site that started in 2025, against 623 in 2024. Providers that pair local Phase I units with bioanalytical testing can sell early packages to biotech sponsors that want fast human data before larger financing rounds.
Funding swings and supply-chain rules test providers
Biotech funding swings delay new study awards
Small biotech sponsors fund trials from venture rounds, so funding gaps delay awards and cancel planned studies. HSBC Innovation Banking reported that biotech venture funding fell to USD 4.8 billion in the second quarter of 2025, from USD 7 billion in the first quarter, and first financings dropped to USD 900 million. Mid-sized providers that depend on emerging biotech clients are most exposed, since one lost round can stop a program after start-up costs are spent.
Cancellations and stalled trials shrink reported backlogs
Backlog overstates future revenue when sponsors pause or end studies, which makes provider forecasts less reliable. IQVIA reported a roughly USD 2.1 billion backlog reduction in the third quarter of 2026 after reviewing inactive trials. ICON recorded USD 639 million of cancellations in the same quarter. Providers with heavy exposure to a few large programs face the greatest risk, because one portfolio review at a sponsor can remove years of planned work.
BIOSECURE rules raise supplier risk for U.S. funded work
U.S. procurement rules now restrict some Chinese biotechnology suppliers, which forces sponsors to review laboratory and testing vendors. The BIOSECURE Act became law on Dec. 18, 2025, inside the fiscal 2026 defense bill, and a full government list of companies of concern is due by Dec. 18, 2026. Latham & Watkins noted in December 2025 that WuXi AppTec was not designated under the Act, although press reports suggested it could be proposed in the next Pentagon 1260H update, so sponsors with federal funding face uncertainty until the list is published.
Home testing and cheaper sites shrink site-based billings
Sponsors can move procedures out of hospital sites, which cuts the site-visit hours that many providers bill. The HHS study cited in the drivers estimated that lower-cost facilities or in-home testing could cut a Phase 3 trial by up to USD 9.1 million, or 17%, and a Phase 2 trial by USD 4.3 million, or 22%. Providers built around site monitoring are most exposed, while those with home-nursing and remote data capture gain the shifted work.
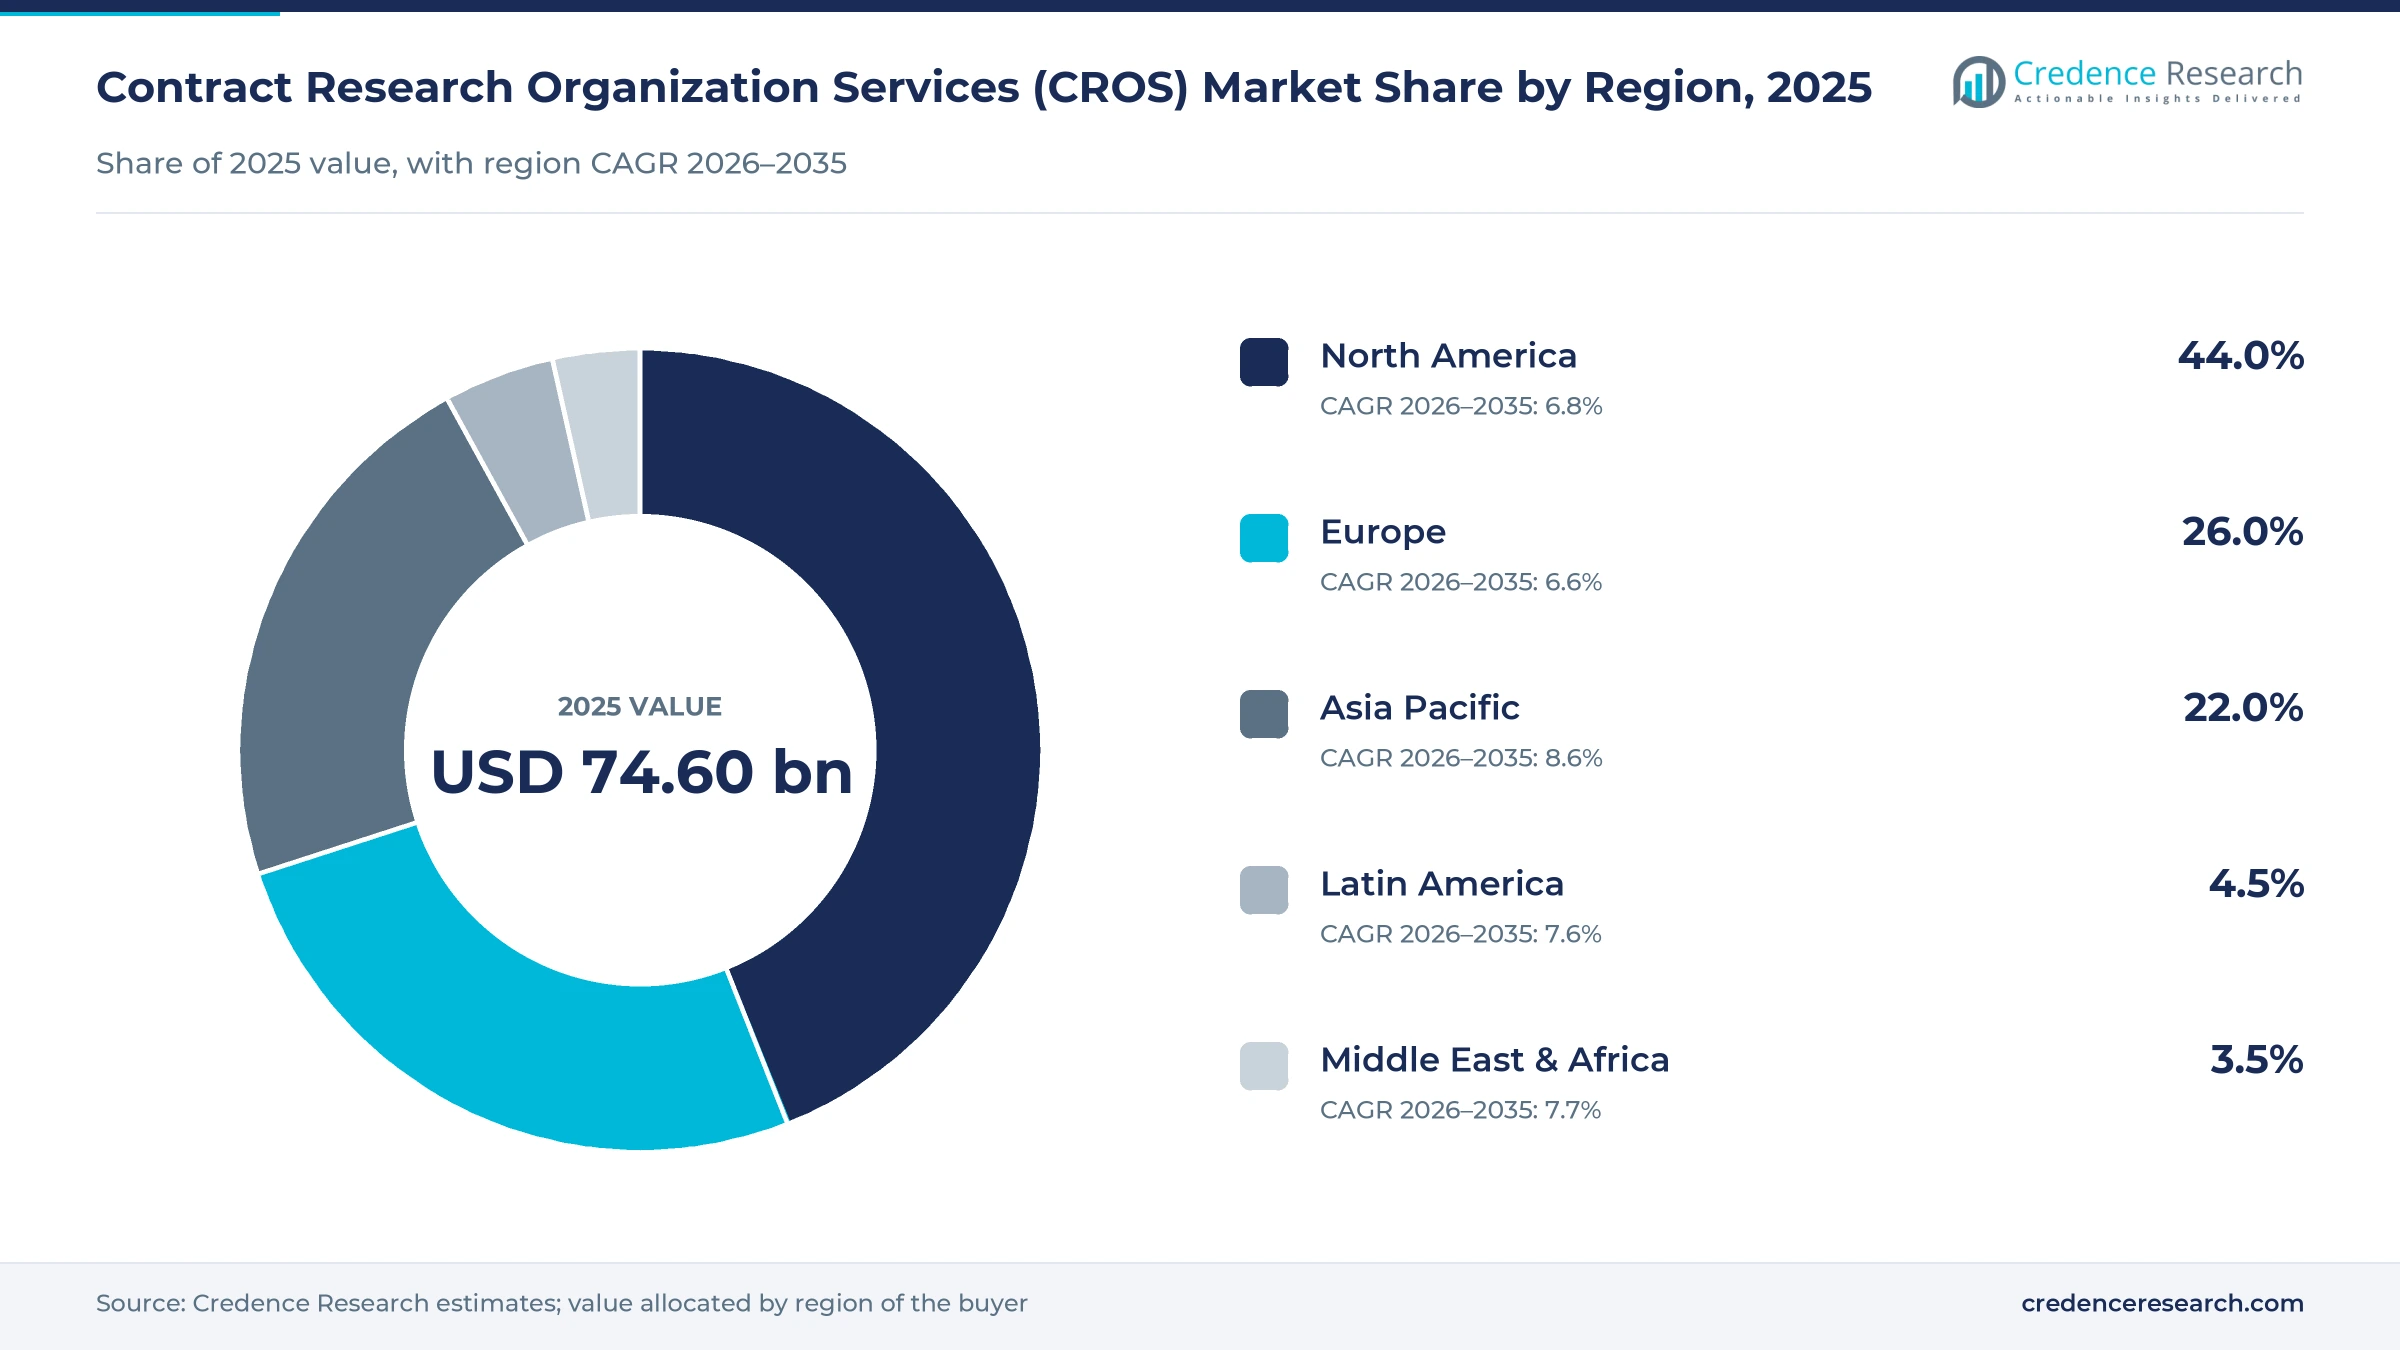
North America leads while Asia Pacific adds trial volume
| Region | Value, 2025 (USD billion) | Share, 2025 | CAGR, 2026–2035 |
|---|---|---|---|
| North America | 32.82 | 44.0% | 6.8% |
| Europe | 19.40 | 26.0% | 6.6% |
| Asia Pacific | 16.41 | 22.0% | 8.6% |
| Latin America | 3.36 | 4.5% | 7.6% |
| Middle East & Africa | 2.61 | 3.5% | 7.7% |
North America leads on trial count and sponsor base
North America held a 44.0% share of 2025 value and grows at 6.8% a year, supported by the largest sponsor base and the deepest investigator network. ClinicalTrials.gov lists 2,527 industry-sponsored interventional trials with a U.S. site that started in 2025, against 2,417 in 2024, and 552 with a Canadian site. Most large providers run their main laboratories, data centers and project teams in the United States, which keeps pricing highest in this region. The BIOSECURE list due by Dec. 18, 2026, noted above, adds supplier reviews for U.S. sponsors that hold federal grants or contracts.
Europe gains from faster U.K. set-up and dense EU site networks
Europe held a 26.0% share of 2025 value and grows at 6.6% a year, with Spain, Germany, the United Kingdom, France and Poland each hosting hundreds of industry trial starts in 2025. New U.K. trial regulations came into force on April 28, 2026, and the combined MHRA and HRA review now averages 41 days. Set-up times for studies in that review fell from 169 days to 122 days. Central and Eastern European sites keep recruitment costs lower, which supports enrollment-heavy Phase III work.
Asia Pacific grows fastest on China volume and India reforms
Asia Pacific held a 22.0% share of 2025 value and grows fastest at 8.6% a year, led by the rise in Chinese trial starts described in the drivers. WuXi AppTec signed an agreement on Oct. 24, 2025, to sell its China clinical research and site management units to Hillhouse, to focus on its core platform. India's health ministry proposed in September 2025 to halve the test license review time from 90 to 45 days. The WHO says India accounts for almost 10% of global registered trials.
Latin America adds recruitment capacity in three countries
Latin America held a 4.5% share of 2025 value and grows at 7.6% a year, as sponsors use the region for patient recruitment in large Phase III studies. ClinicalTrials.gov lists 263 industry trials with a Brazilian site that started in 2025, 249 in Argentina and 184 in Mexico. Public data on outsourced spending by country are scarce, so the regional share is a Credence Research estimate built from trial counts.
Middle East & Africa grows from a small base led by Israel
Middle East & Africa held a 3.5% share of 2025 value and grows at 7.7% a year, from a small base of industry studies. ClinicalTrials.gov lists 258 industry trials with an Israeli site that started in 2025, 72 in South Africa, 36 in Saudi Arabia and 23 in Egypt. Published provider data for the region are limited, so this share is a Credence Research estimate with a wide margin.
Deals in 2025 and 2026 add data and Asian capacity
| Development | Status and market relevance |
|---|---|
| In March 2026, Thermo Fisher Scientific completed its acquisition of Clario Holdings, an endpoint data provider for clinical trials. | Completed acquisition; Clario joins its laboratory products and biopharma services segment with earn-outs tied to 2026 and 2027. |
| In March 2026, Syneos Health completed its acquisition of Bestudy, a Shanghai-based contract research provider. | Completed acquisition; Bestudy keeps its own leadership and brand while adding China capacity for Syneos. |
| In April 2026, Parexel acquired Vitrana, the provider of an AI-enabled pharmacovigilance technology platform. | Completed acquisition; it moves Parexel safety case processing toward platform-based delivery. |
| In September 2026, Novotech agreed to acquire Agilex Biolabs, an Adelaide bioanalytical laboratory, from a Healius unit. | Signed agreement; completion remains subject to customary conditions, including regulatory clearances. |
| In April 2026, Charles River Laboratories completed the purchase of the remaining 79% of PathoQuest, a sequencing-based testing provider. | Completed acquisitions in January and April 2026; the K.F. Cambodia primate assets closed on Jan. 14 and PathoQuest on April 17. |
Risk-based monitoring and esource change trial staffing
- Risk-based central monitoring reviews site data remotely and sends monitors only where signals appear, which reduces site visits under ICH E6(R3) and lets one monitor cover more sites across several countries.
- Electronic source and eCOA tools capture patient and site data directly, removing transcription steps and the source data checks they require, which shortens the time from last patient visit to database lock.
- AI-assisted safety case processing triages adverse event reports and drafts narratives, which lowers the cost of pharmacovigilance work for each case.
- Organ-on-a-chip and in silico models test human toxicity without animals, giving sponsors data that the FDA now encourages in early applications for monoclonal antibodies and other drugs.
Need a Custom Version of This Report?
Tailor the scope, geography, or segments to your exact requirements.
- Custom geography or segment scope
- Direct access to our analyst team
Scale, therapeutic depth and data platforms win awards
Competition turns on scale, therapeutic depth, regulatory track record and data platforms. IQVIA and ICON win large sponsor programs by pairing global site networks with analytics, while Thermo Fisher bundles PPD clinical work with laboratory testing and Clario endpoint data. Syneos, Parexel and Fortrea compete for full-service and functional awards, and Medpace sells only full-service work to drug, biotech and device sponsors. Charles River competes in preclinical safety, Labcorp in central laboratory testing, and WuXi AppTec in integrated discovery and testing after selling its China clinical units. Novotech is an Asia Pacific specialist in early-phase biotech trials. Price competition is sharpest in monitoring and functional service, where sponsors run tenders, and weakest in data platforms, where switching is costly.
A few global providers hold the large awards while specialists fill gaps
The supply side is organized in three layers of providers with different economics. Seven global full-service providers, IQVIA, ICON, Thermo Fisher's PPD, Syneos, Parexel, Fortrea and Medpace, win most multi-country Phase II and Phase III awards. Preclinical and laboratory specialists such as Charles River, Labcorp and WuXi AppTec sell testing by the study or sample. Hundreds of regional and therapeutic specialists serve biotech sponsors in single countries. Barriers are site networks, regulatory track records and data systems, and margins are highest in laboratory testing and data platforms and lowest in staff-based monitoring.
Eleven providers that sponsors shortlist
| Company | Type | Role in the market |
|---|---|---|
| IQVIA Holdings Inc. | Full-service CRO | Clinical development, real-world evidence and AI agents across trial operations |
| ICON plc | Full-service CRO | Full-service and functional clinical development with an AI-enabled digital platform |
| Thermo Fisher Scientific Inc. (PPD) | Full-service CRO and laboratory | PPD clinical research, laboratories and Clario endpoint data |
| Syneos Health, Inc. | Full-service CRO | Clinical development with Bestudy capacity in China |
| Parexel International Corporation | Full-service CRO | Clinical development and Vitrana-based pharmacovigilance |
| Fortrea Holdings Inc. | Full-service CRO | Clinical pharmacology and Phase II to IV studies, spun off from Labcorp in 2023 |
| Medpace Holdings, Inc. | Full-service CRO | Full-service clinical trials for pharmaceutical, biotech and device sponsors |
| Charles River Laboratories International, Inc. | Preclinical CRO | Discovery, safety assessment and PathoQuest animal-free testing |
| Labcorp Holdings Inc. | Central laboratory | Central laboratory services and nonclinical research for trial sponsors |
| WuXi AppTec Co., Ltd. | Integrated testing and discovery | Discovery chemistry and laboratory testing after the sale of its China clinical units |
| Novotech Health Holdings | Regional CRO | Asia Pacific early-phase trials and laboratories, with Agilex Biolabs pending |
Data control matters more than headcount for providers
Credence Research's view is that control of trial data now matters more than headcount for contract research organization services providers. Sponsors are placing awards again, as the bookings ratios show, but they increasingly judge bids on speed to database lock and data quality rather than on hourly rates. Providers that own endpoint, safety and analytics platforms can hold margins as AI tools cut monitoring hours. Staff-based providers face steady price pressure, and the largest new volume will come from Chinese and Australian early-phase studies.
Trial counts, filings and R&D budgets anchor the estimate
The report uses 2025 as the base year and 2026 to 2035 as the forecast period. Market values come from the Credence Research model and replace the earlier edition, whose narrower scope gave a lower value; they are checked against biopharma R&D budgets, public company disclosures of development and laboratory activity, and trial counts. Type, therapeutic area, end user and regional splits are Credence Research estimates built from ClinicalTrials.gov trial starts by phase, condition and country, and from announced provider activity. Sources include ClinicalTrials.gov, the FDA, EMA, NMPA, HRA, WHO, HHS and company filings. The estimates do not rely on interviews or surveys conducted by Credence Research.
Asia Pacific volume and data work shape growth to 2035
Outsourced research value rises from USD 79.97 billion in 2026 to USD 149.52 billion by 2035, with Asia Pacific adding volume fastest. North America keeps the largest base as U.S. sponsors place multi-year programs, and Europe benefits from faster U.K. and EU approvals. Data management and endpoint work will take a larger share of each contract, while monitoring hours shrink. Biotech funding, sponsor cancellations and the pace at which AI tools replace billable labor will decide whether growth lands at the upper or lower end of the range.
Biotech funding and AI pricing decide the range of outcomes
The base case assumes steady bookings, gradual biotech funding recovery and moderate AI-driven price pressure. The downside follows if biotech funding weakens again, if cancellations rise at large sponsors, or if AI tools cut billable hours faster than providers add platform fees. The upside requires faster growth in Chinese and Australian early-phase work, more device studies before the MDR deadlines and broader uptake of endpoint data platforms.
| Scenario | CAGR, 2026–2035 | Value, 2035 | What has to hold |
|---|---|---|---|
| Downside | 5.4% | USD 128.38 billion | Biotech funding falls and AI tools cut billable hours faster than new fees grow |
| Base | 7.20% | USD 149.52 billion | Bookings and biotech funding follow their 2026 path with moderate price pressure |
| Upside | 8.6% | USD 168.04 billion | Asian early-phase work and device studies expand faster than expected |
Frequently Asked Questions
How big is the contract research organization services market?
What do contract research services include?
Which companies lead CRO services?
What are the main contract research organization trends?
How are contract research organizations in the U.K. affected by new rules?
Do contract research organizations serve medical device companies?
How do contract research organizations handle real-world evidence studies?
Which region grows fastest?
Table of Content
Chapter 1 Market Segmentation
- 1.1 Segmentation Framework
- 1.1.1 Product and Service Classification
- 1.1.2 Application and End-Use Classification
- 1.1.3 Technology and Solution Classification
- 1.1.4 Customer and Distribution Channel Classification
- 1.1.5 Geographic Segmentation
- 1.1.6 Market Segment Definitions and Boundaries
- 1.2 By Type
- 1.2.1 Clinical Research Services
- 1.2.2 Early Phase Development Services
- 1.2.3 Laboratory Services
- 1.2.4 Consulting Services
- 1.2.5 Data Management Services
- 1.3 By Therapeutic Area
- 1.3.1 Oncology
- 1.3.2 Neurology
- 1.3.3 Metabolic Disorders/Endocrinology
- 1.3.4 Immunological Disorders
- 1.3.5 Infectious Diseases
- 1.3.6 CVS Disorders
- 1.3.7 Other Therapeutic Areas
- 1.4 By End User
- 1.4.1 Pharmaceutical & Biopharmaceutical Companies
- 1.4.2 Medical Device Companies
- 1.4.3 Academic Institutes
Chapter 2 Introduction
- 2.1 Report Objectives and Scope
- 2.2 Product Definition and Industry Terminology
- 2.3 Market Inclusions and Exclusions
- 2.4 Research Process
- 2.4.1 Primary Research and Expert Interviews
- 2.4.2 Secondary Research and Source Review
- 2.4.3 Top-Down and Bottom-Up Estimation
- 2.4.4 Data Triangulation and Verification
- 2.5 Market Size Measurement Basis
- 2.5.1 2025: USD 74.60 billion → 2035: USD 149.52 billion
- 2.6 Historical and Forecast Reference Periods
- 2.6.1 Historical Period: 2018-2025
- 2.6.2 Base Year: 2025
- 2.6.3 Forecast Period: 2025-2035
- 2.7 Research Assumptions and Limitations
Chapter 3 Executive Summary
- 3.1 Market Snapshot and Key Findings
- 3.2 Base-Year Market Size, 2025
- 3.3 Forecast Market Size, 2035
- 3.4 Revenue and Volume Growth Outlook
- 3.5 Key Demand and Supply Indicators
- 3.6 Leading Market Segments
- 3.7 Fastest-Growing Market Opportunities
- 3.8 Regional Performance Highlights
- 3.9 Technology and Industry Transformation
- 3.10 Competitive Landscape Summary
- 3.11 Analyst View and Strategic Implications
Chapter 4 Global Contract Research Organization Services (CROS) Market Trends and Developments
- 4.1 Historical Industry Development, 2018-2025
- 4.2 Recent Market Trends and Developments
- 4.3 Demand and Customer Behavior Trends
- 4.4 Technology and Product Innovation
- 4.5 Artificial Intelligence, Automation and Digitalization
- 4.6 Local Manufacturing and Supply Chain Realignment
- 4.7 Industry Partnerships, Mergers and Acquisitions
- 4.8 Sustainability and Circular Economy Developments
- 4.9 Government and Private Sector Investment Trends
- 4.10 Emerging Business Models and Commercialization
- 4.11 Industry Developments and Announcements
Chapter 5 Global Contract Research Organization Services (CROS) Market Supply and Demand Analysis
- 5.1 Demand Trend and Consumption Analysis, 2018-2025
- 5.2 Demand Forecast, 2025-2035
- 5.3 Supply Chain Structure and Procurement Trends
- 5.4 Supply-Demand Gap and Bottlenecks
- 5.5 Import Dependence and Sourcing Structure
- 5.6 Regional Supply and Demand Concentration
Chapter 6 Global Contract Research Organization Services (CROS) Market Pricing Analysis
- 6.1 Pricing Structure and Measurement
- 6.2 Historical Pricing Trends, 2018-2025
- 6.3 Pricing Outlook, 2025-2035
- 6.4 Pricing by Product and Market Segment
- 6.5 Geographic Pricing Differences
- 6.6 Key Input, Energy, Labor and Logistics Costs
- 6.7 Contract Pricing and Purchasing Models
- 6.8 Pricing Sensitivity and Competitive Positioning
- 6.9 Price, Margin and Profitability Implications
Chapter 7 Global Contract Research Organization Services (CROS) Market Dynamics
- 7.1 Market Growth Drivers
- 7.1.1 Demand-Side Drivers
- 7.1.2 Technology and Innovation Drivers
- 7.1.3 Infrastructure and Investment Drivers
- 7.1.4 Regulatory and Policy Drivers
- 7.2 Market Restraints
- 7.2.1 Cost and Affordability Constraints
- 7.2.2 Technology and Adoption Barriers
- 7.2.3 Supply Chain and Operational Constraints
- 7.3 Market Challenges
- 7.3.1 Competitive Pressure and Margin Erosion
- 7.3.2 Skills, Infrastructure and Implementation Gaps
- 7.4 Emerging Market Opportunities
- 7.5 Market Dynamics Impact and Time-Horizon Assessment
Chapter 8 Global Contract Research Organization Services (CROS) Value Chain Analysis
- 8.1 Industry Value Chain Overview
- 8.2 Upstream Suppliers and Critical Inputs
- 8.3 Technology and Component Providers
- 8.4 Manufacturing or Service Delivery
- 8.5 Distribution, Channel Partners and Integrators
- 8.6 Downstream Applications and End Users
- 8.7 Value Addition and Profit Pools
- 8.8 Vertical Integration and Outsourcing
- 8.9 Supplier Concentration and Risk
- 8.10 Supply Chain Localization and Resilience
Chapter 9 Global Contract Research Organization Services (CROS) Market Regulations and Policies
- 9.1 Relevant Laws, Standards and Compliance Frameworks
- 9.2 Product, Service, Safety and Quality Requirements
- 9.3 Government Policies, Incentives and Subsidies
- 9.4 Imports, Exports and Trade Barriers
- 9.5 Public Procurement and Local Content Requirements
- 9.6 Data Protection, AI and Cybersecurity Compliance
- 9.7 Upcoming Policy Changes and Market Implications
Chapter 10 Global Contract Research Organization Services (CROS) Market Hotspots and Opportunities
- 10.1 Market Opportunity Mapping and Growth Hotspots
- 10.2 High-Growth Applications and Customer Groups
- 10.3 Underserved Markets and White-Space Opportunities
- 10.4 Emerging Technology and Product Opportunities
- 10.5 New Capacity and Investment Hotspots
- 10.6 Market Entry and Expansion Opportunities
- 10.7 Distribution and Partnership Opportunities
- 10.8 Near-Term and Long-Term Commercial Potential
- 10.9 Opportunity Attractiveness and Execution Risks
Chapter 11 Global Contract Research Organization Services (CROS) Market Outlook, 2025-2035
- 11.1 Market Size and Analysis
- 11.1.1 Revenue (Market Measurement: 2025: USD 74.60 billion → 2035: USD 149.52 billion)
- 11.1.2 Historical Market Size, 2018-2025
- 11.1.3 Base-Year Market Size, 2025
- 11.2 Market Forecast, 2025-2035
- 11.2.1 Revenue Forecast to 2035
- 11.2.2 CAGR and Year-on-Year Growth
- 11.2.3 Incremental Revenue Opportunity
- 11.3 Forecast Assumptions and Scenario Analysis
- 11.3.1 Base-Case Forecast
- 11.3.2 Optimistic and Conservative Scenarios
- 11.3.3 Technology, Pricing and Policy Sensitivities
- 11.4 Market Attractiveness and Growth Outlook
Chapter 12 Global Contract Research Organization Services (CROS) Market Segmentation and Outlook
- 12.1 Segmentation Summary and Market Shares, 2025
- 12.2 Largest and Fastest-Growing Segments
- 12.3 By Type - Market Size and Forecast, 2025-2035
- 12.3.1 Segment Definition and Scope
- 12.3.2 Historical Market Size, 2018-2025
- 12.3.3 Revenue Forecast, 2025-2035
- 12.3.4 Base-Year Market Share, 2025
- 12.3.5 Segment CAGR and Growth Drivers
- 12.3.6 Subsegment Market Size and Forecast
- 12.3.6.1 Clinical Research Services
- 12.3.6.2 Early Phase Development Services
- 12.3.6.3 Laboratory Services
- 12.3.6.4 Consulting Services
- 12.3.6.5 Data Management Services
- 12.3.7 Subsegment Pricing and Adoption Trends
- 12.3.8 Leading Suppliers and Competition
- 12.3.9 Regional Demand and Opportunities
- 12.4 By Therapeutic Area - Market Size and Forecast, 2025-2035
- 12.4.1 Segment Definition and Scope
- 12.4.2 Historical Market Size, 2018-2025
- 12.4.3 Revenue Forecast, 2025-2035
- 12.4.4 Base-Year Market Share, 2025
- 12.4.5 Segment CAGR and Growth Drivers
- 12.4.6 Subsegment Market Size and Forecast
- 12.4.6.1 Oncology
- 12.4.6.2 Neurology
- 12.4.6.3 Metabolic Disorders/Endocrinology
- 12.4.6.4 Immunological Disorders
- 12.4.6.5 Infectious Diseases
- 12.4.6.6 CVS Disorders
- 12.4.6.7 Other Therapeutic Areas
- 12.4.7 Subsegment Pricing and Adoption Trends
- 12.4.8 Leading Suppliers and Competition
- 12.4.9 Regional Demand and Opportunities
- 12.5 By End User - Market Size and Forecast, 2025-2035
- 12.5.1 Segment Definition and Scope
- 12.5.2 Historical Market Size, 2018-2025
- 12.5.3 Revenue Forecast, 2025-2035
- 12.5.4 Base-Year Market Share, 2025
- 12.5.5 Segment CAGR and Growth Drivers
- 12.5.6 Subsegment Market Size and Forecast
- 12.5.6.1 Pharmaceutical & Biopharmaceutical Companies
- 12.5.6.2 Medical Device Companies
- 12.5.6.3 Academic Institutes
- 12.5.7 Subsegment Pricing and Adoption Trends
- 12.5.8 Leading Suppliers and Competition
- 12.5.9 Regional Demand and Opportunities
- 12.6 Segment Growth Comparison
- 12.7 Segment Attractiveness and Priority Matrix
Chapter 13 Global Contract Research Organization Services (CROS) End-Use and Application Market Outlook
- 13.1 End-Use Industry and Customer Demand Structure
- 13.2 Leading Applications and Customer Groups
- 13.3 End-Use Market Size, Share and Forecast
- 13.4 Major End-Use Industry Deep Dives
- 13.4.1 Customer Requirements and Use Cases
- 13.4.2 Demand and Replacement Cycles
- 13.4.3 Technical and Regulatory Considerations
- 13.4.4 Purchasing and Procurement Models
- 13.4.5 Leading Vendors and Distribution Channels
- 13.4.6 Forecast and Commercial Opportunities
- 13.5 Emerging Applications and Cross-Segment Demand
- 13.6 End-Use Industry Investment Priorities
Chapter 14 Global Contract Research Organization Services (CROS) Geographic Market Outlook, 2025-2035
- 14.1 Regional Market Size and Share, 2025
- 14.2 Regional Market Forecast, 2025-2035
- 14.3 Regional Pricing, Production and Demand Differences
- 14.4 North America
- 14.4.1 United States
- 14.4.2 Canada
- 14.4.3 Mexico
- 14.5 Europe
- 14.5.1 Germany
- 14.5.2 France
- 14.5.3 Italy
- 14.5.4 United Kingdom
- 14.5.5 Spain
- 14.5.6 Poland
- 14.5.7 Russia
- 14.5.8 Netherlands
- 14.5.9 Belgium
- 14.5.10 Sweden
- 14.5.11 Denmark
- 14.5.12 Norway
- 14.5.13 Rest of Europe
- 14.6 Asia Pacific
- 14.6.1 China
- 14.6.2 India
- 14.6.3 Japan
- 14.6.4 South Korea
- 14.6.5 Thailand
- 14.6.6 Indonesia
- 14.6.7 Vietnam
- 14.6.8 Malaysia
- 14.6.9 Australia
- 14.6.10 Rest of Asia Pacific
- 14.7 Latin America
- 14.7.1 Brazil
- 14.7.2 Argentina
- 14.7.3 Colombia
- 14.7.4 Chile
- 14.7.5 Rest of Latin America
- 14.8 Middle East
- 14.8.1 Saudi Arabia
- 14.8.2 United Arab Emirates
- 14.8.3 Turkey
- 14.8.4 Israel
- 14.8.5 Iran
- 14.8.6 Rest of the Middle East
- 14.9 Africa
- 14.9.1 South Africa
- 14.9.2 Egypt
- 14.9.3 Nigeria
- 14.9.4 Morocco
- 14.9.5 Rest of Africa
- 14.10 Regional Investment, Policy and Supply Chain Differences
- 14.11 Regional Competitive Landscape
- 14.12 Geographic Growth Hotspots
Chapter 15 Global Contract Research Organization Services (CROS) Technology, Innovation and Sustainability Outlook
- 15.1 Technology Landscape and Maturity
- 15.2 Product, Process and Service Innovation
- 15.3 AI, Automation and Digital Tools in the Industry
- 15.4 Technology Adoption and Performance Benchmarking
- 15.5 Innovation Pipeline and R&D Investment
- 15.6 Energy Efficiency and Resource Management
- 15.7 Sustainability, Recycling and Circularity
- 15.8 Technology Roadmap, 2025-2035
- 15.9 Risks of Obsolescence and Technology Substitution
Chapter 16 Global Contract Research Organization Services (CROS) Market Key Strategic Imperatives
- 16.1 Growth and Market Entry Priorities
- 16.2 High-Return Products and Segments
- 16.3 Pricing, Profitability and Cost Optimization
- 16.4 Technology Investment and Product Differentiation
- 16.5 Supply Chain Localization and Resilience
- 16.6 Distribution and Customer Acquisition
- 16.7 Partnership, Acquisition and Capacity Strategy
- 16.8 Regional Expansion Priorities
- 16.9 Short-, Medium- and Long-Term Actions
Chapter 17 Competition Outlook
- 17.1 Industry Competition Characteristics
- 17.2 Market Structure and Concentration
- 17.3 Market Share and Competitive Positioning, 2025
- 17.4 Company-Wise Revenue and Product Benchmarking
- 17.5 Production and Service Capacity Benchmarking
- 17.6 Technology, Pricing and Differentiation
- 17.7 Regional Footprint and Distribution Strength
- 17.8 Mergers, Acquisitions and Strategic Alliances
- 17.9 New Entrants and Competitive Threats
- 17.10 Porter's Five Forces and Industry Attractiveness
- 17.11 Competitive Outlook, 2025-2035
Chapter 18 Company Profiles
- 18.1 Company Coverage and Selection Criteria
- 18.2 IQVIA Holdings Inc.
- 18.2.1 Business Description
- 18.2.2 Company Ownership and Geographic Presence
- 18.2.3 Product and Service Portfolio
- 18.2.4 Manufacturing and Operating Footprint
- 18.2.5 Financial Performance and Investment
- 18.2.6 Market Share and Competitive Position
- 18.2.7 Technology and Innovation Capabilities
- 18.2.8 Strategic Alliances or Partnerships
- 18.2.9 Recent Developments
- 18.2.10 Growth Strategy and Outlook
- 18.3 ICON plc
- 18.4 Thermo Fisher Scientific Inc. (PPD)
- 18.5 Syneos Health, Inc.
- 18.6 Parexel International Corporation
- 18.7 Fortrea Holdings Inc.
- 18.8 Medpace Holdings, Inc.
- 18.9 Charles River Laboratories International, Inc.
- 18.10 Labcorp Holdings Inc.
- 18.11 WuXi AppTec Co., Ltd.
- 18.12 Novotech Health Holdings
- 18.13 Other Relevant Market Participants
Note: Every listed company is profiled on the structure shown under the first company. The company list is preliminary and may change based on research findings, market developments, data availability and client requirements.
Chapter 19 Disclaimer
- 19.1 Research and Forecast Disclaimer
- 19.2 Data Source and Estimation Limitations
Note: The depth of individual sections depends on data availability for this market. Volume, capacity, trade and other unit-based metrics are included where applicable.