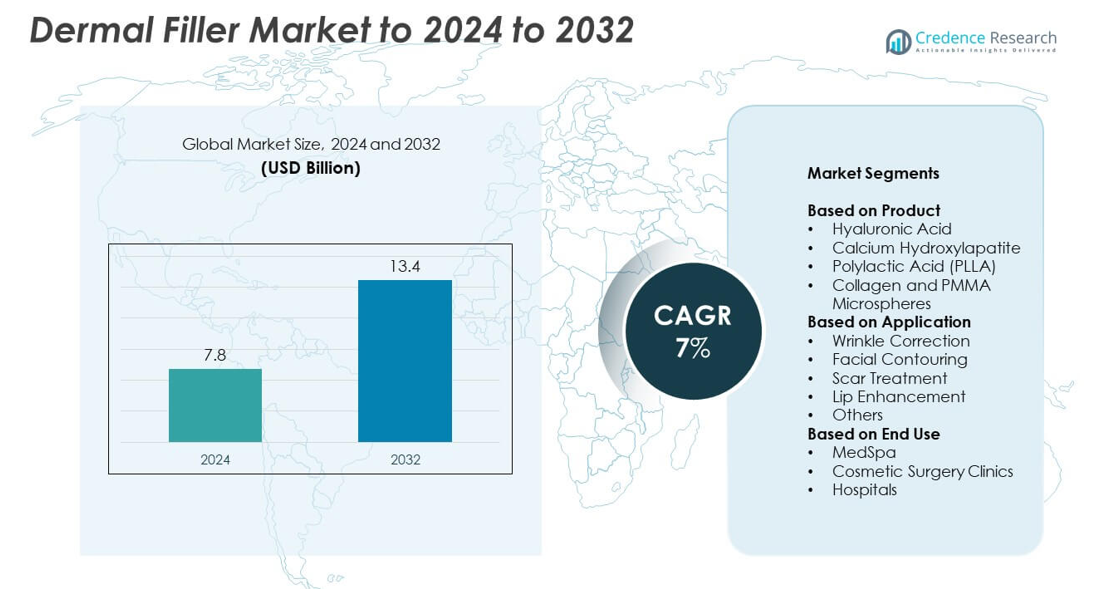
Home » Healthcare » Pharmaceuticals » Dermal Fillers Market

Global Dermal Fillers Market By Material (Hyaluronic Acid ,Calcium Hydroxylapatite ,Poly-L-lactic Acid, PMMA (Poly (Methyl Methacrylate)), Fat Fillers ,Others) By Product ( Biodegradable ,Non-Biodegradable) Growth, Future Prospects & Competitive Analysis, 2016 – 2030

Price: $4999

Published: | Report ID: 4337 | Report Format : PDF

Key Highlights of the Report

How are the major segments performing in the Dermal Fillers market?

  • The hyaluronic acid material segment held the largest market revenue share in 2022 and is anticipated to increase fastest during the forecast period. This material has a gold standard for its usage in the dermal filler procedure. Increased spending in R&D activities has been vital in developing new products, contributing to this category’s growth. This material is projected to have the highest demand for its safety and longevity compared to other materials on the market.
  • The biodegradable product segment was anticipated to hold a major global market share in 2022. The greater availability of product choices in this category compared to non-biodegradable and the wider aesthetic applications of biodegradable products account for the segment’s larger share. The increased safety and regulatory approval for the products and current R&D initiatives of large and emerging competitors to offer new products in the biodegradable category are projected to contribute to the segment’s growth.
  • The wrinkle correction treatment application category was the largest in 2022, owing to the higher global demand for these procedures. In addition, new product launches targeting this segment are expected to drive market growth. For example, Teoxane’s RHA Redensity, which can be used to lower the appearance of facial lines and wrinkles, was authorized by the US FDA in January 2022.
  • In 2022, the specialty & dermatology clinic end-user segment accounted for the largest global dermal fillers market share. The segment’s dominance can be due to the high number of cosmetic operations performed in specialist and dermatological clinics. Additionally, the fact that non-invasive aesthetic procedures like wrinkle correction do not require a hospital stay is an additional factor in why these aspects are anticipated to promote the segment’s growth.

What is the Market Size of Dermal Fillers regarding value?

The global dermal fillers market is projected to grow at a substantial CAGR of 7.8% in the upcoming years. The global Dermal Fillers industry was estimated to be worth USD 5.5 billion in 2022 and is expected to be USD 9.3 billion by 2030.

Design Element 2

Access crucial information at unmatched prices!

Request your free sample report today & start making informed decisions powered by Credence Research!

Download Free Sample
CTA Design Element 3

Which region dominated the dermal fillers market?

North America dominated the global dermal fillers market share in 2022. The region’s dominance can be attributed to factors such as the increasing popularity of minimally invasive aesthetic procedures, a high level of awareness about dermal fillers among consumers, and a well-established healthcare infrastructure. In addition, favorable reimbursement policies and the availability of advanced dermal filler products contribute to the market’s growth in this region. The presence of key market players and continuous research and development activities strengthen North America’s position in the global dermal fillers market.

Which are the key countries in the dermal fillers market?

North America currently dominates the global dermal fillers market, with the United States accounting for its largest revenue share. The country has a huge population with high awareness and desire for aesthetic procedures such as dermal fillers. Moreover, the United States is home to several significant pharmaceutical and medical device businesses that develop and manufacture dermal fillers. The modern healthcare infrastructure, well-established regulatory framework, and favorable reimbursement policies all contribute to the growth of the dermal fillers market.

Germany is another key country in the dermal fillers industry. The country has a strong healthcare system is known for its advanced medical technology industry. Germany has a significant market share in the European region and is a hub for researching, developing, and producing dermal fillers. The presence of skilled healthcare professionals, high aesthetic standards, and growing consumer demand for non-invasive cosmetic procedures drive the dermal fillers market in Germany.

How is the economy impacting global dermal fillers market growth?

The impact of the economy on the global dermal fillers market growth is multifaceted. A strong economy with high disposable income levels and consumer confidence can drive the demand for aesthetic procedures, including dermal fillers. Increased consumer spending power and focusing on personal appearance can contribute to market growth. However, during periods of economic downturn or uncertainty, consumers may prioritize essential expenses over elective cosmetic procedures, leading to a potential slowdown in market growth. Also, economic factors such as inflation, exchange rates, and government regulations can affect the pricing and availability of dermal fillers, which can further influence market dynamics.

What is the competitive environment of the dermal fillers market?

Multiple major competitors, including established pharmaceutical firms and specialized manufacturers, characterize the competitive environment in the dermal fillers market. These companies compete based on product portfolio, brand reputation, quality, innovation, pricing, and distribution channels. The global market is highly competitive, with companies constantly striving to develop advanced and effective dermal fillers to cater to the growing demand for aesthetic procedures. Key players in the market often engage in strategic developments like collaborations, mergers & acquisitions, partnerships, and new product introductions to strengthen their global market position and expand their product offerings. For instance, Allergan Aesthetica and CollPlant entered a development and global commercial partnership in February 2021 to develop and commercialize dermal and soft tissue fillers using their plant-derived recombinant human collagen (rhCollagen) and Allergan’s unique technology.

Executive Summary

What are the key trends in the Dermal Fillers market?

  • Rise in preference for minimally invasive cosmetic procedures drives dermal fillers market growth: Minimally invasive techniques have grown in popularity in recent years. Minimally invasive surgery provides patients with various advantages, including faster recovery times, smaller incisions, and less discomfort and scars. Several less invasive dermatological procedures for face rejuvenation have been developed. Injectable dermal fillers are commonly injected into the upper layers of the dermis to address superficial fine wrinkles, deep dermis, or subcutaneous space to augment facial volume. Dermal fillers are applied gradually and steadily. They fill central creases, producing a natural, long-lasting result. The significant increase in facial aesthetics demand is a key contributor to global market expansion. The American Society of Plastic Surgeons 2021 report shows roughly 13.2 million cosmetic procedures were performed in the United States, with soft tissue fillers accounting for 3.4 million of those treatments. Such compelling data demonstrates the enormous growth in demand for aesthetic operations. The increased demand for these aesthetic operations has also benefited filler product manufacturers. Various aesthetics companies are progressively introducing solutions to address the growing need for medical aesthetics.

What are the latest technological advancements in the dermal fillers market?

In recent years, the dermal fillers market has seen several technological developments. Cross-linked hyaluronic acid (HA) fillers are one of the most recent developments, offering greater stability and lifespan. Microsphere technology has also arisen, allowing the incorporation of small particles in fillers to increase volume and support. Blunt-tipped cannulas have grown in favor as they provide a safer and more precise injection technique. Microdroplet injection and the use of nanotechnology in fillers have also been important developments. These developments have improved patient outcomes and increased the number of treatment options accessible in the dermal fillers market.

Which are the key investments by the dermal fillers market players?

R&D activities to develop innovative products, strategic acquisitions, partnerships to expand their product portfolios and geographical presence, and marketing and promotional activities to increase brand awareness and market reach are among the key investments made by dermal fillers market players. They also invest in clinical trials and regulatory compliance to ensure the efficacy and safety of their products. Dermal filler manufacturers are increasing their investments in manufacturing facilities and technologies to improve production capacities and meet the growing demand for aesthetic operations.

Major dermal fillers market players are AbbVie Inc (U.S.), Revance Therapeutics Inc (U.S.), Merz Pharma (Germany), Galderma (Switzerland), Sinclair Pharma (U.K.), Bioplus Co. Ltd (South Korea), Bioxis Pharmaceuticals (France), SCULPT Luxury Dermal Fillers Ltd (Czech Republic), DR. Korman (Israel), Prollenium Medical Technologies (Canada), Suneva Medical (U.S.), and Anika Therapeutics Inc (U.S.).

What are the Major Driving Factors for the Dermal Fillers Market?

The robust demand for minimally invasive cosmetic operations and the world’s aging population are the primary drivers of the dermal fillers industry. Dermal fillers are in high demand due to the desire for a youthful appearance and increased awareness about aesthetic procedures. Dermal fillers have become more potent and durable due to technological product formulation and administration advances, further fueling market expansion. Moreover, social media, cosmetic trends, and celebrity endorsements contribute to consumers’ increased acceptance and usage of dermal fillers.

What are the Major Restraints for the Dermal Fillers Market?

The possible hazards and negative effects of dermal filler procedures pose major limitations for the industry. Infection, bruising, swelling, and allergies can all influence patient satisfaction and safety. In addition, the higher cost of dermal filler treatments may be prohibitively expensive for some consumers, particularly in emerging economies. Furthermore, the need for qualified healthcare personnel to provide the therapies and tight regulatory regulations offer barriers to market expansion.

Which is the key product in the dermal fillers market?

The biodegradable segment is expected to have the largest market share in the forecast period. These filters are typically made from biocompatible materials such as hyaluronic acid, polylactic acid, or calcium hydroxyapatite. Biodegradable dermal fillers offer several advantages, including a lower risk of adverse reactions or complications and the ability to customize the treatment based on individual patient needs. The increasing demand for biodegradable dermal fillers can be attributed to the emerging preference for natural and organic products and the need for temporary and reversible results. Moreover, the biodegradable nature of these fillers aligns with the emerging focus on sustainability and environmental consciousness.

How is the dermal filler market performing in regions?

Asia Pacific region is estimated to witness the highest dermal fillers market growth rate throughout the forecast period. The expansion of healthcare infrastructure in Asian countries, the expanding aging population, and individuals’ increasing awareness of their physical appearance are driving market growth in the region. Besides, leading industry players’ efforts to introduce their products in Asia Pacific’s major countries boost market growth. For example, Galderma reported in April 2020 that it had gained three additional approvals from the National Medical Products Administration of China (NMPA) for Restylane Lidocaine, Restylane Vital, and Restylane Lyft Lidocaine. This strategy broadens Restylane’s offering in China. Such developments are likely to add to the region’s strong growth.

What is the regulatory landscape for the dermal fillers market?

The regulatory environment for the dermal fillers industry differs by region and country. Dermal fillers are generally regarded as medical equipment or cosmetic goods regulated by health authorities and regulatory entities. These regulations aim to ensure the safety, efficacy, and quality of dermal fillers and protect the health and well-being of consumers. Regulatory requirements include pre-market approval, product registration, labeling & packaging restrictions, manufacturing standards, post-market surveillance, and adverse event reporting. Health authorities like the US FDA, the EMA, and other national regulatory bodies have specific criteria and standards for the approval, marketing, and usage of dermal fillers.

Shape Your Report to Specific Countries or Regions & Enjoy 30% Off!

What are the major players planning for the future of the dermal fillers market?

Dermal fillers market leaders focus on numerous strategies to influence the industry’s future. Product invention and development are among the tactics used to introduce new dermal fillers with improved safety, longevity, and natural-looking results. Companies also invest in research and clinical studies to acquire additional knowledge on dermal fillers’ efficacy and long-term consequences. Furthermore, market participants are expanding their geographical presence by entering new markets and forming partnerships and collaborations with healthcare experts and aesthetic clinics. They are also actively marketing and promoting dermal fillers to raise customer awareness and educate them on their benefits.

REPORT ATTRIBUTE DETAILS
Dermal Fillers Market by Volume Yes
Dermal Fillers Market by Value Yes
Dermal Fillers Market, Tornado Analysis Yes
Dermal Fillers Market, STAR Analysis Yes
Dermal Fillers Market, SRC Analysis Yes
Dermal Fillers Market, Import-Export Data Yes (On Demand)
Dermal Fillers Market Pricing Analysis Yes (On Demand)
Dermal Fillers Market Segment Analysis By Material (Hyaluronic Acid, Calcium Hydroxylapatite, Poly-L-lactic Acid, PMMA (Poly (Methyl Methacrylate)), Fat Fillers, Others)

By Product (Biodegradable, Non-Biodegradable)

By Application (Scar Treatment, Wrinkle Correction Treatment, Lip Enhancement, Restoration of Volume/Fullness, Others)

By End-User (Specialty & Dermatology Clinics, Hospitals & Clinics, Others)

Dermal Fillers Market, Regional Analysis North America (US, Canada, Mexico)

Europe (UK, France, Germany, Italy, Spain, and the Rest of Europe)

Asia Pacific (India, Japan, China, South Korea, South East Asia, and Rest of Asia Pacific)

Latin America (Argentina, Brazil, and Rest of Latin America)

Middle East and Africa (South Africa, GCC Countries, and the Rest of Middle East and Africa)

Dermal Fillers Market Key Companies AbbVie Inc (U.S.), Revance Therapeutics Inc (U.S.), Merz Pharma (Germany), Galderma (Switzerland), Sinclair Pharma (U.K.), Bioplus Co. Ltd (South Korea), Bioxis Pharmaceuticals (France), SCULPT Luxury Dermal Fillers Ltd (Czech Republic), DR. Korman (Israel), Prollenium Medical Technologies (Canada), Suneva Medical (U.S.), Anika Therapeutics Inc (U.S.)
Dermal Fillers Market Competitive Landscape Competitive Benchmarking

Market Share Analysis

Geographical Presence Analysis

Key Players Market Positioning

Major Strategies Adopted

Segmentation of Global Dermal Fillers Market-

Global Dermal Fillers Market – By Material

  • Hyaluronic Acid
  • Calcium Hydroxylapatite
  • Poly-L-lactic Acid
  • PMMA (Poly (Methyl Methacrylate))
  • Fat Fillers
  • Others

Global Dermal Fillers Market – By Product

  • Biodegradable
  • Non-Biodegradable

Global Dermal Fillers Market – By Application

  • Scar Treatment
  • Wrinkle Correction Treatment
  • Lip Enhancement
  • Restoration of Volume/Fullness
  • Others

Global Dermal Fillers Market – By End-User

  • Specialty & Dermatology Clinics
  • Hospitals & Clinics
  • Others

Global Dermal Fillers Market – By Region

  • North America
    • The U.S.
    • Canada
    • Mexico
  • Europe
    • Germany
    • France
    • The U.K.
    • Italy
    • Spain
    • Rest of Europe
  • Asia Pacific
    • China
    • Japan
    • India
    • South Korea
    • South-east Asia
    • Rest of Asia Pacific
  • Latin America
    • Brazil
    • Argentina
    • Rest of Latin America
  • Middle East & Africa
    • GCC Countries
    • South Africa
    • Rest of the Middle East and Africa

1. Preface
1.1. Report Description
1.1.1. Purpose of the Report
1.1.2. Target Audience
1.1.3. USP and Key Offerings
1.2. Research Scope
1.3. Research Methodology
1.3.1. Phase I – Secondary Research
1.3.2. Phase II – Data Modelling
1.3.2.1. Company Share Analysis Model
1.3.2.2. Revenue-Based Modelling
1.3.3. Phase III – Primary Research
1.3.4. Research Limitations
1.3.5. Assumptions
1.4. Market Introduction
1.5. Market Research Scope

2. Executive Summary
2.1. Market Snapshot: Global Dermal Fillers Market
2.2. Global Dermal Fillers Market, By Material
2.3. Global Dermal Fillers Market, By Application
2.4. Global Dermal Fillers Market, By Product
2.5. Global Dermal Fillers Market, By End-User
2.6. Global Dermal Fillers Market, By Region

3. Market Dynamics & Factors Analysis
3.1. Introduction
3.1.1. Global Dermal Fillers Market Value, 2017-2030, (US$ Bn)
3.1.2. Y-o-Y Growth Trend Analysis
3.2. Market Dynamics
3.2.1. Market Drivers
3.2.1.1. Driver 1
3.2.1.2. Driver 2
3.2.1.3. Driver 3
3.2.2. Market Restraints
3.2.2.1. Restraint 1
3.2.2.2. Restraint 2
3.2.3. Market Opportunities
3.2.3.1. Opportunity 1
3.2.3.2. Opportunity 2
3.2.4. Major Industry Challenges
3.2.4.1. Challenge 1
3.2.4.2. Challenge 2
3.3. Growth and Development Patterns
3.4. Investment Feasibility Analysis
3.5. Market Opportunity Analysis
3.5.1. Material
3.5.2. Application
3.5.3. Product
3.5.4. End-User
3.5.5. Geography

4. Premium Insights
4.1. STAR (Situation, Task, Action, Results) Analysis
4.2. Porter’s Five Forces Analysis
4.2.1. Threat of New Entrants
4.2.2. Bargaining Power of Buyers/Consumers
4.2.3. Bargaining Power of Suppliers
4.2.4. Threat of Substitute Types
4.2.5. Intensity of Competitive Rivalry
4.3. Key Market Trends
4.3.1. Demand Side Trends
4.3.2. Supply Side Trends
4.4. Value Chain Analysis
4.5. Technology Analysis
4.6. Analysis and Recommendations
4.7. Marketing Strategy Analysis
4.7.1. Direct Marketing
4.7.2. Indirect Marketing
4.7.3. Marketing Channel Development Trend

5. Market Positioning of Key Players, 2022
5.1. Company Market Share of Key Players, 2022
5.2. Competitive Benchmarking
5.3. Market Positioning of Key Vendors
5.4. Geographical Presence Analysis
5.5. Major Strategies Adopted by Key Players
5.5.1. Key Strategies Analysis
5.5.2. Mergers and Acquisitions
5.5.3. Partnerships
5.5.4. Product Launch
5.5.5. Geographical Expansion
5.5.6. Others

6. Economic Impact Analysis
6.1. Recession Impact
6.1.1. North America
6.1.2. Europe
6.1.3. Asia Pacific
6.1.4. Latin America
6.1.5. Middle East and Africa
6.2. Ukraine-Russia War Impact
6.2.1. North America
6.2.2. Europe
6.2.3. Asia Pacific
6.2.4. Latin America
6.2.5. Middle East and Africa
6.3. COVID-19 Impact Analysis
6.3.1. North America
6.3.2. Europe
6.3.3. Asia Pacific
6.3.4. Latin America
6.3.5. Middle East and Africa

7. Global Dermal Fillers Market, By Material
7.1. Global Dermal Fillers Market Overview, by Material
7.1.1. Global Dermal Fillers Market Revenue Share, By Material, 2022 Vs 2030 (in %)
7.2. Hyaluronic Acid
7.2.1. Global Dermal Fillers Market, By Region, 2017-2030 (US$ Bn)
7.3. Calcium Hydroxylapatite
7.3.1. Global Dermal Fillers Market, By Region, 2017-2030 (US$ Bn)
7.4. Poly-L-lactic Acid
7.4.1. Global Dermal Fillers Market, By Region, 2017-2030 (US$ Bn)
7.5. PMMA (Poly (Methyl Methacrylate))
7.5.1. Global Dermal Fillers Market, By Region, 2017-2030 (US$ Bn)
7.6. Fat Fillers
7.6.1. Global Dermal Fillers Market, By Region, 2017-2030 (US$ Bn)
7.7. Others
7.7.1. Global Dermal Fillers Market, By Region, 2017-2030 (US$ Bn)

8. Global Dermal Fillers Market, By Application
8.1. Global Dermal Fillers Market Overview, by Application
8.1.1. Global Dermal Fillers Market, By Application, 2022 vs 2030 (in %)
8.2. Scar Treatment
8.2.1. Global Dermal Fillers Market, By Region, 2017-2030 (US$ Bn)
8.3. Wrinkle Correction Treatment
8.3.1. Global Dermal Fillers Market, By Region, 2017-2030 (US$ Bn)
8.4. Lip Enhancement
8.4.1. Global Dermal Fillers Market, By Region, 2017-2030 (US$ Bn)
8.5. Restoration of Volume/Fullness
8.5.1. Global Dermal Fillers Market, By Region, 2017-2030 (US$ Bn)
8.6. Others
8.6.1. Global Dermal Fillers Market, By Region, 2017-2030 (US$ Bn)

9. Global Dermal Fillers Market, by Product, 2017-2030 (US$ Bn)
9.1. Global Dermal Fillers Market Overview, by Product
9.1.1. Global Dermal Fillers Market, By Product, 2022 vs 2030 (in%)
9.2. Biodegradable
9.2.1. Global Dermal Fillers Market, By Region, 2017-2030 (US$ Bn)
9.3. Non-Biodegradable
9.3.1. Global Dermal Fillers Market, By Region, 2017-2030 (US$ Bn)

10. Global Dermal Fillers Market, by End-User, 2017-2030 (US$ Bn)
10.1. Global Dermal Fillers Market Overview, by End-User
10.1.1. Global Dermal Fillers Market, By End-User, 2022 vs 2030 (in%)
10.2. Specialty & Dermatology Clinics
10.2.1. Global Dermal Fillers Market, By Region, 2017-2030 (US$ Bn)
10.3. Hospitals & Clinics
10.3.1. Global Dermal Fillers Market, By Region, 2017-2030 (US$ Bn)
10.4. Others
10.4.1. Global Dermal Fillers Market, By Region, 2017-2030 (US$ Bn)

11. Global Dermal Fillers Market, By Region
11.1. Global Dermal Fillers Market Overview, by Region
11.1.1. Global Dermal Fillers Market, By Region, 2022 vs 2030 (in%)
11.2. Material
11.2.1. Global Dermal Fillers Market, By Material, 2017-2030 (US$ Bn)
11.3. Application
11.3.1. Global Dermal Fillers Market, By Application, 2017-2030 (US$ Bn)
11.4. Product
11.4.1. Global Dermal Fillers Market, By Product, 2017-2030 (US$ Bn)
11.5. End-User
11.5.1. Global Dermal Fillers Market, By End-User, 2017-2030 (US$ Bn)

12. North America Dermal Fillers Market Analysis
12.1. North America Dermal Fillers Market, by Material, 2017-2030(US$ Bn)
12.1.1. Overview
12.1.2. SRC Analysis
12.2. North America Dermal Fillers Market, by Application, 2017-2030(US$ Bn)
12.2.1. Overview
12.2.2. SRC Analysis
12.3. North America Dermal Fillers Market, by Product, 2017-2030(US$ Bn)
12.3.1. Overview
12.3.2. SRC Analysis
12.4. North America Dermal Fillers Market, by End-User, 2017-2030(US$ Bn)
12.4.1. Overview
12.4.2. SRC Analysis
12.5. North America Dermal Fillers Market, by Country, 2017-2030 (US$ Bn)
12.5.1. North America Dermal Fillers Market, by Country, 2022 Vs 2030 (in%)
12.5.2. U.S.
12.5.2.1. U.S. Dermal Fillers Market Estimates and Forecast, 2017-2030 (US$ Bn)
12.5.2.2. U.S. Dermal Fillers, By Material, 2017-2030 (US$ Bn)
12.5.2.3. U.S. Dermal Fillers, By Application, 2017-2030 (US$ Bn)
12.5.2.4. U.S. Dermal Fillers, By Product, 2017-2030 (US$ Bn)
12.5.2.5. U.S. Dermal Fillers, By End-User, 2017-2030 (US$ Bn)
12.5.3. Canada
12.5.3.1. Canada Dermal Fillers Market Estimates and Forecast, 2017-2030 (US$ Bn)
12.5.3.2. Canada Dermal Fillers, By Material, 2017-2030 (US$ Bn)
12.5.3.3. Canada Dermal Fillers, By Application, 2017-2030 (US$ Bn)
12.5.3.4. Canada Dermal Fillers, By Product, 2017-2030 (US$ Bn)
12.5.3.5. Canada Dermal Fillers, By End-User, 2017-2030 (US$ Bn)
12.5.4. Mexico
12.5.4.1. Mexico Dermal Fillers Market Estimates and Forecast, 2017-2030 (US$ Bn)
12.5.4.2. Mexico Dermal Fillers, By Material, 2017-2030 (US$ Bn)
12.5.4.3. Mexico Dermal Fillers, By Application, 2017-2030 (US$ Bn)
12.5.4.4. Mexico Dermal Fillers, By Product, 2017-2030 (US$ Bn)
12.5.4.5. Mexico Dermal Fillers, By End-User, 2017-2030 (US$ Bn)

13. Europe Dermal Fillers Market Analysis
13.1. Europe Dermal Fillers Market, by Material, 2017-2030(US$ Bn)
13.1.1. Overview
13.1.2. SRC Analysis
13.2. Europe Dermal Fillers Market, by Application, 2017-2030(US$ Bn)
13.2.1. Overview
13.2.2. SRC Analysis
13.3. Europe Dermal Fillers Market, by Product, 2017-2030(US$ Bn)
13.3.1. Overview
13.3.2. SRC Analysis
13.4. Europe Dermal Fillers Market, by End-User, 2017-2030(US$ Bn)
13.4.1. Overview
13.4.2. SRC Analysis
13.5. Europe Dermal Fillers Market, by Country, 2017-2030 (US$ Bn)
13.5.1. Europe Dermal Fillers Market, by Country, 2022 Vs 2030 (in%)
13.5.2. Germany
13.5.2.1. Germany Dermal Fillers Market Estimates and Forecast, 2017-2030 (US$ Bn)
13.5.2.2. Germany Dermal Fillers, By Material, 2017-2030 (US$ Bn)
13.5.2.3. Germany Dermal Fillers, By Application, 2017-2030 (US$ Bn)
13.5.2.4. Germany Dermal Fillers, By Product, 2017-2030 (US$ Bn)
13.5.2.5. Germany Dermal Fillers, By End-User, 2017-2030 (US$ Bn)
13.5.3. France
13.5.3.1. France Dermal Fillers Market Estimates and Forecast, 2017-2030 (US$ Bn)
13.5.3.2. France Dermal Fillers, By Material, 2017-2030 (US$ Bn)
13.5.3.3. France Dermal Fillers, By Application, 2017-2030 (US$ Bn)
13.5.3.4. France Dermal Fillers, By Product, 2017-2030 (US$ Bn)
13.5.3.5. France Dermal Fillers, By End-User, 2017-2030 (US$ Bn)
13.5.4. UK
13.5.4.1. UK Dermal Fillers Market Estimates and Forecast, 2017-2030 (US$ Bn)
13.5.4.2. UK Dermal Fillers, By Material, 2017-2030 (US$ Bn)
13.5.4.3. UK Dermal Fillers, By Application, 2017-2030 (US$ Bn)
13.5.4.4. UK Dermal Fillers, By Product, 2017-2030 (US$ Bn)
13.5.4.5. UK Dermal Fillers, By End-User, 2017-2030 (US$ Bn)
13.5.5. Italy
13.5.5.1. Italy Dermal Fillers Market Estimates and Forecast, 2017-2030 (US$ Bn)
13.5.5.2. Italy Dermal Fillers, By Material, 2017-2030 (US$ Bn)
13.5.5.3. Italy Dermal Fillers, By Application, 2017-2030 (US$ Bn)
13.5.5.4. Italy Dermal Fillers, By Product, 2017-2030 (US$ Bn)
13.5.5.5. Italy Dermal Fillers, By End-User, 2017-2030 (US$ Bn)
13.5.6. Spain
13.5.6.1. Spain Dermal Fillers Market Estimates and Forecast, 2017-2030 (US$ Bn)
13.5.6.2. Spain Dermal Fillers, By Material, 2017-2030 (US$ Bn)
13.5.6.3. Spain Dermal Fillers, By Application, 2017-2030 (US$ Bn)
13.5.6.4. Spain Dermal Fillers, By Product, 2017-2030 (US$ Bn)
13.5.6.5. Spain Dermal Fillers, By End-User, 2017-2030 (US$ Bn)
13.5.7. Rest of Europe
13.5.7.1. Rest of Europe Dermal Fillers Market Estimates and Forecast, 2017-2030 (US$ Bn)
13.5.7.2. Rest of Europe Dermal Fillers, By Material, 2017-2030 (US$ Bn)
13.5.7.3. Rest of Europe Dermal Fillers, By Application, 2017-2030 (US$ Bn)
13.5.7.4. Rest of Europe Dermal Fillers, By Product, 2017-2030 (US$ Bn)
13.5.7.5. Rest of Europe Dermal Fillers, By End-User, 2017-2030 (US$ Bn)

14. Asia Pacific Dermal Fillers Market Analysis
14.1. Asia Pacific Dermal Fillers Market, by Material, 2017-2030(US$ Bn)
14.1.1. Overview
14.1.2. SRC Analysis
14.2. Asia Pacific Dermal Fillers Market, by Application, 2017-2030(US$ Bn)
14.2.1. Overview
14.2.2. SRC Analysis
14.3. Asia Pacific Dermal Fillers Market, by Product, 2017-2030(US$ Bn)
14.3.1. Overview
14.3.2. SRC Analysis
14.4. Asia Pacific Dermal Fillers Market, by End-User, 2017-2030(US$ Bn)
14.4.1. Overview
14.4.2. SRC Analysis
14.5. Asia Pacific Dermal Fillers Market, by Country, 2017-2030 (US$ Bn)
14.5.1. Asia Pacific Dermal Fillers Market, by Country, 2022 Vs 2030 (in%)
14.5.2. China
14.5.2.1. China Dermal Fillers Market Estimates and Forecast, 2017-2030 (US$ Bn)
14.5.2.2. China Dermal Fillers, By Material, 2017-2030 (US$ Bn)
14.5.2.3. China Dermal Fillers, By Application, 2017-2030 (US$ Bn)
14.5.2.4. China Dermal Fillers, By Product, 2017-2030 (US$ Bn)
14.5.2.5. China Dermal Fillers, By End-User, 2017-2030 (US$ Bn)
14.5.3. Japan
14.5.3.1. Japan Dermal Fillers Market Estimates and Forecast, 2017-2030 (US$ Bn)
14.5.3.2. Japan Dermal Fillers, By Material, 2017-2030 (US$ Bn)
14.5.3.3. Japan Dermal Fillers, By Application, 2017-2030 (US$ Bn)
14.5.3.4. Japan Dermal Fillers, By Product, 2017-2030 (US$ Bn)
14.5.3.5. Japan Dermal Fillers, By End-User, 2017-2030 (US$ Bn)
14.5.4. India
14.5.4.1. India Dermal Fillers Market Estimates and Forecast, 2017-2030 (US$ Bn)
14.5.4.2. India Dermal Fillers, By Material, 2017-2030 (US$ Bn)
14.5.4.3. India Dermal Fillers, By Application, 2017-2030 (US$ Bn)
14.5.4.4. India Dermal Fillers, By Product, 2017-2030 (US$ Bn)
14.5.4.5. India Dermal Fillers, By End-User, 2017-2030 (US$ Bn)
14.5.5. South Korea
14.5.5.1. South Korea Dermal Fillers Market Estimates and Forecast, 2017-2030 (US$ Bn)
14.5.5.2. South Korea Dermal Fillers, By Material, 2017-2030 (US$ Bn)
14.5.5.3. South Korea Dermal Fillers, By Application, 2017-2030 (US$ Bn)
14.5.5.4. South Korea Dermal Fillers, By Product, 2017-2030 (US$ Bn)
14.5.5.5. South Korea Dermal Fillers, By End-User, 2017-2030 (US$ Bn)
14.5.6. South-East Asia
14.5.6.1. South-East Asia Dermal Fillers Market Estimates and Forecast, 2017-2030 (US$ Bn)
14.5.6.2. South-East Asia Dermal Fillers, By Material, 2017-2030 (US$ Bn)
14.5.6.3. South-East Asia Dermal Fillers, By Application, 2017-2030 (US$ Bn)
14.5.6.4. South-East Asia Dermal Fillers, By Product, 2017-2030 (US$ Bn)
14.5.6.5. South-East Asia Dermal Fillers, By End-User, 2017-2030 (US$ Bn)
14.5.7. Rest of Asia Pacific
14.5.7.1. Rest of Asia Pacific Dermal Fillers Market Estimates and Forecast, 2017-2030 (US$ Bn)
14.5.7.2. Rest of Asia Pacific Dermal Fillers, By Material, 2017-2030 (US$ Bn)
14.5.7.3. Rest of Asia Pacific Dermal Fillers, By Application, 2017-2030 (US$ Bn)
14.5.7.4. Rest of Asia Pacific Dermal Fillers, By Product, 2017-2030 (US$ Bn)
14.5.7.5. Rest of Asia Pacific Dermal Fillers, By End-User, 2017-2030 (US$ Bn)

15. Latin America Dermal Fillers Market Analysis
15.1. Latin America Dermal Fillers Market, by Material, 2017-2030(US$ Bn)
15.1.1. Overview
15.1.2. SRC Analysis
15.2. Latin America Dermal Fillers Market, by Application, 2017-2030(US$ Bn)
15.2.1. Overview
15.2.2. SRC Analysis
15.3. Latin America Dermal Fillers Market, by Product, 2017-2030(US$ Bn)
15.3.1. Overview
15.3.2. SRC Analysis
15.4. Latin America Dermal Fillers Market, by End-User, 2017-2030(US$ Bn)
15.4.1. Overview
15.4.2. SRC Analysis
15.5. Latin America Dermal Fillers Market, by Country, 2017-2030 (US$ Bn)
15.5.1. Latin America Dermal Fillers Market, by Country, 2022 Vs 2030 (in%)
15.5.2. Brazil
15.5.2.1. Brazil Dermal Fillers Market Estimates and Forecast, 2017-2030 (US$ Bn)
15.5.2.2. Brazil Dermal Fillers, By Material, 2017-2030 (US$ Bn)
15.5.2.3. Brazil Dermal Fillers, By Application, 2017-2030 (US$ Bn)
15.5.2.4. Brazil Dermal Fillers, By Product, 2017-2030 (US$ Bn)
15.5.2.5. Brazil Dermal Fillers, By End-User, 2017-2030 (US$ Bn)
15.5.3. Argentina
15.5.3.1. Argentina Dermal Fillers Market Estimates and Forecast, 2017-2030 (US$ Bn)
15.5.3.2. Argentina Dermal Fillers, By Material, 2017-2030 (US$ Bn)
15.5.3.3. Argentina Dermal Fillers, By Application, 2017-2030 (US$ Bn)
15.5.3.4. Argentina Dermal Fillers, By Product, 2017-2030 (US$ Bn)
15.5.3.5. Argentina Dermal Fillers, By End-User, 2017-2030 (US$ Bn)
15.5.4. Rest of Latin America
15.5.4.1. Rest of Latin America Dermal Fillers Market Estimates and Forecast, 2017-2030 (US$ Bn)
15.5.4.2. Rest of Latin America Dermal Fillers, By Material, 2017-2030 (US$ Bn)
15.5.4.3. Rest of Latin America Dermal Fillers, By Application, 2017-2030 (US$ Bn)
15.5.4.4. Rest of Latin America Dermal Fillers, By Product, 2017-2030 (US$ Bn)
15.5.4.5. Rest of Latin America Dermal Fillers, By End-User, 2017-2030 (US$ Bn)

16. Middle East and Africa Dermal Fillers Market Analysis
16.1. Middle East and Africa Dermal Fillers Market, by Material, 2017-2030(US$ Bn)
16.1.1. Overview
16.1.2. SRC Analysis
16.2. Middle East and Africa Dermal Fillers Market, by Application, 2017-2030(US$ Bn)
16.2.1. Overview
16.2.2. SRC Analysis
16.3. Middle East and Africa Dermal Fillers Market, by Product, 2017-2030(US$ Bn)
16.3.1. Overview
16.3.2. SRC Analysis
16.4. Middle East and Africa Dermal Fillers Market, by End-User, 2017-2030(US$ Bn)
16.4.1. Overview
16.4.2. SRC Analysis
16.5. Middle East and Africa Dermal Fillers Market, by Country, 2017-2030 (US$ Bn)
16.5.1. Middle East and Africa Dermal Fillers Market, by Country, 2022 Vs 2030 (in%)
16.5.2. GCC Countries
16.5.2.1. GCC Countries Dermal Fillers Market Estimates and Forecast, 2017-2030 (US$ Bn)
16.5.2.2. GCC Countries Dermal Fillers, By Material, 2017-2030 (US$ Bn)
16.5.2.3. GCC Countries Dermal Fillers, By Application, 2017-2030 (US$ Bn)
16.5.2.4. GCC Countries Dermal Fillers, By Product, 2017-2030 (US$ Bn)
16.5.2.5. GCC Countries Dermal Fillers, By End-User, 2017-2030 (US$ Bn)
16.5.3. South Africa
16.5.3.1. South Africa Dermal Fillers Market Estimates and Forecast, 2017-2030 (US$ Bn)
16.5.3.2. South Africa Dermal Fillers, By Material, 2017-2030 (US$ Bn)
16.5.3.3. South Africa Dermal Fillers, By Application, 2017-2030 (US$ Bn)
16.5.3.4. South Africa Dermal Fillers, By Product, 2017-2030 (US$ Bn)
16.5.3.5. South Africa Dermal Fillers, By End-User, 2017-2030 (US$ Bn)
16.5.4. Rest of Middle East and Africa
16.5.4.1. Rest of Middle East and Africa Dermal Fillers Market Estimates and Forecast, 2017-2030 (US$ Bn)
16.5.4.2. Rest of Middle East and Africa Dermal Fillers, By Material, 2017-2030 (US$ Bn)
16.5.4.3. Rest of Middle East and Africa Dermal Fillers, By Application, 2017-2030 (US$ Bn)
16.5.4.4. Rest of Middle East and Africa Dermal Fillers, By Product, 2017-2030 (US$ Bn)
16.5.4.5. Rest of Middle East and Africa Dermal Fillers, By End-User, 2017-2030 (US$ Bn)

17. Company Profiles
17.1. AbbVie Inc (U.S.)
17.1.1. Company Overview
17.1.2. Products/Services Portfolio
17.1.3. Geographical Presence
17.1.4. Financial Summary
17.1.4.1. Market Revenue and Net Profit (2019-2022)
17.1.4.2. Business Segment Revenue Analysis
17.1.4.3. Geographical Revenue Analysis
17.2. Revance Therapeutics Inc (U.S.)
17.3. Merz Pharma (Germany)
17.4. Galderma (Switzerland)
17.5. Sinclair Pharma (U.K.)
17.6. Bioplus Co. Ltd (South Korea)
17.7. Bioxis Pharmaceuticals (France)
17.8. SCULPT Luxury Dermal Fillers Ltd (Czech Republic)
17.9. DR. Korman (Israel)
17.10. Prollenium Medical Technologies (Canada)
17.11. Suneva Medical (U.S.)
17.12. Anika Therapeutics Inc (U.S.)

List of Figures
FIG. 1 Global Dermal Fillers Market: Research Methodology
FIG. 2 Market Size Estimation – Top Down & Bottom Up Approach
FIG. 3 Global Dermal Fillers Market Segmentation
FIG. 4 Global Dermal Fillers Market, by Material, 2022 (US$ Bn)
FIG. 5 Global Dermal Fillers Market, by Application, 2022 (US$ Bn)
FIG. 6 Global Dermal Fillers Market, by Product, 2022 (US$ Bn)
FIG. 7 Global Dermal Fillers Market, by End-User, 2022 (US$ Bn)
FIG. 8 Global Dermal Fillers Market, by Geography, 2022 (US$ Bn)
FIG. 9 Attractive Investment Proposition, by Material, 2022
FIG. 10 Attractive Investment Proposition, by Application, 2022
FIG. 11 Attractive Investment Proposition, by Product, 2022
FIG. 12 Attractive Investment Proposition, by End-User, 2022
FIG. 13 Attractive Investment Proposition, by Geography, 2022
FIG. 14 Global Market Share Analysis of Key Dermal Fillers Market Manufacturers, 2022
FIG. 15 Global Market Positioning of Key Dermal Fillers Market Manufacturers, 2022
FIG. 16 Global Dermal Fillers Market Value Contribution, By Material, 2022 & 2030 (Value %)
FIG. 17 Global Dermal Fillers Market, by Hyaluronic Acid, Value, 2017-2030 (US$ Bn)
FIG. 18 Global Dermal Fillers Market, by Calcium Hydroxylapatite, Value, 2017-2030 (US$ Bn)
FIG. 19 Global Dermal Fillers Market, by Poly-L-lactic Acid, Value, 2017-2030 (US$ Bn)
FIG. 20 Global Dermal Fillers Market, by PMMA (Poly (Methyl Methacrylate)), Value, 2017-2030 (US$ Bn)
FIG. 21 Global Dermal Fillers Market, by Fat Fillers, Value, 2017-2030 (US$ Bn)
FIG. 22 Global Dermal Fillers Market, by Others, Value, 2017-2030 (US$ Bn)
FIG. 23 Global Dermal Fillers Market Value Contribution, By Application, 2022 & 2030 (Value %)
FIG. 24 Global Dermal Fillers Market, by Scar Treatment, 2017-2030 (US$ Bn)
FIG. 25 Global Dermal Fillers Market, by Wrinkle Correction Treatment, Value, 2017-2030 (US$ Bn)
FIG. 26 Global Dermal Fillers Market, by Lip Enhancement, 2017-2030 (US$ Bn)
FIG. 27 Global Dermal Fillers Market, by Restoration of Volume/Fullness, 2017-2030 (US$ Bn)
FIG. 28 Global Dermal Fillers Market, by Others, 2017-2030 (US$ Bn)
FIG. 29 Global Dermal Fillers Market Value Contribution, By Product, 2022 & 2030 (Value %)
FIG. 30 Global Dermal Fillers Market, by Biodegradable, Value, 2017-2030 (US$ Bn)
FIG. 31 Global Dermal Fillers Market, by Non-Biodegradable, 2017-2030 (US$ Bn)
FIG. 32 Global Dermal Fillers Market Value Contribution, By End-User, 2022 & 2030 (Value %)
FIG. 33 Global Dermal Fillers Market, by Specialty & Dermatology Clinics, Value, 2017-2030 (US$ Bn)
FIG. 34 Global Dermal Fillers Market, by Hospitals & Clinics, 2017-2030 (US$ Bn)
FIG. 35 Global Dermal Fillers Market, by Others, 2017-2030 (US$ Bn)
FIG. 36 North America Dermal Fillers Market, 2017-2030 (US$ Bn)
FIG. 37 U.S. Dermal Fillers Market, 2017-2030 (US$ Bn)
FIG. 38 Canada Dermal Fillers Market, 2017-2030 (US$ Bn)
FIG. 39 Europe Dermal Fillers Market, 2017-2030 (US$ Bn)
FIG. 40 Germany Dermal Fillers Market, 2017-2030 (US$ Bn)
FIG. 41 France Dermal Fillers Market, 2017-2030 (US$ Bn)
FIG. 42 U.K. Dermal Fillers Market, 2017-2030 (US$ Bn)
FIG. 43 Italy Dermal Fillers Market, 2017-2030 (US$ Bn)
FIG. 44 Spain Dermal Fillers Market, 2017-2030 (US$ Bn)
FIG. 45 Rest of Europe Dermal Fillers Market, 2017-2030 (US$ Bn)
FIG. 46 Asia Pacific Dermal Fillers Market, 2017-2030 (US$ Bn)
FIG. 47 China Dermal Fillers Market, 2017-2030 (US$ Bn)
FIG. 48 Japan Dermal Fillers Market, 2017-2030 (US$ Bn)
FIG. 49 India Dermal Fillers Market, 2017-2030 (US$ Bn)
FIG. 50 South Korea Dermal Fillers Market, 2017-2030 (US$ Bn)
FIG. 51 South-East Asia Dermal Fillers Market, 2017-2030 (US$ Bn)
FIG. 52 Rest of Asia Pacific Dermal Fillers Market, 2017-2030 (US$ Bn)
FIG. 53 Latin America Dermal Fillers Market, 2017-2030 (US$ Bn)
FIG. 54 Brazil Dermal Fillers Market, 2017-2030 (US$ Bn)
FIG. 55 Mexico Dermal Fillers Market, 2017-2030 (US$ Bn)
FIG. 56 Rest of Latin America Dermal Fillers Market, 2017-2030 (US$ Bn)
FIG. 57 Middle East & Africa Dermal Fillers Market, 2017-2030 (US$ Bn)
FIG. 58 GCC Countries Dermal Fillers Market, 2017-2030 (US$ Bn)
FIG. 59 South Africa Dermal Fillers Market, 2017-2030 (US$ Bn)
FIG. 60 Rest of Middle East and Africa Dermal Fillers Market, 2017-2030 (US$ Bn)

List of Tables
TABLE 1 Market Snapshot: Global Dermal Fillers Market
TABLE 2 Global Dermal Fillers Market: Market Drivers Impact Analysis
TABLE 3 Global Dermal Fillers Market: Market Restraints Impact Analysis
TABLE 4 Global Dermal Fillers Market, by Competitive Benchmarking, 2022
TABLE 5 Global Dermal Fillers Market, by Geographical Presence Analysis, 2022
TABLE 6 Global Dermal Fillers Market, by Key Strategies Analysis, 2022
TABLE 7 Global Dermal Fillers Market, by Hyaluronic Acid, By Region, 2017-2022 (US$ Bn)
TABLE 8 Global Dermal Fillers Market, by Hyaluronic Acid, By Region, 2023-2030 (US$ Bn)
TABLE 9 Global Dermal Fillers Market, by Calcium Hydroxylapatite, By Region, 2017-2022 (US$ Bn)
TABLE 10 Global Dermal Fillers Market, by Calcium Hydroxylapatite, By Region, 2023-2030 (US$ Bn)
TABLE 11 Global Dermal Fillers Market, by Poly-L-lactic Acid, By Region, 2017-2022 (US$ Bn)
TABLE 12 Global Dermal Fillers Market, by Poly-L-lactic Acid, By Region, 2023-2030 (US$ Bn)
TABLE 13 Global Dermal Fillers Market, by PMMA (Poly (Methyl Methacrylate)), By Region, 2017-2022 (US$ Bn)
TABLE 14 Global Dermal Fillers Market, by PMMA (Poly (Methyl Methacrylate)), By Region, 2023-2030 (US$ Bn)
TABLE 15 Global Dermal Fillers Market, by Fat Fillers, By Region, 2017-2022 (US$ Bn)
TABLE 16 Global Dermal Fillers Market, by Fat Fillers, By Region, 2023-2030 (US$ Bn)
TABLE 17 Global Dermal Fillers Market, by Scar Treatment, By Region, 2017-2022 (US$ Bn)
TABLE 18 Global Dermal Fillers Market, by Scar Treatment, By Region, 2023-2030 (US$ Bn)
TABLE 19 Global Dermal Fillers Market, by Wrinkle Correction Treatment, By Region, 2017-2022 (US$ Bn)
TABLE 20 Global Dermal Fillers Market, by Wrinkle Correction Treatment, By Region, 2023-2030 (US$ Bn)
TABLE 21 Global Dermal Fillers Market, by Lip Enhancement, By Region, 2017-2022 (US$ Bn)
TABLE 22 Global Dermal Fillers Market, by Lip Enhancement, By Region, 2023-2030 (US$ Bn)
TABLE 23 Global Dermal Fillers Market, by Restoration of Volume/Fullness, By Region, 2017-2022 (US$ Bn)
TABLE 24 Global Dermal Fillers Market, by Restoration of Volume/Fullness, By Region, 2023-2030 (US$ Bn)
TABLE 25 Global Dermal Fillers Market, by Biodegradable, By Region, 2017-2022 (US$ Bn)
TABLE 26 Global Dermal Fillers Market, by Biodegradable, By Region, 2023-2030 (US$ Bn)
TABLE 27 Global Dermal Fillers Market, by Non-Biodegradable, By Region, 2017-2022 (US$ Bn)
TABLE 28 Global Dermal Fillers Market, by Non-Biodegradable, By Region, 2023-2030 (US$ Bn)
TABLE 29 Global Dermal Fillers Market, by Specialty & Dermatology Clinics, By Region, 2017-2022 (US$ Bn)
TABLE 30 Global Dermal Fillers Market, by Specialty & Dermatology Clinics, By Region, 2023-2030 (US$ Bn)
TABLE 31 Global Dermal Fillers Market, by Hospitals & Clinics, By Region, 2017-2022 (US$ Bn)
TABLE 32 Global Dermal Fillers Market, by Hospitals & Clinics, By Region, 2023-2030 (US$ Bn)
TABLE 33 Global Dermal Fillers Market, by Others, By Region, 2017-2022 (US$ Bn)
TABLE 34 Global Dermal Fillers Market, by Others, By Region, 2023-2030 (US$ Bn)
TABLE 35 Global Dermal Fillers Market, by Material, 2017-2022 (US$ Bn)
TABLE 36 Global Dermal Fillers Market, by Material, 2023-2030 (US$ Bn)
TABLE 37 Global Dermal Fillers Market, by Application, 2017-2022 (US$ Bn)
TABLE 38 Global Dermal Fillers Market, by Application, 2023-2030 (US$ Bn)
TABLE 39 Global Dermal Fillers Market, by Product, 2017-2022 (US$ Bn)
TABLE 40 Global Dermal Fillers Market, by Product, 2023-2030 (US$ Bn)
TABLE 41 Global Dermal Fillers Market, by End-User, 2017-2022 (US$ Bn)
TABLE 42 Global Dermal Fillers Market, by End-User, 2023-2030 (US$ Bn)
TABLE 43 Global Dermal Fillers Market, by Region, 2017-2022 (US$ Bn)
TABLE 44 Global Dermal Fillers Market, by Region, 2023-2030 (US$ Bn)
TABLE 45 North America Dermal Fillers Market, by Material, 2017-2022 (US$ Bn)
TABLE 46 North America Dermal Fillers Market, by Material, 2023-2030 (US$ Bn)
TABLE 47 North America Dermal Fillers Market, by Application, 2017-2022 (US$ Bn)
TABLE 48 North America Dermal Fillers Market, by Application, 2023-2030 (US$ Bn)
TABLE 49 North America Dermal Fillers Market, by Product, 2017-2022 (US$ Bn)
TABLE 50 North America Dermal Fillers Market, by Product, 2023-2030 (US$ Bn)
TABLE 51 North America Dermal Fillers Market, by End-User, 2017-2022 (US$ Bn)
TABLE 52 North America Dermal Fillers Market, by End-User, 2023-2030 (US$ Bn)
TABLE 53 North America Dermal Fillers Market, by Country, 2017-2022 (US$ Bn)
TABLE 54 North America Dermal Fillers Market, by Country, 2023-2030 (US$ Bn)
TABLE 55 United States Dermal Fillers Market, by Material, 2017-2022 (US$ Bn)
TABLE 56 United States Dermal Fillers Market, by Material, 2023-2030 (US$ Bn)
TABLE 57 United States Dermal Fillers Market, by Application, 2017-2022 (US$ Bn)
TABLE 58 United States Dermal Fillers Market, by Application, 2023-2030 (US$ Bn)
TABLE 59 United States Dermal Fillers Market, by Product, 2017-2022 (US$ Bn)
TABLE 60 United States Dermal Fillers Market, by Product, 2023-2030 (US$ Bn)
TABLE 61 United States Dermal Fillers Market, by End-User, 2017-2022 (US$ Bn)
TABLE 62 United States Dermal Fillers Market, by End-User, 2023-2030 (US$ Bn)
TABLE 63 Canada Dermal Fillers Market, by Material, 2017-2022 (US$ Bn)
TABLE 64 Canada Dermal Fillers Market, by Material, 2023-2030 (US$ Bn)
TABLE 65 Canada Dermal Fillers Market, by Application, 2017-2022 (US$ Bn)
TABLE 66 Canada Dermal Fillers Market, by Application, 2023-2030 (US$ Bn)
TABLE 67 Canada Dermal Fillers Market, by Product, 2017-2022 (US$ Bn)
TABLE 68 Canada Dermal Fillers Market, by Product, 2023-2030 (US$ Bn)
TABLE 69 Canada Dermal Fillers Market, by End-User, 2017-2022 (US$ Bn)
TABLE 70 Canada Dermal Fillers Market, by End-User, 2023-2030 (US$ Bn)
TABLE 71 Mexico Dermal Fillers Market, by Material, 2017-2022 (US$ Bn)
TABLE 72 Mexico Dermal Fillers Market, by Material, 2023-2030 (US$ Bn)
TABLE 73 Mexico Dermal Fillers Market, by Application, 2017-2022 (US$ Bn)
TABLE 74 Mexico Dermal Fillers Market, by Application, 2023-2030 (US$ Bn)
TABLE 75 Mexico Dermal Fillers Market, by Product, 2017-2022 (US$ Bn)
TABLE 76 Mexico Dermal Fillers Market, by Product, 2023-2030 (US$ Bn)
TABLE 77 Mexico Dermal Fillers Market, by End-User, 2017-2022 (US$ Bn)
TABLE 78 Mexico Dermal Fillers Market, by End-User, 2023-2030 (US$ Bn)
TABLE 79 Europe Dermal Fillers Market, by Material, 2017-2022 (US$ Bn)
TABLE 80 Europe Dermal Fillers Market, by Material, 2023-2030 (US$ Bn)
TABLE 81 Europe Dermal Fillers Market, by Application, 2017-2022 (US$ Bn)
TABLE 82 Europe Dermal Fillers Market, by Application, 2023-2030 (US$ Bn)
TABLE 83 Europe Dermal Fillers Market, by Product, 2017-2022 (US$ Bn)
TABLE 84 Europe Dermal Fillers Market, by Product, 2023-2030 (US$ Bn)
TABLE 85 Europe Dermal Fillers Market, by End-User, 2017-2022 (US$ Bn)
TABLE 86 Europe Dermal Fillers Market, by End-User, 2023-2030 (US$ Bn)
TABLE 87 Europe Dermal Fillers Market, by Country, 2017-2022 (US$ Bn)
TABLE 88 Europe Dermal Fillers Market, by Country, 2023-2030 (US$ Bn)
TABLE 89 Germany Dermal Fillers Market, by Material, 2017-2022 (US$ Bn)
TABLE 90 Germany Dermal Fillers Market, by Material, 2023-2030 (US$ Bn)
TABLE 91 Germany Dermal Fillers Market, by Application, 2017-2022 (US$ Bn)
TABLE 92 Germany Dermal Fillers Market, by Application, 2023-2030 (US$ Bn)
TABLE 93 Germany Dermal Fillers Market, by Product, 2017-2022 (US$ Bn)
TABLE 94 Germany Dermal Fillers Market, by Product, 2023-2030 (US$ Bn)
TABLE 95 Germany Dermal Fillers Market, by End-User, 2017-2022 (US$ Bn)
TABLE 96 Germany Dermal Fillers Market, by End-User, 2023-2030 (US$ Bn)
TABLE 97 France Dermal Fillers Market, by Material, 2017-2022 (US$ Bn)
TABLE 98 France Dermal Fillers Market, by Material, 2023-2030 (US$ Bn)
TABLE 99 France Dermal Fillers Market, by Application, 2017-2022 (US$ Bn)
TABLE 100 France Dermal Fillers Market, by Application, 2023-2030 (US$ Bn)
TABLE 101 France Dermal Fillers Market, by Product, 2017-2022 (US$ Bn)
TABLE 102 France Dermal Fillers Market, by Product, 2023-2030 (US$ Bn)
TABLE 103 France Dermal Fillers Market, by End-User, 2017-2022 (US$ Bn)
TABLE 104 France Dermal Fillers Market, by End-User, 2023-2030 (US$ Bn)
TABLE 105 United Kingdom Dermal Fillers Market, by Material, 2017-2022 (US$ Bn)
TABLE 106 United Kingdom Dermal Fillers Market, by Material, 2023-2030 (US$ Bn)
TABLE 107 United Kingdom Dermal Fillers Market, by Application, 2017-2022 (US$ Bn)
TABLE 108 United Kingdom Dermal Fillers Market, by Application, 2023-2030 (US$ Bn)
TABLE 109 United Kingdom Dermal Fillers Market, by Product, 2017-2022 (US$ Bn)
TABLE 110 United Kingdom Dermal Fillers Market, by Product, 2023-2030 (US$ Bn)
TABLE 111 United Kingdom Dermal Fillers Market, by End-User, 2017-2022 (US$ Bn)
TABLE 112 United Kingdom Dermal Fillers Market, by End-User, 2023-2030 (US$ Bn)
TABLE 113 Italy Dermal Fillers Market, by Material, 2017-2022 (US$ Bn)
TABLE 114 Italy Dermal Fillers Market, by Material, 2023-2030 (US$ Bn)
TABLE 115 Italy Dermal Fillers Market, by Application, 2017-2022 (US$ Bn)
TABLE 116 Italy Dermal Fillers Market, by Application, 2023-2030 (US$ Bn)
TABLE 117 Italy Dermal Fillers Market, by Product, 2017-2022 (US$ Bn)
TABLE 118 Italy Dermal Fillers Market, by Product, 2023-2030 (US$ Bn)
TABLE 119 Italy Dermal Fillers Market, by End-User, 2017-2022 (US$ Bn)
TABLE 120 Italy Dermal Fillers Market, by End-User, 2023-2030 (US$ Bn)
TABLE 121 Spain Dermal Fillers Market, by Material, 2017-2022 (US$ Bn)
TABLE 122 Spain Dermal Fillers Market, by Material, 2023-2030 (US$ Bn)
TABLE 123 Spain Dermal Fillers Market, by Application, 2017-2022 (US$ Bn)
TABLE 124 Spain Dermal Fillers Market, by Application, 2023-2030 (US$ Bn)
TABLE 125 Spain Dermal Fillers Market, by Product, 2017-2022 (US$ Bn)
TABLE 126 Spain Dermal Fillers Market, by Product, 2023-2030 (US$ Bn)
TABLE 127 Spain Dermal Fillers Market, by End-User, 2017-2022 (US$ Bn)
TABLE 128 Spain Dermal Fillers Market, by End-User, 2023-2030 (US$ Bn)
TABLE 129 Rest of Europe Dermal Fillers Market, by Material, 2017-2022 (US$ Bn)
TABLE 130 Rest of Europe Dermal Fillers Market, by Material, 2023-2030 (US$ Bn)
TABLE 131 Rest of Europe Dermal Fillers Market, by Application, 2017-2022 (US$ Bn)
TABLE 132 Rest of Europe Dermal Fillers Market, by Application, 2023-2030 (US$ Bn)
TABLE 133 Rest of Europe Dermal Fillers Market, by Product, 2017-2022 (US$ Bn)
TABLE 134 Rest of Europe Dermal Fillers Market, by Product, 2023-2030 (US$ Bn)
TABLE 135 Rest of Europe Dermal Fillers Market, by End-User, 2017-2022 (US$ Bn)
TABLE 136 Rest of Europe Dermal Fillers Market, by End-User, 2023-2030 (US$ Bn)
TABLE 137 Asia Pacific Dermal Fillers Market, by Material, 2017-2022 (US$ Bn)
TABLE 138 Asia Pacific Dermal Fillers Market, by Material, 2023-2030 (US$ Bn)
TABLE 139 Asia Pacific Dermal Fillers Market, by Application, 2017-2022 (US$ Bn)
TABLE 140 Asia Pacific Dermal Fillers Market, by Application, 2023-2030 (US$ Bn)
TABLE 141 Asia Pacific Dermal Fillers Market, by Product, 2017-2022 (US$ Bn)
TABLE 142 Asia Pacific Dermal Fillers Market, by Product, 2023-2030 (US$ Bn)
TABLE 143 Asia Pacific Dermal Fillers Market, by End-User, 2017-2022 (US$ Bn)
TABLE 144 Asia Pacific Dermal Fillers Market, by End-User, 2023-2030 (US$ Bn)
TABLE 145 China Dermal Fillers Market, by Material, 2017-2022 (US$ Bn)
TABLE 146 China Dermal Fillers Market, by Material, 2023-2030 (US$ Bn)
TABLE 147 China Dermal Fillers Market, by Application, 2017-2022 (US$ Bn)
TABLE 148 China Dermal Fillers Market, by Application, 2023-2030 (US$ Bn)
TABLE 149 China Dermal Fillers Market, by Product, 2017-2022 (US$ Bn)
TABLE 150 China Dermal Fillers Market, by Product, 2023-2030 (US$ Bn)
TABLE 151 China Dermal Fillers Market, by End-User, 2017-2022 (US$ Bn)
TABLE 152 China Dermal Fillers Market, by End-User, 2023-2030 (US$ Bn)
TABLE 153 Japan Dermal Fillers Market, by Material, 2017-2022 (US$ Bn)
TABLE 154 Japan Dermal Fillers Market, by Material, 2023-2030 (US$ Bn)
TABLE 155 Japan Dermal Fillers Market, by Application, 2017-2022 (US$ Bn)
TABLE 156 Japan Dermal Fillers Market, by Application, 2023-2030 (US$ Bn)
TABLE 157 Japan Dermal Fillers Market, by Product, 2017-2022 (US$ Bn)
TABLE 158 Japan Dermal Fillers Market, by Product, 2023-2030 (US$ Bn)
TABLE 159 Japan Dermal Fillers Market, by End-User, 2017-2022 (US$ Bn)
TABLE 160 Japan Dermal Fillers Market, by End-User, 2023-2030 (US$ Bn)
TABLE 161 India Dermal Fillers Market, by Material, 2017-2022 (US$ Bn)
TABLE 162 India Dermal Fillers Market, by Material, 2023-2030 (US$ Bn)
TABLE 163 India Dermal Fillers Market, by Application, 2017-2022 (US$ Bn)
TABLE 164 India Dermal Fillers Market, by Application, 2023-2030 (US$ Bn)
TABLE 165 India Dermal Fillers Market, by Product, 2017-2022 (US$ Bn)
TABLE 166 India Dermal Fillers Market, by Product, 2023-2030 (US$ Bn)
TABLE 167 India Dermal Fillers Market, by End-User, 2017-2022 (US$ Bn)
TABLE 168 India Dermal Fillers Market, by End-User, 2023-2030 (US$ Bn)
TABLE 169 South Korea Dermal Fillers Market, by Material, 2017-2022 (US$ Bn)
TABLE 170 South Korea Dermal Fillers Market, by Material, 2023-2030 (US$ Bn)
TABLE 171 South Korea Dermal Fillers Market, by Application, 2017-2022 (US$ Bn)
TABLE 172 South Korea Dermal Fillers Market, by Application, 2023-2030 (US$ Bn)
TABLE 173 South Korea Dermal Fillers Market, by Product, 2017-2022 (US$ Bn)
TABLE 174 South Korea Dermal Fillers Market, by Product, 2023-2030 (US$ Bn)
TABLE 175 South Korea Dermal Fillers Market, by End-User, 2017-2022 (US$ Bn)
TABLE 176 South Korea Dermal Fillers Market, by End-User, 2023-2030 (US$ Bn)
TABLE 177 South-East Asia Dermal Fillers Market, by Material, 2017-2022 (US$ Bn)
TABLE 178 South-East Asia Dermal Fillers Market, by Material, 2023-2030 (US$ Bn)
TABLE 179 South-East Asia Dermal Fillers Market, by Application, 2017-2022 (US$ Bn)
TABLE 180 South-East Asia Dermal Fillers Market, by Application, 2023-2030 (US$ Bn)
TABLE 181 South-East Asia Dermal Fillers Market, by Product, 2017-2022 (US$ Bn)
TABLE 182 South-East Asia Dermal Fillers Market, by Product, 2023-2030 (US$ Bn)
TABLE 183 South-East Asia Dermal Fillers Market, by End-User, 2017-2022 (US$ Bn)
TABLE 184 South-East Asia Dermal Fillers Market, by End-User, 2023-2030 (US$ Bn)
TABLE 185 Rest of Asia Pacific Dermal Fillers Market, by Material, 2017-2022 (US$ Bn)
TABLE 186 Rest of Asia Pacific Dermal Fillers Market, by Material, 2023-2030 (US$ Bn)
TABLE 187 Rest of Asia Pacific Dermal Fillers Market, by Application, 2017-2022 (US$ Bn)
TABLE 188 Rest of Asia Pacific Dermal Fillers Market, by Application, 2023-2030 (US$ Bn)
TABLE 189 Rest of Asia Pacific Dermal Fillers Market, by Product, 2017-2022 (US$ Bn)
TABLE 190 Rest of Asia Pacific Dermal Fillers Market, by Product, 2023-2030 (US$ Bn)
TABLE 191 Rest of Asia Pacific Dermal Fillers Market, by End-User, 2017-2022 (US$ Bn)
TABLE 192 Rest of Asia Pacific Dermal Fillers Market, by End-User, 2023-2030 (US$ Bn)
TABLE 193 Latin America Dermal Fillers Market, by Material, 2017-2022 (US$ Bn)
TABLE 194 Latin America Dermal Fillers Market, by Material, 2023-2030 (US$ Bn)
TABLE 195 Latin America Dermal Fillers Market, by Application, 2017-2022 (US$ Bn)
TABLE 196 Latin America Dermal Fillers Market, by Application, 2023-2030 (US$ Bn)
TABLE 197 Latin America Dermal Fillers Market, by Product, 2017-2022 (US$ Bn)
TABLE 198 Latin America Dermal Fillers Market, by Product, 2023-2030 (US$ Bn)
TABLE 199 Latin America Dermal Fillers Market, by End-User, 2017-2022 (US$ Bn)
TABLE 200 Latin America Dermal Fillers Market, by End-User, 2023-2030 (US$ Bn)
TABLE 201 Brazil Dermal Fillers Market, by Material, 2017-2022 (US$ Bn)
TABLE 202 Brazil Dermal Fillers Market, by Material, 2023-2030 (US$ Bn)
TABLE 203 Brazil Dermal Fillers Market, by Application, 2017-2022 (US$ Bn)
TABLE 204 Brazil Dermal Fillers Market, by Application, 2023-2030 (US$ Bn)
TABLE 205 Brazil Dermal Fillers Market, by Product, 2017-2022 (US$ Bn)
TABLE 206 Brazil Dermal Fillers Market, by Product, 2023-2030 (US$ Bn)
TABLE 207 Brazil Dermal Fillers Market, by End-User, 2017-2022 (US$ Bn)
TABLE 208 Brazil Dermal Fillers Market, by End-User, 2023-2030 (US$ Bn)
TABLE 209 Argentina Dermal Fillers Market, by Material, 2017-2022 (US$ Bn)
TABLE 210 Argentina Dermal Fillers Market, by Material, 2023-2030 (US$ Bn)
TABLE 211 Argentina Dermal Fillers Market, by Application, 2017-2022 (US$ Bn)
TABLE 212 Argentina Dermal Fillers Market, by Application, 2023-2030 (US$ Bn)
TABLE 213 Argentina Dermal Fillers Market, by Product, 2017-2022 (US$ Bn)
TABLE 214 Argentina Dermal Fillers Market, by Product, 2023-2030 (US$ Bn)
TABLE 215 Argentina Dermal Fillers Market, by End-User, 2017-2022 (US$ Bn)
TABLE 216 Argentina Dermal Fillers Market, by End-User, 2023-2030 (US$ Bn)
TABLE 217 Rest of Latin America Dermal Fillers Market, by Material, 2017-2022 (US$ Bn)
TABLE 218 Rest of Latin America Dermal Fillers Market, by Material, 2023-2030 (US$ Bn)
TABLE 219 Rest of Latin America Dermal Fillers Market, by Application, 2017-2022 (US$ Bn)
TABLE 220 Rest of Latin America Dermal Fillers Market, by Application, 2023-2030 (US$ Bn)
TABLE 221 Rest of Latin America Dermal Fillers Market, by Product, 2017-2022 (US$ Bn)
TABLE 222 Rest of Latin America Dermal Fillers Market, by Product, 2023-2030 (US$ Bn)
TABLE 223 Rest of Latin America Dermal Fillers Market, by End-User, 2017-2022 (US$ Bn)
TABLE 224 Rest of Latin America Dermal Fillers Market, by End-User, 2023-2030 (US$ Bn)
TABLE 225 Middle East and Africa Dermal Fillers Market, by Material, 2017-2022 (US$ Bn)
TABLE 226 Middle East and Africa Dermal Fillers Market, by Material, 2023-2030 (US$ Bn)
TABLE 227 Middle East and Africa Dermal Fillers Market, by Application, 2017-2022 (US$ Bn)
TABLE 228 Middle East and Africa Dermal Fillers Market, by Application, 2023-2030 (US$ Bn)
TABLE 229 Middle East and Africa Dermal Fillers Market, by Product, 2017-2022 (US$ Bn)
TABLE 230 Middle East and Africa Dermal Fillers Market, by Product, 2023-2030 (US$ Bn)
TABLE 231 Middle East and Africa Dermal Fillers Market, by End-User, 2017-2022 (US$ Bn)
TABLE 232 Middle East and Africa Dermal Fillers Market, by End-User, 2023-2030 (US$ Bn)
TABLE 233 GCC Countries Dermal Fillers Market, by Material, 2017-2022 (US$ Bn)
TABLE 234 GCC Countries Dermal Fillers Market, by Material, 2023-2030 (US$ Bn)
TABLE 235 GCC Countries Dermal Fillers Market, by Application, 2017-2022 (US$ Bn)
TABLE 236 GCC Countries Dermal Fillers Market, by Application, 2023-2030 (US$ Bn)
TABLE 237 GCC Countries Dermal Fillers Market, by Product, 2017-2022 (US$ Bn)
TABLE 238 GCC Countries Dermal Fillers Market, by Product, 2023-2030 (US$ Bn)
TABLE 239 GCC Countries Dermal Fillers Market, by End-User, 2017-2022 (US$ Bn)
TABLE 240 GCC Countries Dermal Fillers Market, by End-User, 2023-2030 (US$ Bn)
TABLE 241 South Africa Dermal Fillers Market, by Material, 2017-2022 (US$ Bn)
TABLE 242 South Africa Dermal Fillers Market, by Material, 2023-2030 (US$ Bn)
TABLE 243 South Africa Dermal Fillers Market, by Application, 2017-2022 (US$ Bn)
TABLE 244 South Africa Dermal Fillers Market, by Application, 2023-2030 (US$ Bn)
TABLE 245 South Africa Dermal Fillers Market, by Product, 2017-2022 (US$ Bn)
TABLE 246 South Africa Dermal Fillers Market, by Product, 2023-2030 (US$ Bn)
TABLE 247 South Africa Dermal Fillers Market, by End-User, 2017-2022 (US$ Bn)
TABLE 248 South Africa Dermal Fillers Market, by End-User, 2023-2030 (US$ Bn)
TABLE 249 Rest of Middle East and Africa Dermal Fillers Market, by Material, 2017-2022 (US$ Bn)
TABLE 250 Rest of Middle East and Africa Dermal Fillers Market, by Material, 2023-2030 (US$ Bn)
TABLE 251 Rest of Middle East and Africa Dermal Fillers Market, by Application, 2017-2022 (US$ Bn)
TABLE 252 Rest of Middle East and Africa Dermal Fillers Market, by Application, 2023-2030 (US$ Bn)
TABLE 253 Rest of Middle East and Africa Dermal Fillers Market, by Product, 2017-2022 (US$ Bn)
TABLE 254 Rest of Middle East and Africa Dermal Fillers Market, by Product, 2023-2030 (US$ Bn)
TABLE 255 Rest of Middle East and Africa Dermal Fillers Market, by End-User, 2017-2022 (US$ Bn)
TABLE 256 Rest of Middle East and Africa Dermal Fillers Market, by End-User, 2023-2030 (US$ Bn)

Frequently Asked Questions

How does COVID-19 impact the global dermal fillers market?

The global COVID-19 pandemic has been unexpected and astounding, with lower-than-expected demand across all regions compared to pre-pandemic levels. The dermal fillers market has been particularly impacted as it is considered an elective procedure and was amongst one of the first medical procedures to be hit by the lockdown. Major market companies witnessed a decline in revenue in 2020-21 compared to the previous years, as elective and non-essential procedures were significantly delayed in multiple countries.

Which is the leading region of the market for dermal fillers?

North America accounted for the most heightened global dermal fillers market share.

What are the key drivers for the growth of the dermal fillers market?

The key drivers for the growth of the dermal fillers industry are increasing demand for non-surgical cosmetic treatments, a growing aging population seeking aesthetic enhancements, advancements in product formulations and techniques, and rising beauty consciousness among consumers.

Which is the major segment in the dermal fillers market by material?

The hyaluronic acid segment had a major share in the global market in 2022.

Which is the major segment in the dermal fillers market by product?

The biodegradable segment had a major share in the global market.

Rotator Cuff Injury Treatment Market

Published:
Report ID: 36567

Aspergillosis Treatment Market

Published:
Report ID: 2106

Middle East And Africa Female Hygiene Products Market

Published:
Report ID: 8484

Therapeutic Monoclonal Antibodies Market

Published:
Report ID: 11175

Prostate Cancer Market

Published:
Report ID: 36273

Antineoplastic Agents Market

Published:
Report ID: 36065

US Retail Pharmacy Market

Published:
Report ID: 32801

OTC Vitamins Dietary Supplements Market

Published:
Report ID: 35994

Liposomes Market

Published:
Report ID: 35888

UK Iron Supplement Market

Published:
Report ID: 35709

U.S. Iron Supplement Market

Published:
Report ID: 35688

Malignant Ascites Market

Published:
Report ID: 11184

Purchase Options

$2999
Delivery Format: Excel.
$4999
Designed for the individual purchaser.
$6999
Users located at a single corporate site or regional office.
$7999
Allowed for unlimited sharing globally within one company.
Smallform of Sample request

Have a question?

User Profile

Don’t settle for less – trust Mitul to help you find the best solution.

Report delivery within 24 to 48 hours

– Other Info –

What people say?-

User Review

I am very impressed with the information in this report. The author clearly did their research when they came up with this product and it has already given me a lot of ideas.

Jana Schmidt
CEDAR CX Technologies

– Connect with us –

Phone

+91 6232 49 3207


support

24/7 Research Support


sales@credenceresearch.com

– Research Methodology –

Going beyond the basics: advanced techniques in research methodology

– Trusted By –

Pepshi, LG, Nestle
Motorola, Honeywell, Johnson and johnson
LG Chem, SIEMENS, Pfizer
Unilever, Samsonite, QIAGEN