
Market Overview
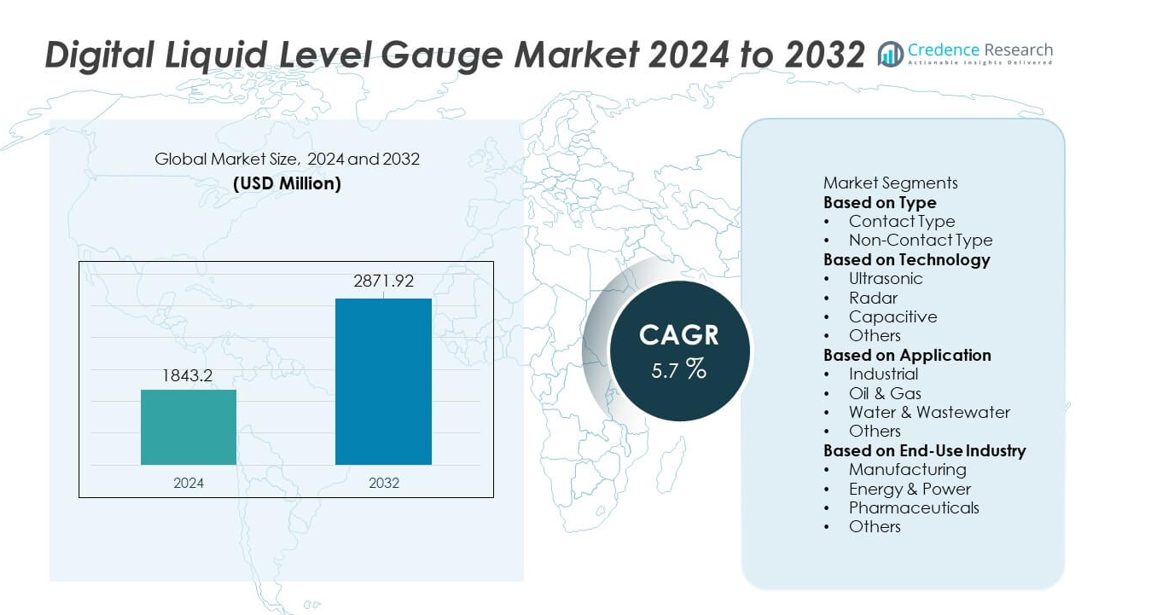
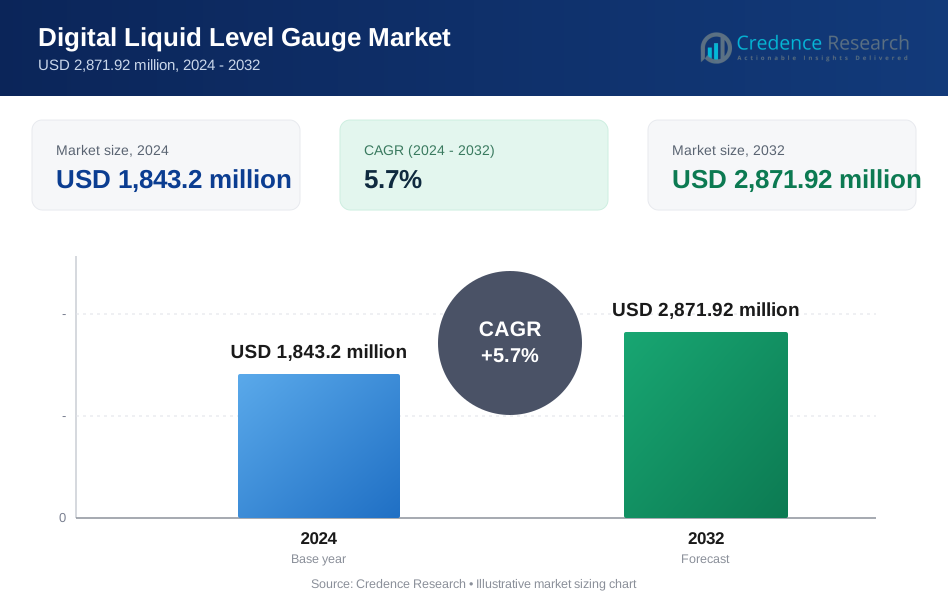
The Digital Liquid Level Gauge market was valued at USD 1,843.2 million in 2024 and is projected to reach USD 2,871.92 million by 2032, expanding at a CAGR of 5.7% during the forecast period.
| REPORT ATTRIBUTE | DETAILS |
|---|---|
| Historical Period | 2020-2023 |
| Base Year | 2024 |
| Forecast Period | 2025-2032 |
| Digital Liquid Level Gauge Market Size 2024 | USD 1,843.2 million |
| Digital Liquid Level Gauge Market, CAGR | 5.7% |
| Digital Liquid Level Gauge Market Size 2032 | USD 2,871.92 million |
The top players in the Digital Liquid Level Gauge market include Emerson Electric Co., Honeywell International Inc., Siemens AG, VEGA Grieshaber KG, Endress+Hauser Group, ABB Ltd., Yokogawa Electric Corporation, Krohne Messtechnik GmbH, Magnetrol International (AMETEK), and Schneider Electric. These companies expand their presence through advanced ultrasonic, radar, and capacitive gauge technologies that support accurate, real-time fluid monitoring in industrial environments. Asia Pacific leads the global market with a 32% share, supported by rapid industrialization and strong investment in automation. North America follows with a 28% share, driven by high adoption in oil & gas and manufacturing, while Europe holds a 25% share due to strong regulatory compliance and advanced industrial systems.
Market Insights
- The Digital Liquid Level Gauge market reached USD 1,843.2 million in 2024 and is projected to reach USD 2,871.92 million by 2032, growing at a CAGR of 5.7%.
- Market growth is driven by rising automation, increased demand in oil & gas and chemical processing, and higher adoption of non-contact gauges, with the non-contact type leading the segment at 58% share.
- Key trends include the shift toward ultrasonic and radar technologies, greater use of IoT-enabled monitoring, and development of corrosion-resistant, long-life sensors.
- Competition intensifies as major players invest in smart diagnostics, wireless connectivity, and advanced material engineering to strengthen global positioning and meet industry-specific performance needs.
- Asia Pacific leads the market with a 32% share, followed by North America at 28% and Europe at 25%, while the industrial application segment dominates overall demand with a 46% share across key end-use industries.
Market Segmentation Analysis:
By Type
Non-contact digital liquid level gauges dominate the segment with a 58% market share, driven by their accuracy, long service life, and ability to operate without direct fluid exposure. These gauges are preferred in chemical, oil & gas, and wastewater environments where contamination risks and safety standards are high. Their ability to measure corrosive, volatile, or high-temperature liquids without sensor degradation strengthens adoption across critical industries. Contact-type gauges retain demand in cost-sensitive applications but face slower growth due to maintenance needs and lower compatibility with hazardous fluids. Rising automation in fluid monitoring continues to support non-contact gauge leadership.
- For instance, Emerson Electric introduced the Rosemount 1408H non-contact level transmitter, which operates at 80 GHz and delivers a measurement range of 15 meters with ±2 millimeter accuracy. The device supports CIP and SIP cycles up to 150 °C, enabling safe use in harsh chemical tanks. Its hygienic-grade build also reduces sensor wear, extending operational life to over 10 years in continuous-duty plants.
By Technology
Ultrasonic technology holds a 41% market share, supported by strong demand for non-invasive, maintenance-free level measurement across industrial and municipal sectors. Ultrasonic gauges provide reliable readings for water, chemicals, and storage tanks, making them suitable for both fixed and portable systems. Radar-based gauges follow closely and grow faster due to superior performance in high-pressure and high-temperature environments. Capacitive sensors maintain a steady share in compact and low-cost applications. Increasing use of ultrasonic gauges in water treatment, environmental monitoring, and automated tank management continues to reinforce their market dominance.
- For instance, VEGA’s VEGASON 61 ultrasonic gauge offers a 5-meter measuring range for liquids (2m for solids), withstands process temperatures up to 80 °C, and supports IP68 submersion rating for harsh sites. The non-contact measuring principle provides maintenance-free operation in wastewater and slurry tanks where residue buildup is common.
By Application
Industrial applications lead the market with a 46% share, driven by strong adoption of digital gauges for process control, storage monitoring, and automated fluid handling. Manufacturers rely on precise level measurement to maintain quality, reduce downtime, and support predictive maintenance workflows. The oil & gas sector contributes significantly due to strict safety and compliance needs in tank farms and pipelines. Water and wastewater treatment facilities depend on advanced gauges to manage reservoirs, treatment cycles, and distribution systems. Growing automation across industrial plants strengthens the dominant position of industrial applications in the market.
Key Growth Drivers
Growing Adoption of Industrial Automation
Industrial facilities increasingly rely on automated monitoring systems, boosting demand for digital liquid level gauges that deliver precise, real-time measurements. These gauges support predictive maintenance, reduce manual inspection, and enhance process reliability in manufacturing, chemical processing, and energy operations. Automation initiatives across both developed and emerging markets accelerate replacement of traditional mechanical gauges. The shift toward sensor-enabled production lines, remote monitoring, and smart factories strengthens the need for accurate level measurement. As industries modernize their infrastructure, digital liquid level gauges play a vital role in improving operational efficiency and safety.
- For instance, Siemens introduced its SITRANS LR100 radar gauge that operates at 80 GHz and measures up to 8 meters with ± 5 mm accuracy. The device uses a 4-20 mA output and features Bluetooth connectivity for easy setup via the SITRANS mobile IQ app. Its IP66/IP68 enclosure supports continuous operation in facilities with high dust and washdown cycles.
Rising Demand in Oil & Gas and Chemical Industries
The oil & gas and chemical sectors require high-accuracy level gauges to manage storage tanks, pipelines, and process vessels under strict safety regulations. Digital gauges offer superior performance in high-pressure, high-temperature, and corrosive environments, making them essential for critical applications. Growing exploration activities, increasing petrochemical output, and rising global storage capacity support strong adoption. Companies invest in advanced non-contact technologies to reduce contamination risks and improve worker safety. Compliance-driven upgrades continue to fuel market expansion across upstream, midstream, and downstream oil & gas operations.
- For instance, Yokogawa’s EJX430A digital level transmitter handles process temperatures up to 120 °C, with standard models having maximum working pressures up to 16 MPa. The transmitter uses single-crystal silicon resonant sensors that deliver ±0.04 percent accuracy under full-scale conditions. Its 90 millisecond response time supports stable level control in high-throughput crude and chemical processing units.
Increasing Expansion of Water and Wastewater Infrastructure
Global investment in water treatment plants and wastewater management drives demand for digital level gauges that support reliable reservoir, tank, and flow monitoring. These gauges help utilities maintain system efficiency, prevent overflow incidents, and automate treatment cycles. Rapid urbanization increases pressure on water utility networks, creating a need for advanced monitoring tools. Non-contact ultrasonic and radar gauges gain strong preference due to their maintenance-free operation and accuracy in challenging conditions. As governments prioritize sustainable water management, adoption of digital liquid level gauges continues to rise across municipal and industrial water systems.
Key Trends & Opportunities
Shift Toward Non-Contact and Smart Sensor Technologies
A growing preference for non-contact measurement methods drives significant innovation in ultrasonic, radar, and laser-based digital liquid level gauges. These solutions offer longer lifespan, higher accuracy, and enhanced safety by eliminating direct fluid contact. Integration of wireless connectivity, IoT features, and cloud-based dashboards creates new opportunities for remote monitoring and digital asset management. Industries adopting Industry 4.0 practices increasingly prefer smart, self-calibrating sensors. The trend opens new growth avenues for manufacturers offering intelligent, maintenance-free level measurement technologies.
- For instance, Honeywell's SmartLine Level Transmitter SLN700 series uses 80 GHz FMCW radar and maintains ±2 millimeter accuracy over a 30 meter measuring range for liquids (up to 120m for solids). The device supports WirelessHART communication with a data update rate of approximately 1 second, enabling real-time visibility in smart plants. Its onboard diagnostics execute multiple health checks to support automated calibration workflows.
Rising Use of Durable and Corrosion-Resistant Materials
Demand increases for gauges built with corrosion-resistant alloys, advanced coatings, and polymer housings to withstand harsh industrial conditions. These enhancements improve performance in chemical tanks, offshore rigs, and high-salinity environments. Manufacturers focus on designing rugged devices that reduce maintenance costs and extend operational life. Growth in extreme-environment applications, including marine and chemical processing industries, creates strong opportunities for specialized gauge materials. This trend drives product differentiation and encourages investment in material engineering advancements.
- For instance, ABB offers level gauges and transmitters, with models such as the KM26 magnetic level gauge and the LWT series guided wave radar utilizing materials like 316L stainless steel and PVDF for corrosion resistance.
Key Challenges
High Initial Costs and Integration Complexity
Digital liquid level gauges, especially non-contact and smart variants, involve higher upfront costs compared to traditional mechanical systems. Integration with existing automation platforms requires skilled technicians and can increase installation expenses. Budget constraints in small and mid-sized industries slow adoption despite long-term savings. Compatibility issues between legacy systems and modern digital platforms further complicate upgrades. These cost and integration challenges may limit rapid market penetration in price-sensitive sectors.
Performance Limitations in Extreme Environmental Conditions
Although digital gauges deliver high accuracy, certain technologies face performance issues in environments with foam, vapor, turbulence, or high particulate content. Ultrasonic sensors may produce unreliable readings in noisy or highly pressurized conditions, while capacitive systems struggle with variable fluid properties. Industries operating in extreme conditions often require specialized, higher-cost solutions, creating adoption barriers. Environmental constraints force manufacturers to invest in advanced calibration and shielding technologies to maintain measurement precision.
Regional Analysis
North America
North America holds a 28% market share, driven by strong adoption of automation technologies across manufacturing, oil & gas, and water treatment industries. The United States leads demand due to high investments in smart monitoring systems and strict regulatory standards for fluid management. Digital liquid level gauges are widely used in storage facilities, petrochemical plants, and municipal utilities to enhance accuracy and reduce operational risks. The region’s focus on digital transformation and predictive maintenance further accelerates adoption. Expanding shale operations and modernization of industrial infrastructure continue to reinforce market growth across North America.
Europe
Europe accounts for a 25% market share, supported by advanced industrial automation, strong environmental regulations, and high adoption of precision monitoring technologies. Countries such as Germany, France, and the United Kingdom lead usage across chemical processing, pharmaceuticals, and wastewater management. The region prioritizes energy efficiency and safety compliance, increasing reliance on digital gauges for accurate level monitoring in sensitive applications. Growth in renewable energy and district heating systems further boosts demand. Continuous upgrades in industrial equipment and smart factory initiatives strengthen Europe’s position in the global market.
Asia Pacific
Asia Pacific dominates the global market with a 32% market share, driven by rapid industrialization, expanding manufacturing bases, and large-scale investments in water and wastewater infrastructure. China, India, Japan, and South Korea represent major demand centers due to rising automation and increased chemical, food processing, and oil & gas activity. The region’s growing focus on industrial safety and efficient fluid management accelerates adoption of non-contact digital gauges. Government-led infrastructure development and expanding industrial corridors continue to support strong market growth. Asia Pacific remains the fastest-growing region due to its large-scale industrial expansion.
Latin America
Latin America holds an 8% market share, driven by steady demand from oil & gas operations, mining activities, and manufacturing sectors. Countries such as Brazil, Mexico, and Argentina increasingly use digital liquid level gauges to enhance operational reliability and meet evolving safety standards. Water treatment and agricultural irrigation projects also support market expansion. Although economic fluctuations influence investment levels, modernization of industrial facilities and rising focus on automation push adoption forward. Growing awareness of digital monitoring technologies strengthens long-term growth prospects across the region.
Middle East & Africa
The Middle East & Africa region accounts for a 7% market share, supported by strong demand from oil & gas operations, desalination plants, and water management systems. Countries such as Saudi Arabia, the UAE, and South Africa rely on digital gauges for accurate monitoring in harsh and high-temperature environments. Infrastructure development and industrial expansion contribute to rising adoption across refineries, petrochemical units, and utility networks. Growing focus on efficiency, leak prevention, and environmental compliance strengthens demand. Despite varying adoption rates, the region shows steady growth driven by industrial modernization and water security initiatives.
Market Segmentations:
By Type
- Contact Type
- Non-Contact Type
By Technology
- Ultrasonic
- Radar
- Capacitive
- Others
By Application
- Industrial
- Oil & Gas
- Water & Wastewater
- Others
By End-Use Industry
- Manufacturing
- Energy & Power
- Pharmaceuticals
- Others
By Geography
- North America
- U.S.
- Canada
- Mexico
- Europe
- Germany
- France
- U.K.
- Italy
- Spain
- Rest of Europe
- Asia Pacific
- China
- Japan
- India
- South Korea
- South-east Asia
- Rest of Asia Pacific
- Latin America
- Brazil
- Argentina
- Rest of Latin America
- Middle East & Africa
- GCC Countries
- South Africa
- Rest of the Middle East and Africa
Competitive Landscape
The competitive landscape includes major players such as Emerson Electric Co., Honeywell International Inc., Siemens AG, VEGA Grieshaber KG, Endress+Hauser Group, ABB Ltd., Yokogawa Electric Corporation, Krohne Messtechnik GmbH, Magnetrol International (AMETEK), and Schneider Electric. These companies strengthen their market position through advanced sensing technologies, non-contact measurement solutions, and integration with digital automation platforms. Manufacturers focus on developing ultrasonic, radar, and capacitive gauges that deliver high accuracy, reliability, and real-time monitoring across industrial environments. Strategic investments in IoT-enabled devices, wireless connectivity, and cloud-based analytics enhance product value and support predictive maintenance applications. Partnerships with industrial automation integrators and expansion into water management, chemical processing, and oil & gas sectors further boost competitiveness. Continuous innovation in rugged materials, sensor miniaturization, and smart diagnostics helps companies meet evolving industry demands and maintain strong global presence.
Key Player Analysis
- Emerson Electric Co.
- Honeywell International Inc.
- Siemens AG
- VEGA Grieshaber KG
- Endress+Hauser Group
- ABB Ltd.
- Yokogawa Electric Corporation
- Krohne Messtechnik GmbH
- Magnetrol International (AMETEK)
- Schneider Electric
Recent Developments
- In June 2025, VEGA Grieshaber KG launched a new electronic liquid level gauge designed specifically for transformer oil conservators.
- In March 2025, a joint venture between Endress+Hauser and SICK AG for the production and development of gas analyzers and flowmeters officially commenced operations. This partnership is unrelated to Siemens or transformer oil monitoring
Report Coverage
The research report offers an in-depth analysis based on Type, Technology, Application, End-Use Industry and Geography. It details leading market players, providing an overview of their business, product offerings, investments, revenue streams, and key applications. Additionally, the report includes insights into the competitive environment, SWOT analysis, current market trends, as well as the primary drivers and constraints. Furthermore, it discusses various factors that have driven market expansion in recent years. The report also explores market dynamics, regulatory scenarios, and technological advancements that are shaping the industry. It assesses the impact of external factors and global economic changes on market growth. Lastly, it provides strategic recommendations for new entrants and established companies to navigate the complexities of the market.
Future Outlook
- Demand for digital liquid level gauges will rise as industries expand automation.
- Non-contact technologies will gain stronger adoption due to accuracy and safety benefits.
- IoT-enabled sensors will enhance remote monitoring and predictive maintenance.
- Water and wastewater infrastructure upgrades will increase gauge installations worldwide.
- Oil & gas and chemical plants will adopt advanced gauges to meet safety standards.
- Smart factories and Industry 4.0 initiatives will drive integration of intelligent level monitoring.
- Material advancements will improve durability and performance in harsh environments.
- Adoption will grow in pharmaceuticals and food processing due to strict quality control needs.
- Asia Pacific will strengthen its lead through rapid industrialization and capacity expansion.
- Manufacturers will focus on energy-efficient and maintenance-free sensor designs to meet evolving operational demands.
Request a Free Sample
Fill in your details and we'll send you a free sample report.
- Sample data tables & charts
- Research methodology
Need a Custom Version of This Report?
Tailor the scope, geography, or segments to your exact requirements.
- Custom geography or segment scope
- Direct access to our analyst team
Frequently Asked Questions
What is the current market size for the Digital Liquid Level Gauge market, and what is its projected size in 2032?
At what Compound Annual Growth Rate is the Digital Liquid Level Gauge market projected to grow between 2025 and 2032?
Which is the leading region of the market for digital liquid level gauges?
What are the key drivers for the growth of the digital liquid level gauge market?
Who are the leading companies in the Digital Liquid Level Gauge market?
Table of Content
Chapter 1. Report Introduction
- 1.1 Report Description & Purpose
- 1.1.1 Report Title & Market Definition
- 1.1.2 Unique Selling Propositions (USP) & Key Differentiators
- 1.1.3 Value Proposition for Stakeholders
- 1.2 Research Objectives
- 1.2.1 Market Sizing Objectives (Volume & Revenue)
- 1.2.2 Segmentation Objectives
- 1.2.3 Competitive Intelligence Objectives
- 1.2.4 Forecast & Scenario Objectives
- 1.3 Report Scope
- 1.3.1 Digital Liquid Level Gauge Scope – Types & Subtypes Covered
- 1.3.2 Geographic Scope – Regions & Countries Covered
- 1.3.3 Historical Period, Base Year & Forecast Period (2024; forecast to 2032)
- 1.3.4 Inclusions & Exclusions
- 1.4 HS Code & Classification Framework
- 1.5 Currency, Units & Pricing Basis
- 1.6 Target Stakeholders
- 1.7 Limitations & Assumptions
Chapter 2. Executive Summary
- 2.1 Global Digital Liquid Level Gauge Market Snapshot
- 2.1.1 Market Size – Historical (2024) & Forecast (2024-2032) (2024: USD 1,843.2 million → 2032: USD 2,871.92 million)
- 2.1.2 Volume & Revenue – Global Totals
- 2.1.3 Key Market Highlights – Top Five Facts
- 2.2 Digital Liquid Level Gauge Market Segmentation Snapshot
- 2.2.1 Market Split by Region – 2024 vs. 2032
- 2.3 Competitive Snapshot
- 2.3.1 Top 10 Players by Revenue Share – 2024
- 2.3.2 Top 10 Players by Volume Share – 2024
- 2.3.3 Recent Strategic Developments (18-Month Summary)
- 2.4 Key Investment Highlights & Strategic Conclusions
Chapter 3. Digital Liquid Level Gauge Market Dynamics & Industry Analysis
- 3.1 Market Overview & Context
- 3.1.1 Digital Liquid Level Gauge Market Position in the Broader Automotive Value Chain
- 3.1.2 OEM vs. Replacement Market Dynamics
- 3.1.3 Market Maturity & Development Stage by Region
- 3.2 Digital Liquid Level Gauge Market Drivers
- 3.3 Digital Liquid Level Gauge Market Restraints & Challenges
- 3.4 Digital Liquid Level Gauge Market Opportunities
- 3.5 Porter's Five Forces Analysis
- 3.5.1 Threat of New Entrants
- 3.5.2 Bargaining Power of Suppliers
- 3.5.3 Bargaining Power of Buyers
- 3.5.4 Threat of Substitutes
- 3.5.5 Competitive Rivalry – Intensity Assessment
- 3.6 Digital Liquid Level Gauge Value Chain Analysis
- 3.6.1 Upstream – Raw Material/Input Suppliers
- 3.6.1.1 Raw Material/Input 1
- 3.6.1.2 Raw Material/Input 2
- 3.6.1.3 Raw Material/Input 3
- 3.6.2 Midstream – Production/Manufacturing/Service Delivery
- 3.6.2.1 Production/Process Overview
- 3.6.2.2 Key Facility Locations & Capacity by Manufacturer
- 3.6.3 Downstream – Distribution & End Consumer
- 3.6.3.1 Primary Channel – B2B/OEM
- 3.6.3.2 Secondary Channels – Dealer, Retail, Online, Direct
- 3.6.4 Value Chain Profitability Analysis
- 3.6.1 Upstream – Raw Material/Input Suppliers
- 3.7 PESTEL Analysis
- 3.7.1 Political Factors
- 3.7.2 Economic Factors
- 3.7.3 Social Factors
- 3.7.4 Technological Factors
- 3.7.5 Environmental Factors
- 3.7.6 Legal Factors
- 3.8 Digital Liquid Level Gauge Supply Chain Analysis
- 3.8.1 Raw Material/Input Supply Risk Assessment
- 3.8.2 Manufacturing Concentration Risk (Geographic Exposure)
- 3.8.3 Trade Disruption Impact Analysis
- 3.9 Regulatory & Policy Landscape
Note: The regulatory and policy landscape section covers regulations based on their applicability to the market, Digital Liquid Level Gauge category, geography, and scope of the study. Only regulatory frameworks with a material impact on operations, compliance, trade, sustainability, or market access are analyzed in detail.
Chapter 4. Key Investment Pockets & Opportunity Analysis
- 4.1 Digital Liquid Level Gauge Market Attractiveness Analysis
- 4.1.1 By Region – Investment Attractiveness Matrix (Volume × CAGR)
- 4.2 Absolute Revenue Growth Opportunity
- 4.2.1 By Region – Absolute USD Growth Through 2032
- 4.3 Incremental Volume Opportunity
- 4.3.1 By Region – Incremental Volume Through 2032
- 4.3.2 Segment – Incremental Volume
- 4.4 Emerging Submarket Opportunity Deep Dive (Subject to Applicability)
- 4.5 Emerging Market Opportunity Scorecards
- 4.5.1 United States
- 4.5.2 Europe
- 4.5.3 Asia
- 4.5.4 Middle East & Africa
Note: Emerging Market Opportunity Scorecards will be included based on relevance and strategic importance. Regions listed are indicative and may vary depending on data availability and market dynamics.
Chapter 5. Digital Liquid Level Gauge Import-Export Analysis & Trade Flows
- 5.1 Global Trade Overview
- 5.1.1 Global Export Value by Country (2024)
- 5.1.2 Global Export Volume by Country (2024)
- 5.1.3 Global Import Value by Country (2024)
- 5.1.4 Global Import Volume by Country (2024)
- 5.1.5 Net Trade Balance by Country (2024)
- 5.2 Export Analysis – Segment
- 5.2.1 Type 1 (HS Code)
- 5.2.2 Type 2 (HS Code)
- 5.2.3 Type 3 (HS Code)
- 5.2.4 Type 4 (HS Code)
- 5.2.5 Type 5 (HS Code)
- 5.3 Import Analysis – Segment
- 5.3.1 Type 1 (HS Code)
- 5.3.2 Type 2 (HS Code)
- 5.3.3 Type 3 (HS Code)
- 5.3.4 Type 4 (HS Code)
- 5.3.5 Type 5 (HS Code)
- 5.4 Average Unit Trade Prices
- 5.4.1 Average Export Price – Segment & Country
- 5.4.2 Average Import Price – Segment & Source Country
- 5.4.3 Price Trends (2024)
- 5.5 Key Trade Route Analysis
- 5.5.1 Trade Route 1
- 5.5.2 Trade Route 2
- 5.5.3 Trade Route 3
- 5.5.4 Trade Route 4
- 5.5.5 Trade Route 5
- 5.6 Trade Policy Impact Assessment
- 5.6.1 US Anti-Dumping & Section 301 Tariffs
- 5.6.2 EU Customs Union Impact
- 5.6.3 Major Free Trade Agreements
- 5.6.4 USMCA Rules of Origin
Note: Trade policy analysis will be included only where relevant to the Digital Liquid Level Gauge market.
Chapter 6. Competitive Landscape & Company Benchmarking
- 6.1 Digital Liquid Level Gauge Market Concentration & Structure
- 6.1.1 Herfindahl-Hirschman Index (HHI) – vs. 2024
- 6.1.2 Tier 1, Tier 2 & Tier 3 Market Structure
- 6.1.3 Global, Regional & Local Player Dynamics
- 6.2 Digital Liquid Level Gauge Market Share Analysis – 2024
- 6.2.1 Global Revenue Share by Company
- 6.2.2 Global Volume Share by Company
- 6.2.3 Regional Revenue Share
- 6.2.4 Market Share Evolution ( vs. 2024)
- 6.2.5 OEM Segment Share by Company
- 6.2.6 Replacement Segment Share by Company
- 6.3 Production/Delivery Capacity & Facility Analysis
- 6.3.1 Global Installed Capacity
- 6.3.2 Capacity Utilization Rates
- 6.3.3 Production/Output Volume
- 6.3.4 Facility Locations & Capacity Map
- 6.3.5 Planned Capacity Additions
- 6.4 Digital Liquid Level Gauge Competitive Benchmarking Matrix
- 6.4.1 Revenue, Volume, CAGR & Profitability Comparison
- 6.4.2 Channel Revenue Mix
- 6.4.3 Geographic Revenue Exposure
- 6.4.4 R&D Intensity
- 6.4.5 Sustainability Maturity
- 6.5 Strategic Developments in Digital Liquid Level Gauge (Last 24 Months)
- 6.5.1 Mergers, Acquisitions & Divestments
- 6.5.2 New Digital Liquid Level Gauge Launches
- 6.5.3 Facility Expansions
- 6.5.4 Strategic Alliances, Joint Ventures & Partnerships
- 6.5.5 Distribution Expansion & Market Entry
- 6.5.6 Sustainability & ESG Initiatives
- 6.6 Competitive Strategy Mapping
- 6.6.1 Leader, Challenger, Follower & Niche Classification
- 6.6.2 Pricing Strategy Comparison
- 6.6.3 Channel Strategy Matrix
Note: Strategic developments are included based on their materiality and the availability of reliable information.
Chapter 7. Global Digital Liquid Level Gauge Market – By Distribution Channel
- 7.1 Segment Overview
- 7.1.1 Volume & Revenue Split by Channel (2024 & 2032)
- 7.1.2 Channel Mix Evolution (2024-2032)
Chapter 8. Regional Market Analysis – Global Overview
- 8.1 Global Regional Overview
- 8.1.1 Regional Volume Share
- 8.1.2 Regional Revenue Share
- 8.1.3 Regional Volume by Region
- 8.1.4 Regional Revenue by Region
- 8.1.5 Regional Forecast Through 2032
- 8.2 Cross-Regional Segment Analysis
- 8.2.1 By Distribution Channel
- 8.2.2 By Brand/Price Tier
Chapter 9. North America Digital Liquid Level Gauge Market
- 9.1 United States
- 9.2 Canada
- 9.3 Mexico
Chapter 10. Europe Digital Liquid Level Gauge Market
- 10.1 Germany
- 10.2 France
- 10.3 Italy
- 10.4 United Kingdom
- 10.5 Spain
- 10.6 Poland
- 10.7 Russia
- 10.8 Netherlands
- 10.9 Belgium
- 10.10 Sweden
- 10.11 Denmark
- 10.12 Norway
- 10.13 Rest of Europe
Chapter 11. Asia Pacific Digital Liquid Level Gauge Market
- 11.1 China
- 11.2 India
- 11.3 Japan
- 11.4 South Korea
- 11.5 Thailand
- 11.6 Indonesia
- 11.7 Vietnam
- 11.8 Malaysia
- 11.9 Australia
- 11.10 Rest of Asia Pacific
Chapter 12. Latin America Digital Liquid Level Gauge Market
- 12.1 Brazil
- 12.2 Argentina
- 12.3 Colombia
- 12.4 Chile
- 12.5 Rest of Latin America
Chapter 13. Middle East Digital Liquid Level Gauge Market
- 13.1 Saudi Arabia
- 13.2 United Arab Emirates
- 13.3 Turkey
- 13.4 Israel
- 13.5 Iran
- 13.6 Rest of the Middle East
Chapter 14. Africa Digital Liquid Level Gauge Market
- 14.1 South Africa
- 14.2 Egypt
- 14.3 Nigeria
- 14.4 Morocco
- 14.5 Rest of Africa
Chapter 15. Digital Liquid Level Gauge Company Profiles
- 15.1 [Company 01]
- 15.1.1 Company Overview
- 15.1.2 Key Management Personnel
- 15.1.3 Products & Services Portfolio
- 15.1.4 Financial Performance
- 15.1.5 Key Market Focus & Geographic Presence
- 15.1.6 Recent Developments & Strategic Initiatives
Note: The company profile list is preliminary and may change based on research findings, market developments, data availability, and client requirements.
Chapter 16. Appendices
- Appendix A – List of Abbreviations & Acronyms
- Appendix B – Industry Classification Code Reference – Full Series
- Appendix C – Production & Capacity Data Tables
- Appendix D – End-Use & Demand Base Tables
- Appendix E – Consumption & Replacement Rate Assumptions
- Appendix F – ASP Reference Tables
- Appendix G – Manufacturing & Facility Database
- Appendix H – Import-Export Data Tables
- Appendix I – Regulatory Summary Tables
- Appendix J – Primary Research Participant List (Anonymized)
- Appendix K – Primary Research Questionnaire Framework
- Appendix L – Data Sources & Bibliography
- Appendix M – Market Size Divergence & Source Comparison
Chapter 17. Research Methodology
- 17.1 Research Framework & Philosophy
- 17.2 Secondary Research – Sources, Hierarchy & Data Extraction
- 17.3 Data Modeling – Bottom-Up & Top-Down Market Sizing
- 17.4 Primary Research – Stakeholder Framework, LOI & Sample Sizes
- 17.5 Forecast Methodology – Regression, Scenario & Sensitivity Analysis
- 17.6 Quality Control – Four-Layer Validation Framework
- 17.7 Limitations & Standard Assumptions
- 17.8 Disclaimer
