
Market Overview
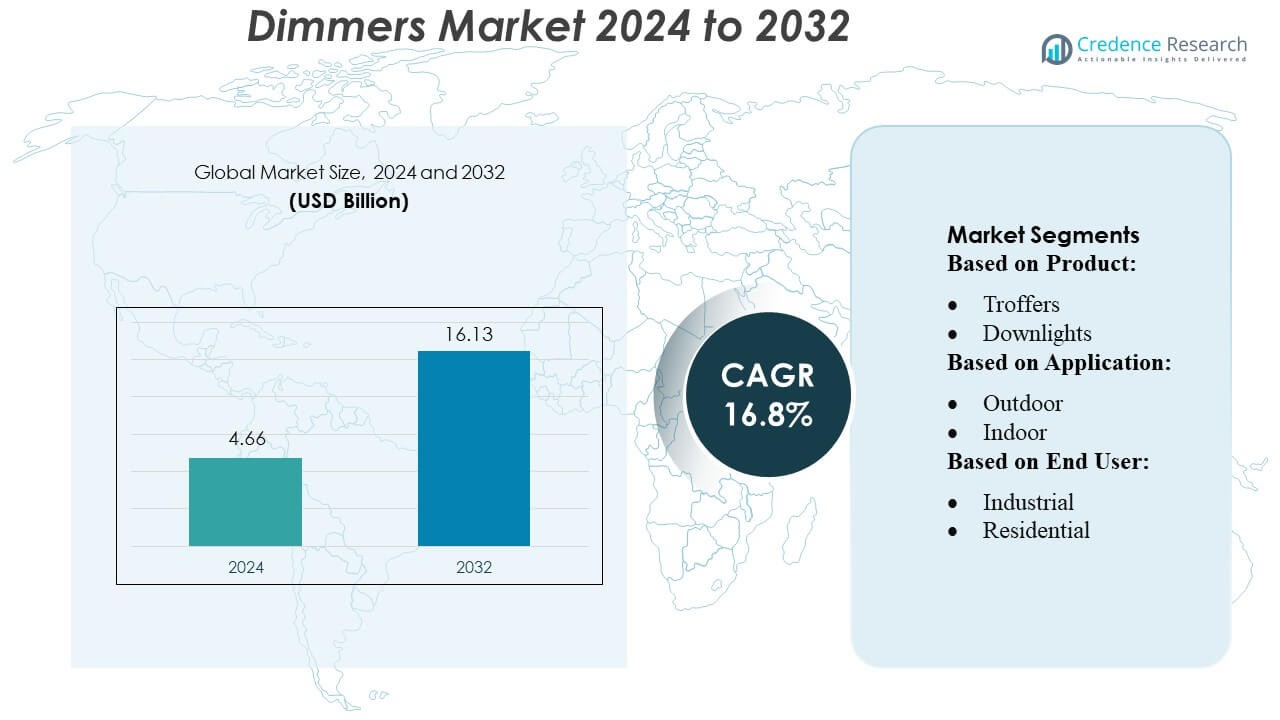
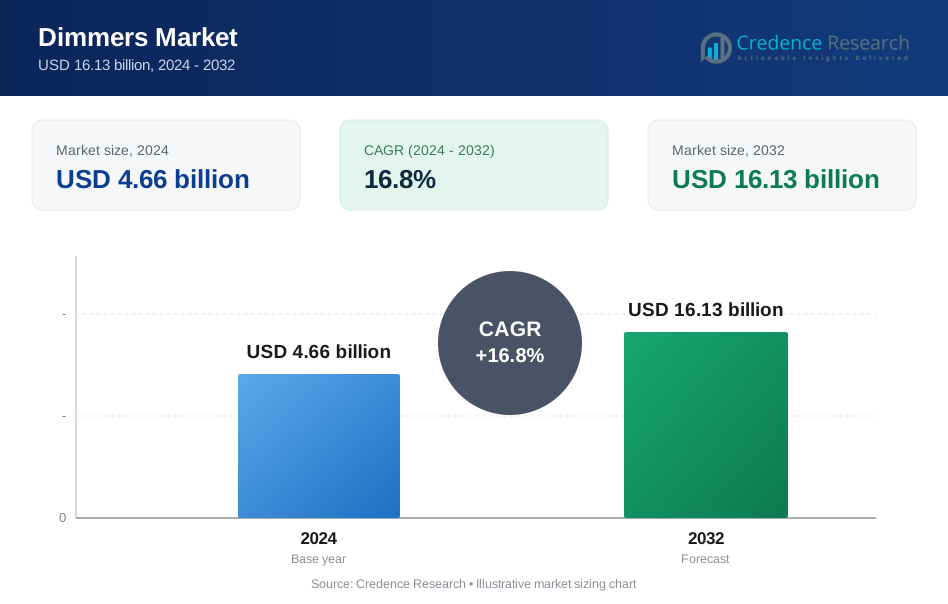
Dimmers Market size was valued USD 4.66 billion in 2024 and is anticipated to reach USD 16.13 billion by 2032, at a CAGR of 16.8% during the forecast period.
| REPORT ATTRIBUTE | DETAILS |
|---|---|
| Historical Period | 2020-2023 |
| Base Year | 2024 |
| Forecast Period | 2025-2032 |
| Dimmers Market Size 2024 | USD 4.66 Billion |
| Dimmers Market, CAGR | 16.8% |
| Dimmers Market Size 2032 | USD 16.13 Billion |
The dimmers market is highly competitive, with top players including Nanoleaf, Hubbell, SAVANT TECHNOLOGIES LLC, Halonix Technologies Private Limited, Cree Lighting USA LLC, Acuity Brands, Inc., Seoul Semiconductor Co., Ltd., LSI Industries Inc., Dialight, and Panasonic Corporation driving innovation and shaping industry trends. These companies focus on developing energy-efficient, smart, and IoT-enabled dimmers that cater to residential, commercial, and industrial applications. Strategic initiatives such as product launches, technological advancements, partnerships, and regional expansions strengthen their market presence and competitiveness. North America emerges as the leading region, holding approximately 42.5% of the global dimmers market, driven by high adoption of smart lighting systems, strong infrastructure, and growing demand for automated and sustainable lighting solutions. Continuous R&D investments and a focus on advanced, reliable, and user-friendly dimming technologies position these players to capitalize on evolving market trends and maintain a strong competitive edge.
Market Insights
- The dimmers market size was valued at USD 4.66 billion in 2024 and is expected to reach USD 16.13 billion by 2032, growing at a CAGR of 16.8% during the forecast period.
- Market growth is driven by increasing adoption of energy-efficient and smart lighting solutions across residential, commercial, and industrial sectors, along with rising demand for automated and sustainable lighting systems.
- Emerging trends include IoT-enabled, LED-compatible, and voice-controlled dimmers, as well as integration with smart home and building automation platforms.
- The market is highly competitive, led by companies focusing on technological innovation, strategic partnerships, product launches, and regional expansions to strengthen their presence and maintain an edge.
- North America is the leading region with approximately 42.5% market share, while Asia-Pacific and Europe show strong growth potential. Residential and commercial segments dominate the market, accounting for the majority of demand globally.
Market Segmentation Analysis:
By Product
In the Dimmer market, the luminaries segment dominates, capturing the largest market share due to rising adoption in commercial and residential lighting projects. Within luminaries, downlights hold a strong sub-segment position, favored for energy efficiency and seamless integration with smart lighting systems. Drivers include increasing demand for customizable lighting environments, advancements in LED-compatible dimmers, and growing retrofitting initiatives across urban infrastructure. Troffers and streetlights are gaining traction, especially in smart city projects, while lamps, particularly T-lamps and A-lamps, remain relevant for residential applications where flexibility and compatibility with existing fixtures are critical.
- For instance, Seoul Semiconductor’s series, such as part numbers within The SAWS1063A series has a specified minimum CRI of 97 or higher. The typical test current for these COB LEDs is 290 mA (0.29 A). At the 290 mA test current, the typical forward voltage is approximately 34.8 V.
By Application
Indoor applications lead the Dimmer market, reflecting widespread integration in homes, offices, and hospitality establishments. Within indoor applications, commercial spaces exhibit the highest adoption due to emphasis on energy savings, ambiance control, and smart building automation. Outdoor dimmer usage is expanding, driven by energy-efficient street lighting projects and smart urban infrastructure initiatives. Market growth is fueled by technological advances in wireless and IoT-enabled dimmers, rising consumer preference for energy-efficient solutions, and increasing government incentives promoting sustainable lighting systems in both public and private projects.
- For instance, Dialight has deployed over a million industrial LED fixtures globally. The Vigilant® High Output High Bay models offer a total output of up to 71,000 lumens and an efficiency of up to 155 lumens per watt. These are designed as efficient replacements for 1000W HID fixtures and other legacy lighting.
By End-User
The residential segment dominates the Dimmer market, accounting for the largest share, driven by growing consumer focus on home automation and smart lighting solutions. Within residential users, modern households with integrated smart homes lead adoption. Commercial end-users, including offices, retail spaces, and hospitality, are also significant, leveraging dimmers for energy efficiency and customizable lighting environments. Industrial applications remain smaller but are expanding due to factory modernization and energy management programs. Key drivers include rising consumer awareness of energy savings, government initiatives promoting efficient lighting, and technological innovations that enhance user experience and control.
Key Growth Drivers
- Rising Adoption of Energy-Efficient Lighting Solutions The demand for dimmers is driven by increasing adoption of energy-efficient lighting, particularly LED-based systems. Dimmer integration enables precise control over light intensity, reducing electricity consumption and lowering operational costs for residential, commercial, and industrial applications. Government incentives and regulations promoting sustainable energy usage further support market growth. Additionally, growing awareness among end-users about carbon footprint reduction and energy savings is encouraging retrofitting of existing lighting with dimmer-compatible systems, enhancing both environmental and financial benefits.
- For instance, Hubbell’s Protecta X LED luminaire is designed to be highly efficient, with claims of up to 50% energy savings compared to traditional fluorescent alternatives in typical industrial applications.
- Growing Smart Home and IoT Integration The surge in smart homes and IoT-enabled lighting systems is a significant growth driver for the dimmer market. Consumers increasingly prefer automated lighting controls accessible via smartphones, voice assistants, or remote interfaces. IoT-enabled dimmers offer convenience, customizable lighting scenes, and energy optimization, enhancing user experience. Commercial sectors are also adopting smart dimming solutions to reduce energy costs and improve ambiance control. The convergence of dimmers with connected technologies is expanding market opportunities by integrating lighting with broader home and building automation systems.
- For instance, Aculux 5° Precision Spot can concentrate light effectively to achieve a high center beam candlepower (CBCP) of 32,000 within an ultra-narrow 5-degree beam spread.
- Expansion of Commercial and Residential Construction Rapid urbanization and growth in residential and commercial construction are fueling demand for dimmers. Modern buildings increasingly prioritize customizable lighting solutions for energy efficiency, aesthetics, and comfort. In commercial spaces such as offices, hotels, and retail outlets, dimmers provide flexibility to adjust lighting according to activity or time of day. Residential projects are incorporating smart dimmers in new homes to enhance convenience and value. Rising construction investments and retrofitting initiatives in both emerging and developed regions are driving sustained demand for dimmer solutions globally.
Key Trends & Opportunities
- Integration with Wireless and Smart Technologies Wireless dimmers and smart lighting solutions are gaining traction, offering enhanced control without extensive rewiring. These technologies provide compatibility with mobile apps, voice assistants, and IoT networks, creating opportunities for manufacturers to offer value-added solutions. Commercial and residential users increasingly prefer systems that allow remote monitoring, scheduling, and energy optimization, creating room for innovation in wireless and networked dimmer designs.
- For instance, LSI’s AirLink Blue system uses a Bluetooth mesh network which has a maximum range of 100 feet between fixtures, ensuring reliable communication and scalability for large industrial applications.
- Adoption in Sustainable and Green Building Projects Sustainability trends are driving dimmer adoption in green buildings and LEED-certified projects. Dimmers allow precise control over energy usage and contribute to achieving energy efficiency ratings. Opportunities exist in retrofitting older buildings with energy-saving dimming systems, particularly in regions with strict environmental regulations. Companies focusing on eco-friendly dimmer solutions can capitalize on increasing awareness of sustainable construction practices.
- For instance, Panasonic's circular plastics project has successfully resulted in the ability to recycle 17,000 tons of plastic per year via cascade recycling (recycling into different products) and 8,000 tons of plastic per year via horizontal recycling.
- Expansion into Emerging Markets Emerging regions, including Asia-Pacific and Latin America, are witnessing rapid urbanization and smart city initiatives, presenting growth opportunities for the dimmer market. Rising disposable incomes, increased infrastructure spending, and modernization of residential and commercial buildings drive demand. Manufacturers can leverage these markets by offering cost-effective and technologically advanced dimmers suited for both urban and semi-urban projects.
Key Challenges
- High Initial Investment Costs The high upfront cost of dimmer systems, particularly smart and IoT-enabled solutions, limits adoption among cost-sensitive residential and small commercial users. Installation, integration with existing lighting, and compatibility with LED systems may require additional investment, delaying deployment. Companies must develop cost-effective solutions or financing models to address this barrier and broaden market penetration.
- Compatibility and Technical Limitations Dimmers often face compatibility challenges with various lamp types, particularly LEDs, CFLs, and older lighting systems. Flickering, reduced lifespan, or performance issues may occur if dimmers are not properly matched. Technical complexities in integrating dimmers with smart systems and ensuring seamless operation across multiple devices pose challenges for manufacturers and end-users. Standardization and advanced testing are essential to overcome these issues and ensure reliable performance.
Regional Analysis
North America
North America dominates the global dimmers market, accounting for approximately 42.5% share in 2024. The region’s leadership is driven by widespread adoption of smart lighting systems, energy-efficient technologies, and home automation solutions. Increasing consumer awareness of energy savings and government incentives for sustainable building practices have further fueled market growth. Both residential and commercial sectors are embracing advanced dimmers compatible with LED, IoT, and smart-home ecosystems. Major markets in the U.S. and Canada show strong demand for technologically advanced products, including touch-sensitive and voice-controlled dimmers, reinforcing the region’s position as the largest and most technologically mature dimmers market globally.
Europe
Europe holds an estimated 28–30% of the global dimmers market. Growth is supported by strict energy-efficiency regulations, increasing adoption of smart building solutions, and rising demand for environmentally sustainable lighting systems. Germany, France, and the UK are key contributors, where both residential and commercial segments are increasingly integrating automated and energy-efficient dimmers. The focus on reducing carbon footprints, coupled with incentives for energy-efficient retrofits, is driving adoption across new constructions and renovation projects. Technological innovation, such as DALI-compatible dimmers and IoT-enabled systems, is widely embraced, positioning Europe as a significant and technologically advanced market for dimmers globally.
Asia-Pacific
The Asia-Pacific region represents approximately 25–31.5% of the global dimmers market. Rapid urbanization, growing disposable incomes, and increasing smart-home adoption in countries such as China, India, Japan, and South Korea are major growth drivers. Rising infrastructure development, commercial construction, and awareness of energy-efficient lighting solutions further support market expansion. Both residential and commercial sectors are increasingly adopting LED-compatible, IoT-enabled, and voice-controlled dimmers. Asia-Pacific is considered one of the fastest-growing regions globally, with increasing government support for sustainable energy practices and smart-city initiatives, positioning it as a critical growth market with substantial long-term potential.
Latin America
Latin America accounts for roughly 4.8% of the global dimmers market. Growth in the region is moderate but steady, driven by urbanization, rising middle-class populations, and gradual adoption of energy-efficient and smart lighting solutions. Brazil and Mexico are the primary contributors, with increasing demand across residential and commercial projects. Market penetration is supported by infrastructure development, smart-building initiatives, and growing awareness of energy conservation. However, economic challenges and inconsistent adoption of advanced technologies across smaller markets may limit growth. Despite this, the market shows promising opportunities for manufacturers focusing on cost-effective, reliable, and energy-efficient dimmer solutions in the region.
Middle East & Africa
The Middle East and Africa represent approximately 3–3.2% of the global dimmers market. Market growth is driven by rising investments in infrastructure, urban development, and smart-city projects, particularly in the UAE, Saudi Arabia, and South Africa. Adoption of energy-efficient lighting solutions in both residential and commercial sectors is increasing, supported by regulatory initiatives and government incentives. However, market penetration is relatively lower than other regions due to uneven regulations, varying economic conditions, and differences in technological adoption. Despite these challenges, demand for innovative, energy-saving, and IoT-compatible dimmers is expected to grow steadily as the region modernizes its lighting infrastructure.
Market Segmentations:
By Product:
- Troffers
- Downlights
By Application:
- Outdoor
- Indoor
By End User:
- Industrial
- Residential
By Geography
- North America
- U.S.
- Canada
- Mexico
- Europe
- Germany
- France
- U.K.
- Italy
- Spain
- Rest of Europe
- Asia Pacific
- China
- Japan
- India
- South Korea
- South-east Asia
- Rest of Asia Pacific
- Latin America
- Brazil
- Argentina
- Rest of Latin America
- Middle East & Africa
- GCC Countries
- South Africa
- Rest of the Middle East and Africa
Competitive Landscape
The dimmers market is highly competitive, with major players including Nanoleaf, Hubbell, SAVANT TECHNOLOGIES LLC, Halonix Technologies Private Limited, Cree Lighting USA LLC, Acuity Brands, Inc., Seoul Semiconductor Co., Ltd., LSI Industries Inc., Dialight. The dimmers market is highly competitive, driven by rapid technological advancements and growing demand for energy-efficient and smart lighting solutions. Companies focus on developing LED-compatible, IoT-enabled, and app-integrated dimmers to cater to residential, commercial, and industrial segments. Innovation in voice-controlled, automated, and sustainable lighting solutions is a key differentiator, while strategic initiatives such as mergers, partnerships, and regional expansions help strengthen market presence. R&D investments target improved energy savings, enhanced reliability, and superior user experience. Additionally, compliance with regional regulations and standards, along with evolving consumer preferences for smart home and commercial automation, intensifies competition. Overall, success in this market depends on the ability to offer innovative, cost-effective, and technologically advanced dimming solutions while adapting quickly to emerging trends and shifting market dynamics.
Key Player Analysis
- Nanoleaf
- Hubbell
- SAVANT TECHNOLOGIES LLC
- Halonix Technologies Private Limited
- Cree Lighting USA LLC
- Acuity Brands, Inc.
- Seoul Semiconductor Co., Ltd.
- LSI Industries Inc.
- Dialight
- Panasonic Corporation
Recent Developments
- In July 2025, Access Fixtures launched a new online calculator and guide to help professionals calculate LED light amperage, which aims to ensure project safety and prevent errors. The user-friendly tool provides a way for electricians, contractors, and project managers to accurately determine the amp draw of LED lights, according to Access Fixtures' news.
- In April 2025, VueReal announced a significant expansion of its Reference Design Kit (RDK) portfolio with new industry-specific bundles. Purpose-built for automotive and consumer electronics, the vertical RDKs are designed to fast-track microLED product development and commercialization with unprecedented speed and integration readiness.
- In March 2025, Signify Holding announced a joint venture with Dixon Technologies (India) Ltd., subject to regulatory approvals. This partnership aims to manufacture high-quality lighting products and accessories for prominent brands in the competitive Indian market.
- In February 2025, Cree LED, a brand of Penguin Solutions, launched the new XLamp XP-L Photo Red S Line LEDs, which offer improved efficiency and durability for horticulture applications like greenhouses and vertical farms. The new LEDs achieve up to a 35% reduction in the number of required LEDs by increasing efficiency by 6% over the previous generation and include enhanced durability features like sulfur and corrosion resistance to ensure a longer lifespan in harsh environments.
Report Coverage
The research report offers an in-depth analysis based on Product, Application, End-User and Geography. It details leading market players, providing an overview of their business, product offerings, investments, revenue streams, and key applications. Additionally, the report includes insights into the competitive environment, SWOT analysis, current market trends, as well as the primary drivers and constraints. Furthermore, it discusses various factors that have driven market expansion in recent years. The report also explores market dynamics, regulatory scenarios, and technological advancements that are shaping the industry. It assesses the impact of external factors and global economic changes on market growth. Lastly, it provides strategic recommendations for new entrants and established companies to navigate the complexities of the market.
Future Outlook
- Demand for smart and IoT-enabled dimmers will continue to grow across residential and commercial sectors.
- Adoption of energy-efficient and LED-compatible dimmers will rise due to environmental regulations and sustainability goals.
- Integration of voice control and mobile app functionalities will become a standard feature in next-generation dimmers.
- Rapid urbanization and smart city initiatives will drive regional market expansion, particularly in Asia-Pacific and North America.
- Technological innovations such as automated and adaptive lighting systems will enhance user experience and energy savings.
- Manufacturers will increasingly focus on developing cost-effective solutions to capture emerging markets.
- Mergers, acquisitions, and strategic partnerships will strengthen market presence and innovation capabilities.
- Growing awareness of energy conservation and green building certifications will boost dimmer adoption.
- Expansion in commercial, hospitality, and industrial applications will support sustained market growth.
- Continuous R&D investments will lead to improved reliability, durability, and multifunctional dimming solutions.
Request a Free Sample
Fill in your details and we'll send you a free sample report.
- Sample data tables & charts
- Research methodology
Need a Custom Version of This Report?
Tailor the scope, geography, or segments to your exact requirements.
- Custom geography or segment scope
- Direct access to our analyst team
Frequently Asked Questions
What is the current market size for Dimmers Market, and what is its projected size in 2032?
At what Compound Annual Growth Rate is the Dimmers Market projected to grow between 2025 and 2032?
Which Dimmers Market segment held the largest share in 2024?
What are the primary factors fueling the growth of the Dimmers Market?
Who are the leading companies in the Dimmers Market?
Which region commanded the largest share of the Dimmers Market in 2024?
Table of Content
Chapter 1. Report Introduction
- 1.1 Report Description & Purpose
- 1.1.1 Report Title & Market Definition
- 1.1.2 Unique Selling Propositions (USP) & Key Differentiators
- 1.1.3 Value Proposition for Stakeholders
- 1.2 Research Objectives
- 1.2.1 Market Sizing Objectives (Volume & Revenue)
- 1.2.2 Segmentation Objectives
- 1.2.3 Competitive Intelligence Objectives
- 1.2.4 Forecast & Scenario Objectives
- 1.3 Report Scope
- 1.3.1 Dimmers Scope – Types & Subtypes Covered
- 1.3.2 Geographic Scope – Regions & Countries Covered
- 1.3.3 Historical Period, Base Year & Forecast Period (2024; forecast to 2032)
- 1.3.4 Inclusions & Exclusions
- 1.4 HS Code & Classification Framework
- 1.5 Currency, Units & Pricing Basis
- 1.6 Target Stakeholders
- 1.7 Limitations & Assumptions
Chapter 2. Executive Summary
- 2.1 Global Dimmers Market Snapshot
- 2.1.1 Market Size – Historical (2024) & Forecast (2024-2032) (2024: USD 4.66 billion → 2032: USD 16.13 billion)
- 2.1.2 Volume & Revenue – Global Totals
- 2.1.3 Key Market Highlights – Top Five Facts
- 2.2 Dimmers Market Segmentation Snapshot
- 2.2.1 Market Split by Region – 2024 vs. 2032
- 2.3 Competitive Snapshot
- 2.3.1 Top 10 Players by Revenue Share – 2024
- 2.3.2 Top 10 Players by Volume Share – 2024
- 2.3.3 Recent Strategic Developments (18-Month Summary)
- 2.4 Key Investment Highlights & Strategic Conclusions
Chapter 3. Dimmers Market Dynamics & Industry Analysis
- 3.1 Market Overview & Context
- 3.1.1 Dimmers Market Position in the Broader Automotive Value Chain
- 3.1.2 OEM vs. Replacement Market Dynamics
- 3.1.3 Market Maturity & Development Stage by Region
- 3.2 Dimmers Market Drivers
- 3.3 Dimmers Market Restraints & Challenges
- 3.4 Dimmers Market Opportunities
- 3.5 Porter's Five Forces Analysis
- 3.5.1 Threat of New Entrants
- 3.5.2 Bargaining Power of Suppliers
- 3.5.3 Bargaining Power of Buyers
- 3.5.4 Threat of Substitutes
- 3.5.5 Competitive Rivalry – Intensity Assessment
- 3.6 Dimmers Value Chain Analysis
- 3.6.1 Upstream – Raw Material/Input Suppliers
- 3.6.1.1 Raw Material/Input 1
- 3.6.1.2 Raw Material/Input 2
- 3.6.1.3 Raw Material/Input 3
- 3.6.2 Midstream – Production/Manufacturing/Service Delivery
- 3.6.2.1 Production/Process Overview
- 3.6.2.2 Key Facility Locations & Capacity by Manufacturer
- 3.6.3 Downstream – Distribution & End Consumer
- 3.6.3.1 Primary Channel – B2B/OEM
- 3.6.3.2 Secondary Channels – Dealer, Retail, Online, Direct
- 3.6.4 Value Chain Profitability Analysis
- 3.6.1 Upstream – Raw Material/Input Suppliers
- 3.7 PESTEL Analysis
- 3.7.1 Political Factors
- 3.7.2 Economic Factors
- 3.7.3 Social Factors
- 3.7.4 Technological Factors
- 3.7.5 Environmental Factors
- 3.7.6 Legal Factors
- 3.8 Dimmers Supply Chain Analysis
- 3.8.1 Raw Material/Input Supply Risk Assessment
- 3.8.2 Manufacturing Concentration Risk (Geographic Exposure)
- 3.8.3 Trade Disruption Impact Analysis
- 3.9 Regulatory & Policy Landscape
Note: The regulatory and policy landscape section covers regulations based on their applicability to the market, Dimmers category, geography, and scope of the study. Only regulatory frameworks with a material impact on operations, compliance, trade, sustainability, or market access are analyzed in detail.
Chapter 4. Key Investment Pockets & Opportunity Analysis
- 4.1 Dimmers Market Attractiveness Analysis
- 4.1.1 By Region – Investment Attractiveness Matrix (Volume × CAGR)
- 4.2 Absolute Revenue Growth Opportunity
- 4.2.1 By Region – Absolute USD Growth Through 2032
- 4.3 Incremental Volume Opportunity
- 4.3.1 By Region – Incremental Volume Through 2032
- 4.3.2 Segment – Incremental Volume
- 4.4 Emerging Submarket Opportunity Deep Dive (Subject to Applicability)
- 4.5 Emerging Market Opportunity Scorecards
- 4.5.1 United States
- 4.5.2 Europe
- 4.5.3 Asia
- 4.5.4 Middle East & Africa
Note: Emerging Market Opportunity Scorecards will be included based on relevance and strategic importance. Regions listed are indicative and may vary depending on data availability and market dynamics.
Chapter 5. Dimmers Import-Export Analysis & Trade Flows
- 5.1 Global Trade Overview
- 5.1.1 Global Export Value by Country (2024)
- 5.1.2 Global Export Volume by Country (2024)
- 5.1.3 Global Import Value by Country (2024)
- 5.1.4 Global Import Volume by Country (2024)
- 5.1.5 Net Trade Balance by Country (2024)
- 5.2 Export Analysis – Segment
- 5.2.1 Type 1 (HS Code)
- 5.2.2 Type 2 (HS Code)
- 5.2.3 Type 3 (HS Code)
- 5.2.4 Type 4 (HS Code)
- 5.2.5 Type 5 (HS Code)
- 5.3 Import Analysis – Segment
- 5.3.1 Type 1 (HS Code)
- 5.3.2 Type 2 (HS Code)
- 5.3.3 Type 3 (HS Code)
- 5.3.4 Type 4 (HS Code)
- 5.3.5 Type 5 (HS Code)
- 5.4 Average Unit Trade Prices
- 5.4.1 Average Export Price – Segment & Country
- 5.4.2 Average Import Price – Segment & Source Country
- 5.4.3 Price Trends (2024)
- 5.5 Key Trade Route Analysis
- 5.5.1 Trade Route 1
- 5.5.2 Trade Route 2
- 5.5.3 Trade Route 3
- 5.5.4 Trade Route 4
- 5.5.5 Trade Route 5
- 5.6 Trade Policy Impact Assessment
- 5.6.1 US Anti-Dumping & Section 301 Tariffs
- 5.6.2 EU Customs Union Impact
- 5.6.3 Major Free Trade Agreements
- 5.6.4 USMCA Rules of Origin
Note: Trade policy analysis will be included only where relevant to the Dimmers market.
Chapter 6. Competitive Landscape & Company Benchmarking
- 6.1 Dimmers Market Concentration & Structure
- 6.1.1 Herfindahl-Hirschman Index (HHI) – vs. 2024
- 6.1.2 Tier 1, Tier 2 & Tier 3 Market Structure
- 6.1.3 Global, Regional & Local Player Dynamics
- 6.2 Dimmers Market Share Analysis – 2024
- 6.2.1 Global Revenue Share by Company
- 6.2.2 Global Volume Share by Company
- 6.2.3 Regional Revenue Share
- 6.2.4 Market Share Evolution ( vs. 2024)
- 6.2.5 OEM Segment Share by Company
- 6.2.6 Replacement Segment Share by Company
- 6.3 Production/Delivery Capacity & Facility Analysis
- 6.3.1 Global Installed Capacity
- 6.3.2 Capacity Utilization Rates
- 6.3.3 Production/Output Volume
- 6.3.4 Facility Locations & Capacity Map
- 6.3.5 Planned Capacity Additions
- 6.4 Dimmers Competitive Benchmarking Matrix
- 6.4.1 Revenue, Volume, CAGR & Profitability Comparison
- 6.4.2 Channel Revenue Mix
- 6.4.3 Geographic Revenue Exposure
- 6.4.4 R&D Intensity
- 6.4.5 Sustainability Maturity
- 6.5 Strategic Developments in Dimmers (Last 24 Months)
- 6.5.1 Mergers, Acquisitions & Divestments
- 6.5.2 New Dimmers Launches
- 6.5.3 Facility Expansions
- 6.5.4 Strategic Alliances, Joint Ventures & Partnerships
- 6.5.5 Distribution Expansion & Market Entry
- 6.5.6 Sustainability & ESG Initiatives
- 6.6 Competitive Strategy Mapping
- 6.6.1 Leader, Challenger, Follower & Niche Classification
- 6.6.2 Pricing Strategy Comparison
- 6.6.3 Channel Strategy Matrix
Note: Strategic developments are included based on their materiality and the availability of reliable information.
Chapter 7. Global Dimmers Market – By Distribution Channel
- 7.1 Segment Overview
- 7.1.1 Volume & Revenue Split by Channel (2024 & 2032)
- 7.1.2 Channel Mix Evolution (2024-2032)
Chapter 8. Regional Market Analysis – Global Overview
- 8.1 Global Regional Overview
- 8.1.1 Regional Volume Share
- 8.1.2 Regional Revenue Share
- 8.1.3 Regional Volume by Region
- 8.1.4 Regional Revenue by Region
- 8.1.5 Regional Forecast Through 2032
- 8.2 Cross-Regional Segment Analysis
- 8.2.1 By Distribution Channel
- 8.2.2 By Brand/Price Tier
Chapter 9. North America Dimmers Market
- 9.1 United States
- 9.2 Canada
- 9.3 Mexico
Chapter 10. Europe Dimmers Market
- 10.1 Germany
- 10.2 France
- 10.3 Italy
- 10.4 United Kingdom
- 10.5 Spain
- 10.6 Poland
- 10.7 Russia
- 10.8 Netherlands
- 10.9 Belgium
- 10.10 Sweden
- 10.11 Denmark
- 10.12 Norway
- 10.13 Rest of Europe
Chapter 11. Asia Pacific Dimmers Market
- 11.1 China
- 11.2 India
- 11.3 Japan
- 11.4 South Korea
- 11.5 Thailand
- 11.6 Indonesia
- 11.7 Vietnam
- 11.8 Malaysia
- 11.9 Australia
- 11.10 Rest of Asia Pacific
Chapter 12. Latin America Dimmers Market
- 12.1 Brazil
- 12.2 Argentina
- 12.3 Colombia
- 12.4 Chile
- 12.5 Rest of Latin America
Chapter 13. Middle East Dimmers Market
- 13.1 Saudi Arabia
- 13.2 United Arab Emirates
- 13.3 Turkey
- 13.4 Israel
- 13.5 Iran
- 13.6 Rest of the Middle East
Chapter 14. Africa Dimmers Market
- 14.1 South Africa
- 14.2 Egypt
- 14.3 Nigeria
- 14.4 Morocco
- 14.5 Rest of Africa
Chapter 15. Dimmers Company Profiles
- 15.1 [Company 01]
- 15.1.1 Company Overview
- 15.1.2 Key Management Personnel
- 15.1.3 Products & Services Portfolio
- 15.1.4 Financial Performance
- 15.1.5 Key Market Focus & Geographic Presence
- 15.1.6 Recent Developments & Strategic Initiatives
Note: The company profile list is preliminary and may change based on research findings, market developments, data availability, and client requirements.
Chapter 16. Appendices
- Appendix A – List of Abbreviations & Acronyms
- Appendix B – Industry Classification Code Reference – Full Series
- Appendix C – Production & Capacity Data Tables
- Appendix D – End-Use & Demand Base Tables
- Appendix E – Consumption & Replacement Rate Assumptions
- Appendix F – ASP Reference Tables
- Appendix G – Manufacturing & Facility Database
- Appendix H – Import-Export Data Tables
- Appendix I – Regulatory Summary Tables
- Appendix J – Primary Research Participant List (Anonymized)
- Appendix K – Primary Research Questionnaire Framework
- Appendix L – Data Sources & Bibliography
- Appendix M – Market Size Divergence & Source Comparison
Chapter 17. Research Methodology
- 17.1 Research Framework & Philosophy
- 17.2 Secondary Research – Sources, Hierarchy & Data Extraction
- 17.3 Data Modeling – Bottom-Up & Top-Down Market Sizing
- 17.4 Primary Research – Stakeholder Framework, LOI & Sample Sizes
- 17.5 Forecast Methodology – Regression, Scenario & Sensitivity Analysis
- 17.6 Quality Control – Four-Layer Validation Framework
- 17.7 Limitations & Standard Assumptions
- 17.8 Disclaimer
