Table of Content
CHAPTER NO. 1 : INTRODUCTION 31
1.1.1. Report Description 31
Purpose of the Report 31
USP & Key Offerings 31
1.1.2. Key Benefits for Stakeholders 31
1.1.3. Target Audience 32
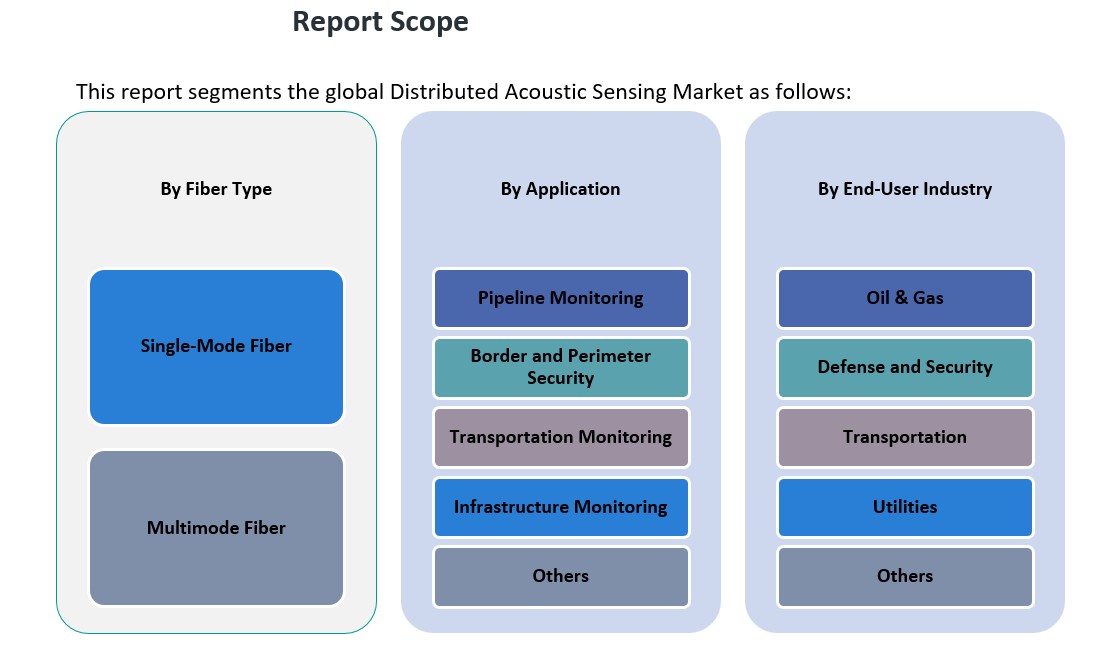
1.1.4. Report Scope 32
1.1.5. Regional Scope 33
CHAPTER NO. 2 : EXECUTIVE SUMMARY 34
2.1. Distributed Acoustic Sensing Market Snapshot 34
2.1.1. Global Distributed Acoustic Sensing Market, 2018 – 2032 (USD Million) 35
CHAPTER NO. 3 : GEOPOLITICAL CRISIS IMPACT ANALYSIS 36
3.1. Russia-Ukraine and Israel-Palestine War Impacts 36
CHAPTER NO. 4 : DISTRIBUTED ACOUSTIC SENSING MARKET – INDUSTRY ANALYSIS 37
4.1. Introduction 37
4.2. Market Drivers 38
4.2.1. Increasing demand for advanced monitoring solutions in the oil and gas sector 38
4.2.2. Rising focus on perimeter and infrastructure security across industries 39
4.3. Market Restraints 40
4.3.1. High initial deployment and maintenance costs 40
4.4. Market Opportunities 41
4.4.1. Growing adoption of smart infrastructure and smart city initiatives 41
4.5. Porter’s Five Forces Analysis 42
4.6. Value Chain Analysis 43
4.7. Buying Criteria 44
CHAPTER NO. 5 : IMPORT EXPORT ANALYSIS 45
5.1. Import Analysis by Region 45
5.1.1. Global Distributed Acoustic Sensing Market Import Volume/Revenue, By Region, 2018 – 2023 45
5.2. Export Analysis by Region 46
5.2.1. Global Distributed Acoustic Sensing Market Export Volume/Revenue, By Region, 2018 – 2023 46
CHAPTER NO. 6 : DEMAND SUPPLY ANALYSIS 47
6.1. Demand Analysis by Region 47
6.1.1. Global Distributed Acoustic Sensing Market Demand Volume/Revenue, By Region, 2018 – 2023 47
6.2. Supply Analysis by Region 48
6.2.1. Global Distributed Acoustic Sensing Market Supply Volume/Revenue, By Region, 2018 – 2023 48
CHAPTER NO. 7 : PRODUCTION ANALYSIS 49
7.1. Production Analysis by Region 49
7.1.1. Global Distributed Acoustic Sensing Market Production Volume/Revenue, By Region, 2018 – 2023 49
CHAPTER NO. 8 : PRICE ANALYSIS 50
8.1. Price Analysis by Region 50
8.1.1. Global Distributed Acoustic Sensing Market Price, By Region, 2018 – 2023 50
8.1.2. Global Fiber Type Market Price, By Region, 2018 – 2023 50
8.2. Price Analysis by Fiber Type 51
8.2.1. Global Distributed Acoustic Sensing Market Price, By Fiber Type, 2018 – 2023 51
8.2.2. Global Fiber Type Market Price, By Fiber Type, 2018 – 2023 51
CHAPTER NO. 9 : RAW MATERIALS ANALYSIS 52
9.1. Key Raw Materials and Suppliers 52
9.2. Key Raw Materials Price Trend 52
CHAPTER NO. 10 : MANUFACTURING COST ANALYSIS 53
10.1. Manufacturing Cost Analysis 53
10.2. Manufacturing Process 53
CHAPTER NO. 11 : ANALYSIS COMPETITIVE LANDSCAPE 54
11.1. Company Market Share Analysis – 2023 54
11.1.1. Global Distributed Acoustic Sensing Market: Company Market Share, by Volume, 2023 54
11.1.2. Global Distributed Acoustic Sensing Market: Company Market Share, by Revenue, 2023 55
11.1.3. Global Distributed Acoustic Sensing Market: Top 6 Company Market Share, by Revenue, 2023 55
11.1.4. Global Distributed Acoustic Sensing Market: Top 3 Company Market Share, by Revenue, 2023 56
11.2. Global Distributed Acoustic Sensing Market Company Volume Market Share, 2023 57
11.3. Global Distributed Acoustic Sensing Market Company Revenue Market Share, 2023 58
11.4. Company Assessment Metrics, 2023 58
11.4.1. Stars 58
11.4.2. Emerging Leaders 58
11.4.3. Pervasive Players 58
11.4.4. Participants 58
11.5. Start-ups /SMEs Assessment Metrics, 2023 58
11.5.1. Progressive Companies 58
11.5.2. Responsive Companies 59
11.5.3. Dynamic Companies 59
11.5.4. Starting Blocks 59
11.6. Strategic Developments 60
11.6.1. Acquisitions & Mergers 60
New Product Launch 60
Regional Expansion 60
11.7. Key Players Product Matrix 61
CHAPTER NO. 12 : PESTEL & ADJACENT MARKET ANALYSIS 62
12.1. PESTEL 62
12.1.1. Political Factors 62
12.1.2. Economic Factors 62
12.1.3. Social Factors 62
12.1.4. Technological Factors 62
12.1.5. Environmental Factors 62
12.1.6. Legal Factors 62
12.2. Adjacent Market Analysis 62
CHAPTER NO. 13 : DISTRIBUTED ACOUSTIC SENSING MARKET – BY FIBER TYPE SEGMENT ANALYSIS 63
13.1. Distributed Acoustic Sensing Market Overview, by Fiber Type Segment 63
13.1.1. Distributed Acoustic Sensing Market Revenue Share, By Fiber Type, 2023 & 2032 64
13.1.2. Distributed Acoustic Sensing Market Attractiveness Analysis, By Fiber Type 65
13.1.3. Incremental Revenue Growth Opportunity, by Fiber Type, 2024 – 2032 65
13.1.4. Distributed Acoustic Sensing Market Revenue, By Fiber Type, 2018, 2023, 2027 & 2032 66
13.2. Single-Mode Fiber 67
13.2.1. Global Single-Mode Fiber Distributed Acoustic Sensing Market Revenue, By Region, 2018 – 2023 (USD Million) 68
13.2.2. Global Single-Mode Fiber Distributed Acoustic Sensing Market Revenue, By Region, 2024 – 2032 (USD Million) 68
13.3. Multimode Fiber 69
13.3.1. Global Multimode Fiber Distributed Acoustic Sensing Market Revenue, By Region, 2018 – 2023 (USD Million) 70
13.3.2. Global Multimode Fiber Distributed Acoustic Sensing Market Revenue, By Region, 2024 – 2032 (USD Million) 70
CHAPTER NO. 14 : DISTRIBUTED ACOUSTIC SENSING MARKET – BY APPLICATION SEGMENT ANALYSIS 71
14.1. Distributed Acoustic Sensing Market Overview, by Application Segment 71
14.1.1. Distributed Acoustic Sensing Market Revenue Share, By Application, 2023 & 2032 72
14.1.2. Distributed Acoustic Sensing Market Attractiveness Analysis, By Application 73
14.1.3. Incremental Revenue Growth Opportunity, by Application, 2024 – 2032 73
14.1.4. Distributed Acoustic Sensing Market Revenue, By Application, 2018, 2023, 2027 & 2032 74
14.2. Pipeline Monitoring 75
14.2.1. Global Pipeline Monitoring Distributed Acoustic Sensing Market Revenue, By Region, 2018 – 2023 (USD Million) 76
14.2.2. Global Pipeline Monitoring Distributed Acoustic Sensing Market Revenue, By Region, 2024 – 2032 (USD Million) 76
14.3. Transportation Monitoring 77
14.3.1. Global Transportation Monitoring Distributed Acoustic Sensing Market Revenue, By Region, 2018 – 2023 (USD Million) 78
14.3.2. Global Transportation Monitoring Distributed Acoustic Sensing Market Revenue, By Region, 2024 – 2032 (USD Million) 78
14.4. Border and Perimeter Security 79
14.4.1. Global Border and Perimeter Security Distributed Acoustic Sensing Market Revenue, By Region, 2018 – 2023 (USD Million) 80
14.4.2. Global Border and Perimeter Security Distributed Acoustic Sensing Market Revenue, By Region, 2024 – 2032 (USD Million) 80
14.5. Infrastructure Monitoring 81
14.5.1. Global Infrastructure Monitoring Distributed Acoustic Sensing Market Revenue, By Region, 2018 – 2023 (USD Million) 82
14.5.2. Global Infrastructure Monitoring Distributed Acoustic Sensing Market Revenue, By Region, 2024 – 2032 (USD Million) 82
14.6. Others 83
14.6.1. Global Others Distributed Acoustic Sensing Market Revenue, By Region, 2018 – 2023 (USD Million) 84
14.6.2. Global Others Distributed Acoustic Sensing Market Revenue, By Region, 2024 – 2032 (USD Million) 84
CHAPTER NO. 15 : DISTRIBUTED ACOUSTIC SENSING MARKET – BY END-USER INDUSTRY SEGMENT ANALYSIS 85
15.1. Distributed Acoustic Sensing Market Overview, by End-User Industry Segment 85
15.1.1. Distributed Acoustic Sensing Market Revenue Share, By End-User Industry, 2023 & 2032 86
15.1.2. Distributed Acoustic Sensing Market Attractiveness Analysis, By End-User Industry 87
15.1.3. Incremental Revenue Growth Opportunity, by End-User Industry, 2024 – 2032 87
15.1.4. Distributed Acoustic Sensing Market Revenue, By End-User Industry, 2018, 2023, 2027 & 2032 88
15.2. Oil & Gas 89
15.2.1. Global Oil & Gas Distributed Acoustic Sensing Market Revenue, By Region, 2018 – 2023 (USD Million) 90
15.2.2. Global Oil & Gas Distributed Acoustic Sensing Market Revenue, By Region, 2024 – 2032 (USD Million) 90
15.3. Defense and Security 91
15.3.1. Global Defense and Security Distributed Acoustic Sensing Market Revenue, By Region, 2018 – 2023 (USD Million) 92
15.3.2. Global Defense and Security Distributed Acoustic Sensing Market Revenue, By Region, 2024 – 2032 (USD Million) 92
15.4. Transportation 93
15.4.1. Global Transportation Distributed Acoustic Sensing Market Revenue, By Region, 2018 – 2023 (USD Million) 94
15.4.2. Global Transportation Distributed Acoustic Sensing Market Revenue, By Region, 2024 – 2032 (USD Million) 94
15.5. Utilities 95
15.5.1. Global Utilities Distributed Acoustic Sensing Market Revenue, By Region, 2018 – 2023 (USD Million) 96
15.5.2. Global Utilities Distributed Acoustic Sensing Market Revenue, By Region, 2024 – 2032 (USD Million) 96
15.6. Others 97
15.6.1. Global Others Distributed Acoustic Sensing Market Revenue, By Region, 2018 – 2023 (USD Million) 98
15.6.2. Global Others Distributed Acoustic Sensing Market Revenue, By Region, 2024 – 2032 (USD Million) 98
CHAPTER NO. 16 : DISTRIBUTED ACOUSTIC SENSING MARKET – REGIONAL ANALYSIS 99
16.1. Distributed Acoustic Sensing Market Overview, by Regional Segments 99
16.2. Region 100
16.2.1. Global Distributed Acoustic Sensing Market Revenue Share, By Region, 2023 & 2032 100
16.2.2. Distributed Acoustic Sensing Market Attractiveness Analysis, By Region 101
16.2.3. Incremental Revenue Growth Opportunity, by Region, 2024 – 2032 101
16.2.4. Distributed Acoustic Sensing Market Revenue, By Region, 2018, 2023, 2027 & 2032 102
16.2.5. Global Distributed Acoustic Sensing Market Revenue, By Region, 2018 – 2023 (USD Million) 103
16.2.6. Global Distributed Acoustic Sensing Market Revenue, By Region, 2024 – 2032 (USD Million) 103
16.3. Fiber Type 104
16.3.1. Global Distributed Acoustic Sensing Market Revenue, By Fiber Type, 2018 – 2023 (USD Million) 104
16.4. Global Distributed Acoustic Sensing Market Revenue, By Fiber Type, 2024 – 2032 (USD Million) 104
16.5. Application 105
16.5.1. Global Distributed Acoustic Sensing Market Revenue, By Application, 2018 – 2023 (USD Million) 105
16.5.2. Global Distributed Acoustic Sensing Market Revenue, By Application, 2024 – 2032 (USD Million) 105
16.6. End-User Industry 106
16.6.1. Global Distributed Acoustic Sensing Market Revenue, By End-User Industry, 2018 – 2023 (USD Million) 106
16.6.2. Global Distributed Acoustic Sensing Market Revenue, By End-User Industry, 2024 – 2032 (USD Million) 106
CHAPTER NO. 17 : DISTRIBUTED ACOUSTIC SENSING MARKET – NORTH AMERICA 107
17.1. North America 107
17.1.1. Key Highlights 107
17.1.2. North America Distributed Acoustic Sensing Market Revenue, By Country, 2018 – 2023 (USD Million) 108
17.1.3. North America Distributed Acoustic Sensing Market Revenue, By Fiber Type, 2018 – 2023 (USD Million) 109
17.1.4. North America Distributed Acoustic Sensing Market Revenue, By Application, 2018 – 2023 (USD Million) 110
17.1.5. North America Distributed Acoustic Sensing Market Revenue, By End-User Industry, 2018 – 2023 (USD Million) 111
17.2. U.S. 112
17.3. Canada 112
17.4. Mexico 112
CHAPTER NO. 18 : DISTRIBUTED ACOUSTIC SENSING MARKET – EUROPE 113
18.1. Europe 113
18.1.1. Key Highlights 113
18.1.2. Europe Distributed Acoustic Sensing Market Revenue, By Country, 2018 – 2023 (USD Million) 114
18.1.3. Europe Distributed Acoustic Sensing Market Revenue, By Fiber Type, 2018 – 2023 (USD Million) 115
18.1.4. Europe Distributed Acoustic Sensing Market Revenue, By Application, 2018 – 2023 (USD Million) 116
18.1.5. Europe Distributed Acoustic Sensing Market Revenue, By End-User Industry, 2018 – 2023 (USD Million) 117
18.2. UK 118
18.3. France 118
18.4. Germany 118
18.5. Italy 118
18.6. Spain 118
18.7. Russia 118
18.8. Belgium 118
18.9. Netherland 118
18.10. Austria 118
18.11. Sweden 118
18.12. Poland 118
18.13. Denmark 118
18.14. Switzerland 118
18.15. Rest of Europe 118
CHAPTER NO. 19 : DISTRIBUTED ACOUSTIC SENSING MARKET – ASIA PACIFIC 119
19.1. Asia Pacific 119
19.1.1. Key Highlights 119
19.1.2. Asia Pacific Distributed Acoustic Sensing Market Revenue, By Country, 2018 – 2023 (USD Million) 120
19.1.3. Asia Pacific Distributed Acoustic Sensing Market Revenue, By Fiber Type, 2018 – 2023 (USD Million) 121
19.1.4. Asia Pacific Distributed Acoustic Sensing Market Revenue, By Application, 2018 – 2023 (USD Million) 122
19.1.5. Asia Pacific Distributed Acoustic Sensing Market Revenue, By End-User Industry, 2018 – 2023 (USD Million) 123
19.2. China 124
19.3. Japan 124
19.4. South Korea 124
19.5. India 124
19.6. Australia 124
19.7. Thailand 124
19.8. Indonesia 124
19.9. Vietnam 124
19.10. Malaysia 124
19.11. Philippines 124
19.12. Taiwan 124
19.13. Rest of Asia Pacific 124
CHAPTER NO. 20 : DISTRIBUTED ACOUSTIC SENSING MARKET – LATIN AMERICA 125
20.1. Latin America 125
20.1.1. Key Highlights 125
20.1.2. Latin America Distributed Acoustic Sensing Market Revenue, By Country, 2018 – 2023 (USD Million) 126
20.1.3. Latin America Distributed Acoustic Sensing Market Revenue, By Fiber Type, 2018 – 2023 (USD Million) 127
20.1.4. Latin America Distributed Acoustic Sensing Market Revenue, By Application, 2018 – 2023 (USD Million) 128
20.1.5. Latin America Distributed Acoustic Sensing Market Revenue, By End-User Industry, 2018 – 2023 (USD Million) 129
20.2. Brazil 130
20.3. Argentina 130
20.4. Peru 130
20.5. Chile 130
20.6. Colombia 130
20.7. Rest of Latin America 130
CHAPTER NO. 21 : DISTRIBUTED ACOUSTIC SENSING MARKET – MIDDLE EAST 131
21.1. Middle East 131
21.1.1. Key Highlights 131
21.1.2. Middle East Distributed Acoustic Sensing Market Revenue, By Country, 2018 – 2023 (USD Million) 132
21.1.3. Middle East Distributed Acoustic Sensing Market Revenue, By Fiber Type, 2018 – 2023 (USD Million) 133
21.1.4. Middle East Distributed Acoustic Sensing Market Revenue, By Application, 2018 – 2023 (USD Million) 134
21.1.5. Middle East Distributed Acoustic Sensing Market Revenue, By End-User Industry, 2018 – 2023 (USD Million) 135
21.2. UAE 136
21.3. KSA 136
21.4. Israel 136
21.5. Turkey 136
21.6. Iran 136
21.7. Rest of Middle East 136
CHAPTER NO. 22 : DISTRIBUTED ACOUSTIC SENSING MARKET – AFRICA 137
22.1. Africa 137
22.1.1. Key Highlights 137
22.1.2. Africa Distributed Acoustic Sensing Market Revenue, By Country, 2018 – 2023 (USD Million) 138
22.1.3. Africa Distributed Acoustic Sensing Market Revenue, By Fiber Type, 2018 – 2023 (USD Million) 139
22.1.4. Africa Distributed Acoustic Sensing Market Revenue, By Application, 2018 – 2023 (USD Million) 140
22.1.5. Africa Distributed Acoustic Sensing Market Revenue, By End-User Industry, 2018 – 2023 (USD Million) 141
22.2. Egypt 142
22.3. Nigeria 142
22.4. Algeria 142
22.5. Morocco 142
22.6. Rest of Africa 142
CHAPTER NO. 23 : COMPANY PROFILES 143
23.1. Schlumberger Limited 143
23.1.1. Company Overview 143
23.1.2. Product Portfolio 143
23.1.3. Swot Analysis 143
23.1.4. Business Strategy 144
23.1.5. Financial Overview 144
23.2. Baker Hughes Company 145
23.3. Halliburton Company 145
23.4. Silixa Ltd. 145
23.5. OptaSense (QinetiQ Group) 145
23.6. Fotech Solutions Ltd. 145
23.7. AP Sensing GmbH 145
23.8. Hifi Engineering Inc. 145
23.9. Future Fibre Technologies 145
23.10. OFS Fitel LLC 145
List of Figures
FIG NO. 1. Global Distributed Acoustic Sensing Market Revenue, 2018 – 2032 (USD Million) 34
FIG NO. 2. Porter’s Five Forces Analysis for Global Distributed Acoustic Sensing Market 41
FIG NO. 3. Value Chain Analysis for Global Distributed Acoustic Sensing Market 42
FIG NO. 4. Global Distributed Acoustic Sensing Market Import Volume/Revenue, By Region, 2018 – 2023 44
FIG NO. 5. Global Distributed Acoustic Sensing Market Export Volume/Revenue, By Region, 2018 – 2023 45
FIG NO. 6. Global Distributed Acoustic Sensing Market Demand Volume/Revenue, By Region, 2018 – 2023 46
FIG NO. 7. Global Distributed Acoustic Sensing Market Supply Volume/Revenue, By Region, 2018 – 2023 47
FIG NO. 8. Global Distributed Acoustic Sensing Market Production Volume/Revenue, By Region, 2018 – 2023 48
FIG NO. 9. Global Distributed Acoustic Sensing Market Price, By Region, 2018 – 2023 49
FIG NO. 10. Global Distributed Acoustic Sensing Market Price, By Fiber Type, 2018 – 2023 50
FIG NO. 11. Raw Materials Price Trend Analysis, 2018 – 2023 51
FIG NO. 12. Manufacturing Cost Analysis 52
FIG NO. 13. Manufacturing Process 52
FIG NO. 14. Company Share Analysis, 2023 53
FIG NO. 15. Company Share Analysis, 2023 54
FIG NO. 16. Company Share Analysis, 2023 54
FIG NO. 17. Company Share Analysis, 2023 55
FIG NO. 18. Distributed Acoustic Sensing Market – Company Volume Market Share, 2023 56
FIG NO. 19. Distributed Acoustic Sensing Market – Company Revenue Market Share, 2023 57
FIG NO. 20. Distributed Acoustic Sensing Market Revenue Share, By Fiber Type, 2023 & 2032 63
FIG NO. 21. Market Attractiveness Analysis, By Fiber Type 64
FIG NO. 22. Incremental Revenue Growth Opportunity by Fiber Type, 2024 – 2032 64
FIG NO. 23. Distributed Acoustic Sensing Market Revenue, By Fiber Type, 2018, 2023, 2027 & 2032 65
FIG NO. 24. Global Distributed Acoustic Sensing Market for Single-Mode Fiber, Revenue (USD Million) 2018 – 2032 66
FIG NO. 25. Global Distributed Acoustic Sensing Market for Multimode Fiber, Revenue (USD Million) 2018 – 2032 68
FIG NO. 26. Distributed Acoustic Sensing Market Revenue Share, By Application, 2023 & 2032 71
FIG NO. 27. Market Attractiveness Analysis, By Application 72
FIG NO. 28. Incremental Revenue Growth Opportunity by Application, 2024 – 2032 72
FIG NO. 29. Distributed Acoustic Sensing Market Revenue, By Application, 2018, 2023, 2027 & 2032 73
FIG NO. 30. Global Distributed Acoustic Sensing Market for Pipeline Monitoring, Revenue (USD Million) 2018 – 2032 74
FIG NO. 31. Global Distributed Acoustic Sensing Market for Transportation Monitoring, Revenue (USD Million) 2018 – 2032 76
FIG NO. 32. Global Distributed Acoustic Sensing Market for Border and Perimeter Security, Revenue (USD Million) 2018 – 2032 78
FIG NO. 33. Global Distributed Acoustic Sensing Market for Infrastructure Monitoring, Revenue (USD Million) 2018 – 2032 80
FIG NO. 34. Global Distributed Acoustic Sensing Market for Others, Revenue (USD Million) 2018 – 2032 82
FIG NO. 35. Distributed Acoustic Sensing Market Revenue Share, By End-User Industry, 2023 & 2032 85
FIG NO. 36. Market Attractiveness Analysis, By End-User Industry 86
FIG NO. 37. Incremental Revenue Growth Opportunity by End-User Industry, 2024 – 2032 86
FIG NO. 38. Distributed Acoustic Sensing Market Revenue, By End-User Industry, 2018, 2023, 2027 & 2032 87
FIG NO. 39. Global Distributed Acoustic Sensing Market for Oil & Gas, Revenue (USD Million) 2018 – 2032 88
FIG NO. 40. Global Distributed Acoustic Sensing Market for Defense and Security, Revenue (USD Million) 2018 – 2032 90
FIG NO. 41. Global Distributed Acoustic Sensing Market for Transportation, Revenue (USD Million) 2018 – 2032 92
FIG NO. 42. Global Distributed Acoustic Sensing Market for Utilities, Revenue (USD Million) 2018 – 2032 94
FIG NO. 43. Global Distributed Acoustic Sensing Market for Others, Revenue (USD Million) 2018 – 2032 96
FIG NO. 44. Global Distributed Acoustic Sensing Market Revenue Share, By Region, 2023 & 2032 99
FIG NO. 45. Market Attractiveness Analysis, By Region 100
FIG NO. 46. Incremental Revenue Growth Opportunity by Region, 2024 – 2032 100
FIG NO. 47. Distributed Acoustic Sensing Market Revenue, By Region, 2018, 2023, 2027 & 2032 101
FIG NO. 48. North America Distributed Acoustic Sensing Market Revenue, 2018 – 2032 (USD Million) 106
FIG NO. 49. Europe Distributed Acoustic Sensing Market Revenue, 2018 – 2032 (USD Million) 112
FIG NO. 50. Asia Pacific Distributed Acoustic Sensing Market Revenue, 2018 – 2032 (USD Million) 118
FIG NO. 51. Latin America Distributed Acoustic Sensing Market Revenue, 2018 – 2032 (USD Million) 124
FIG NO. 52. Middle East Distributed Acoustic Sensing Market Revenue, 2018 – 2032 (USD Million) 130
FIG NO. 53. Africa Distributed Acoustic Sensing Market Revenue, 2018 – 2032 (USD Million) 136
List of Tables
TABLE NO. 1. : Global Distributed Acoustic Sensing Market: Snapshot 30
TABLE NO. 2. : Drivers for the Distributed Acoustic Sensing Market: Impact Analysis 34
TABLE NO. 3. : Restraints for the Distributed Acoustic Sensing Market: Impact Analysis 36
TABLE NO. 4. : Global Distributed Acoustic Sensing Market Revenue, By Region, 2018 – 2023 46
TABLE NO. 5. : Global Distributed Acoustic Sensing Market Revenue, By Fiber Type, 2018 – 2023 47
TABLE NO. 6. : Key Raw Materials & Suppliers 48
TABLE NO. 7. : Global Single-Mode Fiber Distributed Acoustic Sensing Market Revenue, By Region, 2018 – 2023 (USD Million) 64
TABLE NO. 8. : Global Single-Mode Fiber Distributed Acoustic Sensing Market Revenue, By Region, 2024 – 2032 (USD Million) 64
TABLE NO. 9. : Global Multimode Fiber Distributed Acoustic Sensing Market Revenue, By Region, 2018 – 2023 (USD Million) 66
TABLE NO. 10. : Global Multimode Fiber Distributed Acoustic Sensing Market Revenue, By Region, 2024 – 2032 (USD Million) 66
TABLE NO. 11. : Global Pipeline Monitoring Distributed Acoustic Sensing Market Revenue, By Region, 2018 – 2023 (USD Million) 72
TABLE NO. 12. : Global Pipeline Monitoring Distributed Acoustic Sensing Market Revenue, By Region, 2024 – 2032 (USD Million) 72
TABLE NO. 13. : Global Transportation Monitoring Distributed Acoustic Sensing Market Revenue, By Region, 2018 – 2023 (USD Million) 74
TABLE NO. 14. : Global Transportation Monitoring Distributed Acoustic Sensing Market Revenue, By Region, 2024 – 2032 (USD Million) 74
TABLE NO. 15. : Global Border and Perimeter Security Distributed Acoustic Sensing Market Revenue, By Region, 2018 – 2023 (USD Million) 76
TABLE NO. 16. : Global Border and Perimeter Security Distributed Acoustic Sensing Market Revenue, By Region, 2024 – 2032 (USD Million) 76
TABLE NO. 17. : Global Infrastructure Monitoring Distributed Acoustic Sensing Market Revenue, By Region, 2018 – 2023 (USD Million) 78
TABLE NO. 18. : Global Infrastructure Monitoring Distributed Acoustic Sensing Market Revenue, By Region, 2024 – 2032 (USD Million) 78
TABLE NO. 19. : Global Others Distributed Acoustic Sensing Market Revenue, By Region, 2018 – 2023 (USD Million) 80
TABLE NO. 20. : Global Others Distributed Acoustic Sensing Market Revenue, By Region, 2024 – 2032 (USD Million) 80
TABLE NO. 21. : Global Oil & Gas Distributed Acoustic Sensing Market Revenue, By Region, 2018 – 2023 (USD Million) 86
TABLE NO. 22. : Global Oil & Gas Distributed Acoustic Sensing Market Revenue, By Region, 2024 – 2032 (USD Million) 86
TABLE NO. 23. : Global Defense and Security Distributed Acoustic Sensing Market Revenue, By Region, 2018 – 2023 (USD Million) 88
TABLE NO. 24. : Global Defense and Security Distributed Acoustic Sensing Market Revenue, By Region, 2024 – 2032 (USD Million) 88
TABLE NO. 25. : Global Transportation Distributed Acoustic Sensing Market Revenue, By Region, 2018 – 2023 (USD Million) 90
TABLE NO. 26. : Global Transportation Distributed Acoustic Sensing Market Revenue, By Region, 2024 – 2032 (USD Million) 90
TABLE NO. 27. : Global Utilities Distributed Acoustic Sensing Market Revenue, By Region, 2018 – 2023 (USD Million) 92
TABLE NO. 28. : Global Utilities Distributed Acoustic Sensing Market Revenue, By Region, 2024 – 2032 (USD Million) 92
TABLE NO. 29. : Global Others Distributed Acoustic Sensing Market Revenue, By Region, 2018 – 2023 (USD Million) 94
TABLE NO. 30. : Global Others Distributed Acoustic Sensing Market Revenue, By Region, 2024 – 2032 (USD Million) 94
TABLE NO. 31. : Global Distributed Acoustic Sensing Market Revenue, By Region, 2018 – 2023 (USD Million) 99
TABLE NO. 32. : Global Distributed Acoustic Sensing Market Revenue, By Region, 2024 – 2032 (USD Million) 99
TABLE NO. 33. : Global Distributed Acoustic Sensing Market Revenue, By Fiber Type, 2018 – 2023 (USD Million) 100
TABLE NO. 34. : Global Distributed Acoustic Sensing Market Revenue, By Fiber Type, 2024 – 2032 (USD Million) 100
TABLE NO. 35. : Global Distributed Acoustic Sensing Market Revenue, By Application, 2018 – 2023 (USD Million) 101
TABLE NO. 36. : Global Distributed Acoustic Sensing Market Revenue, By Application, 2024 – 2032 (USD Million) 101
TABLE NO. 37. : Global Distributed Acoustic Sensing Market Revenue, By End-User Industry, 2018 – 2023 (USD Million) 102
TABLE NO. 38. : Global Distributed Acoustic Sensing Market Revenue, By End-User Industry, 2024 – 2032 (USD Million) 102
TABLE NO. 39. : North America Distributed Acoustic Sensing Market Revenue, By Country, 2018 – 2023 (USD Million) 104
TABLE NO. 40. : North America Distributed Acoustic Sensing Market Revenue, By Country, 2024 – 2032 (USD Million) 104
TABLE NO. 41. : North America Distributed Acoustic Sensing Market Revenue, By Fiber Type, 2018 – 2023 (USD Million) 105
TABLE NO. 42. : North America Distributed Acoustic Sensing Market Revenue, By Fiber Type, 2024 – 2032 (USD Million) 105
TABLE NO. 43. : North America Distributed Acoustic Sensing Market Revenue, By Application, 2018 – 2023 (USD Million) 106
TABLE NO. 44. : North America Distributed Acoustic Sensing Market Revenue, By Application, 2024 – 2032 (USD Million) 106
TABLE NO. 45. : North America Distributed Acoustic Sensing Market Revenue, By End-User Industry, 2018 – 2023 (USD Million) 107
TABLE NO. 46. : North America Distributed Acoustic Sensing Market Revenue, By End-User Industry, 2024 – 2032 (USD Million) 107
TABLE NO. 47. : Europe Distributed Acoustic Sensing Market Revenue, By Country, 2018 – 2023 (USD Million) 110
TABLE NO. 48. : Europe Distributed Acoustic Sensing Market Revenue, By Country, 2024 – 2032 (USD Million) 110
TABLE NO. 49. : Europe Distributed Acoustic Sensing Market Revenue, By Fiber Type, 2018 – 2023 (USD Million) 111
TABLE NO. 50. : Europe Distributed Acoustic Sensing Market Revenue, By Fiber Type, 2024 – 2032 (USD Million) 111
TABLE NO. 51. : Europe Distributed Acoustic Sensing Market Revenue, By Application, 2018 – 2023 (USD Million) 112
TABLE NO. 52. : Europe Distributed Acoustic Sensing Market Revenue, By Application, 2024 – 2032 (USD Million) 112
TABLE NO. 53. : Europe Distributed Acoustic Sensing Market Revenue, By End-User Industry, 2018 – 2023 (USD Million) 113
TABLE NO. 54. : Europe Distributed Acoustic Sensing Market Revenue, By End-User Industry, 2024 – 2032 (USD Million) 113
TABLE NO. 55. : Asia Pacific Distributed Acoustic Sensing Market Revenue, By Country, 2018 – 2023 (USD Million) 116
TABLE NO. 56. : Asia Pacific Distributed Acoustic Sensing Market Revenue, By Country, 2024 – 2032 (USD Million) 116
TABLE NO. 57. : Asia Pacific Distributed Acoustic Sensing Market Revenue, By Fiber Type, 2018 – 2023 (USD Million) 117
TABLE NO. 58. : Asia Pacific Distributed Acoustic Sensing Market Revenue, By Fiber Type, 2024 – 2032 (USD Million) 117
TABLE NO. 59. : Asia Pacific Distributed Acoustic Sensing Market Revenue, By Application, 2018 – 2023 (USD Million) 118
TABLE NO. 60. : Asia Pacific Distributed Acoustic Sensing Market Revenue, By Application, 2024 – 2032 (USD Million) 118
TABLE NO. 61. : Asia Pacific Distributed Acoustic Sensing Market Revenue, By End-User Industry, 2018 – 2023 (USD Million) 119
TABLE NO. 62. : Asia Pacific Distributed Acoustic Sensing Market Revenue, By End-User Industry, 2024 – 2032 (USD Million) 119
TABLE NO. 63. : Latin America Distributed Acoustic Sensing Market Revenue, By Country, 2018 – 2023 (USD Million) 122
TABLE NO. 64. : Latin America Distributed Acoustic Sensing Market Revenue, By Country, 2024 – 2032 (USD Million) 122
TABLE NO. 65. : Latin America Distributed Acoustic Sensing Market Revenue, By Fiber Type, 2018 – 2023 (USD Million) 123
TABLE NO. 66. : Latin America Distributed Acoustic Sensing Market Revenue, By Fiber Type, 2024 – 2032 (USD Million) 123
TABLE NO. 67. : Latin America Distributed Acoustic Sensing Market Revenue, By Application, 2018 – 2023 (USD Million) 124
TABLE NO. 68. : Latin America Distributed Acoustic Sensing Market Revenue, By Application, 2024 – 2032 (USD Million) 124
TABLE NO. 69. : Latin America Distributed Acoustic Sensing Market Revenue, By End-User Industry, 2018 – 2023 (USD Million) 125
TABLE NO. 70. : Latin America Distributed Acoustic Sensing Market Revenue, By End-User Industry, 2024 – 2032 (USD Million) 125
TABLE NO. 71. : Middle East Distributed Acoustic Sensing Market Revenue, By Country, 2018 – 2023 (USD Million) 128
TABLE NO. 72. : Middle East Distributed Acoustic Sensing Market Revenue, By Country, 2024 – 2032 (USD Million) 128
TABLE NO. 73. : Middle East Distributed Acoustic Sensing Market Revenue, By Fiber Type, 2018 – 2023 (USD Million) 129
TABLE NO. 74. : Middle East Distributed Acoustic Sensing Market Revenue, By Fiber Type, 2024 – 2032 (USD Million) 129
TABLE NO. 75. : Middle East Distributed Acoustic Sensing Market Revenue, By Application, 2018 – 2023 (USD Million) 130
TABLE NO. 76. : Middle East Distributed Acoustic Sensing Market Revenue, By Application, 2024 – 2032 (USD Million) 130
TABLE NO. 77. : Middle East Distributed Acoustic Sensing Market Revenue, By End-User Industry, 2018 – 2023 (USD Million) 131
TABLE NO. 78. : Middle East Distributed Acoustic Sensing Market Revenue, By End-User Industry, 2024 – 2032 (USD Million) 131
TABLE NO. 79. : Africa Distributed Acoustic Sensing Market Revenue, By Country, 2018 – 2023 (USD Million) 134
TABLE NO. 80. : Africa Distributed Acoustic Sensing Market Revenue, By Country, 2024 – 2032 (USD Million) 134
TABLE NO. 81. : Africa Distributed Acoustic Sensing Market Revenue, By Fiber Type, 2018 – 2023 (USD Million) 135
TABLE NO. 82. : Africa Distributed Acoustic Sensing Market Revenue, By Fiber Type, 2024 – 2032 (USD Million) 135
TABLE NO. 83. : Africa Distributed Acoustic Sensing Market Revenue, By Application, 2018 – 2023 (USD Million) 136
TABLE NO. 84. : Africa Distributed Acoustic Sensing Market Revenue, By Application, 2024 – 2032 (USD Million) 136
TABLE NO. 85. : Africa Distributed Acoustic Sensing Market Revenue, By End-User Industry, 2018 – 2023 (USD Million) 137
TABLE NO. 86. : Africa Distributed Acoustic Sensing Market Revenue, By End-User Industry, 2024 – 2032 (USD Million) 137