
Market Overview
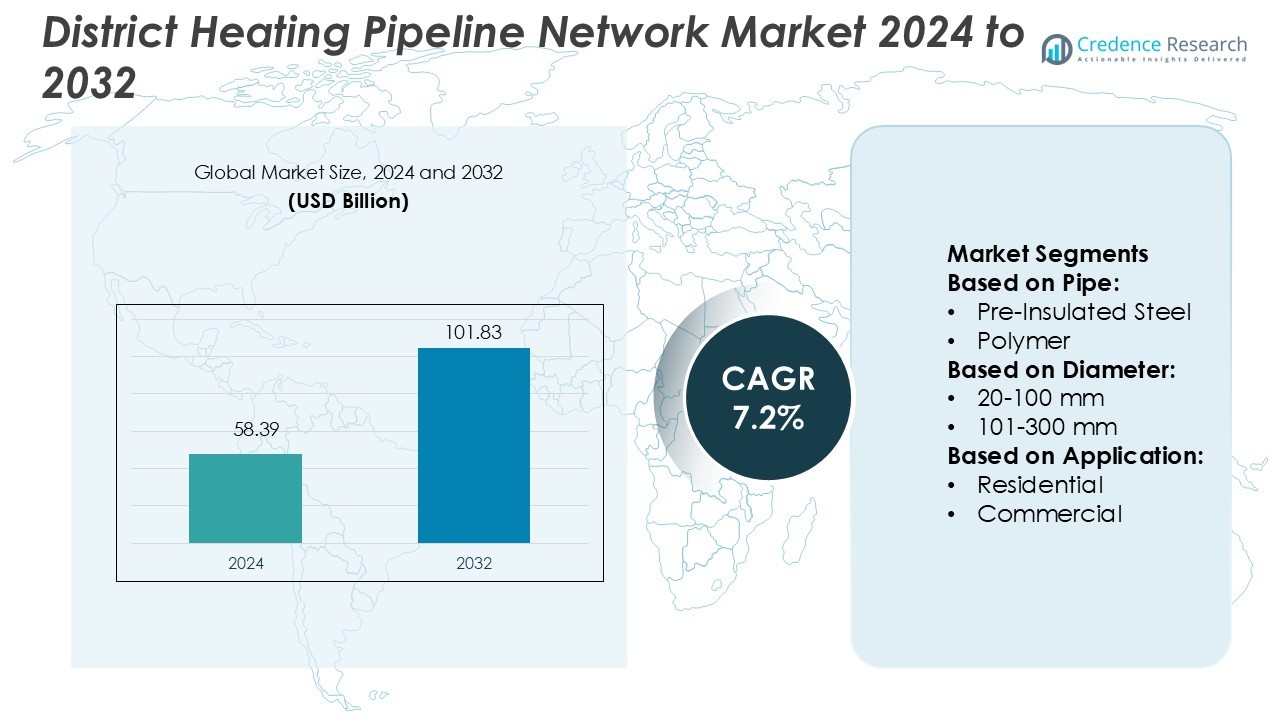
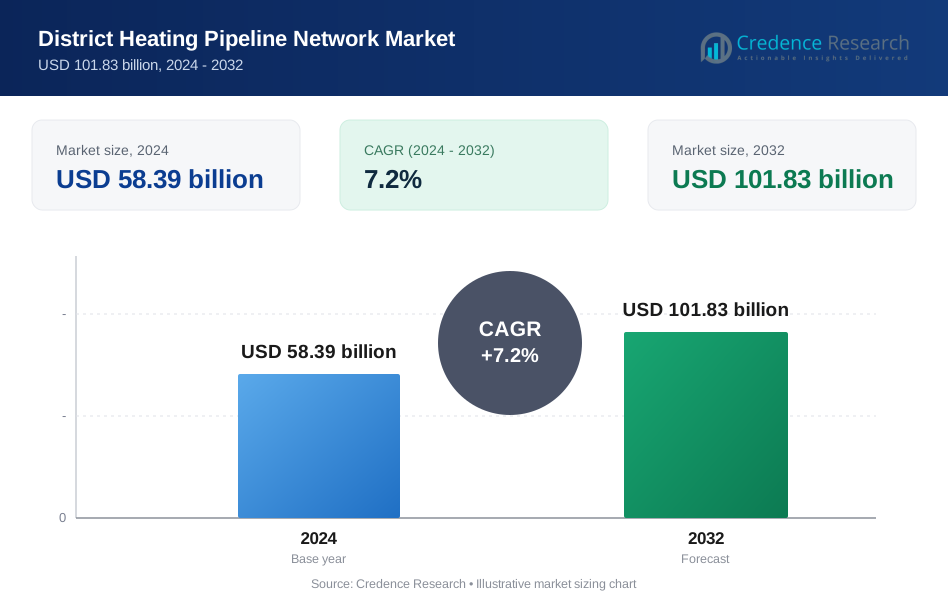
District Heating Pipeline Network Market size was valued USD 58.39 billion in 2024 and is anticipated to reach USD 101.83 billion by 2032, at a CAGR of 7.2% during the forecast period.
| REPORT ATTRIBUTE | DETAILS |
|---|---|
| Historical Period | 2020-2023 |
| Base Year | 2024 |
| Forecast Period | 2025-2032 |
| District Heating Pipeline Network Market Size 2024 | USD 58.39 Billion |
| District Heating Pipeline Network Market, CAGR | 7.2% |
| District Heating Pipeline Network Market Size 2032 | USD 101.83 Billion |
The district heating pipeline network market is shaped by prominent players including CPV, Isoplus, Golan Plastic Products, Perma-Pipe, Ke Kelit, Microflex, Logstor, Mannesmann Line Pipe, Brugg Pipes, and Aquatherm. These companies focus on advanced pre-insulated steel and polymer-based pipeline solutions to enhance energy efficiency and network performance. Many are investing in R&D, smart monitoring systems, and flexible pipe technologies to strengthen their competitive position. Europe leads the global market with a 36% share, supported by mature infrastructure, strong regulatory frameworks, and ambitious decarbonization targets. This regional leadership is reinforced by continuous modernization programs and integration of renewable energy sources.
Market Insights
- The district heating pipeline network market was valued at USD 58.39 billion in 2024 and is expected to reach USD 101.83 billion by 2032, growing at a CAGR of 7.2%.
- Rising demand for energy-efficient heating systems and strong decarbonization goals are driving pipeline network expansion globally.
- The market shows a clear trend toward renewable energy integration, smart monitoring technologies, and modern pre-insulated steel and polymer pipelines.
- Europe leads the market with a 36% share, supported by strong regulatory frameworks, while the 101–300 mm diameter segment dominates installations due to balanced performance and cost efficiency.
- High upfront investment remains a key restraint, but growing public-private partnerships and infrastructure modernization initiatives continue to strengthen long-term market growth prospects.
Market Segmentation Analysis:
By Pipe
The pre-insulated steel segment holds the dominant market share in the district heating pipeline network market. Pre-insulated steel pipes are preferred for their high thermal efficiency, durability, and ability to handle high-temperature water or steam. These pipes reduce energy loss during transmission, which supports operational cost savings and improved system performance. Their corrosion resistance and long service life make them suitable for large-scale district heating projects. Growing investments in modernizing urban heating infrastructure and expanding sustainable energy networks further strengthen the demand for pre-insulated steel pipelines over polymer-based alternatives.
- For instance, ISOPLUS Group manufactures around 4,000 kilometres of steel carrier pipe systems annually. These pipes reduce energy loss during transmission, which supports operational cost savings and improved system performance.
By Diameter
Pipelines with a diameter of 101–300 mm account for the largest market share in the district heating pipeline network. This segment offers an optimal balance between flow capacity and installation cost, making it ideal for medium to large-scale heating systems. It supports stable heat distribution in urban and industrial networks. These pipelines are widely used in retrofit and expansion projects due to their adaptability and lower energy losses. Rising government investments in efficient district heating infrastructure continue to drive the adoption of 101–300 mm diameter pipes.
- For instance, Straight pipe product is available in sizes up to DN 1000 and includes continuous operating temperature of 120 °C and a peak temperature of 140 °C (for up to 300 hours per year) per their specification.
By Application
The residential segment dominates the district heating pipeline network market. Rapid urbanization, population growth, and demand for energy-efficient heating solutions drive the adoption of district heating in residential buildings. District heating systems offer stable and reliable heat supply while supporting decarbonization goals through integration with renewable energy sources. Many countries are prioritizing residential heating upgrades as part of energy transition strategies. Favorable government policies, subsidies, and carbon reduction targets further accelerate pipeline network installations in residential areas, giving this segment a strong competitive edge over commercial applications.
Key Growth Drivers
Rising Focus on Energy Efficiency
The shift toward sustainable energy systems is a key driver for district heating pipeline network expansion. These systems reduce heat loss and improve energy distribution efficiency, supporting climate targets. Governments are promoting district heating to lower carbon emissions and enhance energy security. Utilities are investing in modern pipeline infrastructure to minimize operational costs and achieve higher thermal performance. Strong regulatory frameworks and incentives further accelerate adoption across urban centers, creating a solid foundation for market growth.
- For instance, Pexgol pipe specifications consistently state a working temperature range from -50 °C (-58 °F) to 110 °C (230 °F). This rating applies to the cross-linked polyethylene (PE-Xa) material, which gives the pipe its unique temperature resilience.
Urbanization and Infrastructure Development
Rapid urbanization is driving large-scale heating infrastructure projects worldwide. Growing populations in cities increase demand for centralized, efficient heating networks. District heating offers stable temperature control, low emissions, and cost-effective operation for urban clusters. Infrastructure investments in housing and mixed-use developments encourage pipeline network deployment. Many countries are integrating these systems into smart city projects, which supports reliable energy distribution and aligns with long-term urban sustainability goals.
- For instance, Perma-Pipe’s MULTI-THERM®500 pre-insulated conduit is a 10-gauge steel smooth-wall carrier pipe system rated for continuous transport of high-temperature fluids (see specification details).
Integration of Renewable Energy Sources
The growing use of renewable energy sources strengthens the adoption of district heating pipeline networks. Biomass, geothermal, and solar thermal systems are increasingly connected to these networks to supply low-carbon heat. This integration reduces reliance on fossil fuels and stabilizes energy costs. Many utilities are upgrading networks to support flexible and distributed generation sources. The transition aligns with national and regional decarbonization strategies, boosting market expansion.
Key Trends & Opportunities
Modernization of Pipeline Infrastructure
A major trend involves upgrading aging pipeline systems to improve efficiency and reduce heat loss. Modern pre-insulated pipes and smart control technologies enhance network performance and extend service life. Digital monitoring allows operators to detect leaks and optimize flow in real time. This modernization supports lower maintenance costs and reliable heat delivery. Such investments also open opportunities for technology providers specializing in smart district heating solutions.
- For instance, KE KELIT’s “KELIT P” pre-insulated district heating pipe system features a steel carrier pipe in accordance with ÖNORM EN 10220 and ÖNORM EN 10217-2, factory-insulated with polyurethane foam (density min. 60 kg/m³) and casing in PE-LD.
Expansion of Smart District Heating Networks
Smart technologies are creating new opportunities in district heating. Advanced control systems, IoT sensors, and predictive maintenance solutions enable automated network management. These technologies improve system reliability, energy efficiency, and cost savings for operators. Integrating AI and data analytics into pipeline monitoring helps forecast demand and optimize heat flow. This shift toward intelligent infrastructure attracts investments from both public and private sectors.
- For instance, Microflex DUO version use PEX-a with DIN 4726 anti-oxygen barrier, rated for media pressures up to 6 bar and thermal conditions of −10 °C to +95 °C.
Public-Private Partnerships (PPPs)
PPPs are emerging as a strong growth catalyst in the district heating pipeline network market. Governments collaborate with private firms to fund and develop large-scale heating projects. These partnerships accelerate network expansion while ensuring long-term operational efficiency. PPP models help mitigate financing challenges, especially in regions with ambitious energy transition goals. Such collaborations drive innovation, speed up deployment, and strengthen market penetration.
Key Challenges
High Initial Investment Costs
One of the main challenges is the high capital cost of installing district heating pipeline networks. Developing large underground systems requires extensive planning, labor, and specialized materials. Smaller municipalities often face funding constraints, delaying network deployment. Although operational costs are low in the long run, upfront expenses can limit adoption in emerging markets. Addressing these financial barriers is essential to scale installations effectively.
Technical Complexity and Maintenance
District heating pipeline networks demand specialized design, installation, and maintenance. Integrating multiple heat sources, ensuring proper insulation, and managing system pressure require skilled labor and advanced technology. Any failure in the network can lead to service disruption and costly repairs. Operators must invest in continuous monitoring and training to maintain operational reliability. This technical complexity creates entry barriers for new market participants.
Regional Analysis
North America
North America holds a 23% share in the district heating pipeline network market. The region benefits from strong urban infrastructure, high energy consumption, and government initiatives promoting low-carbon heating. The U.S. and Canada are modernizing old steam networks with pre-insulated pipeline systems to enhance energy efficiency. Many cities are integrating renewable energy sources such as biomass and geothermal into district heating systems. Ongoing investments in smart grid technologies and sustainability programs support further network expansion. Collaboration between public utilities and private firms is also accelerating deployment, particularly in densely populated urban centers and institutional campuses.
Europe
Europe leads the global market with a 36% share, supported by advanced district heating infrastructure and strong climate goals. Countries such as Germany, Denmark, Sweden, and Finland have well-established networks and continue to invest in upgrades. The EU’s decarbonization policies and renewable integration targets drive large-scale adoption. Pre-insulated steel pipelines dominate installations due to their durability and high thermal efficiency. Widespread deployment of smart technologies enhances operational efficiency and supports flexible energy sourcing. Ongoing modernization programs and regulatory incentives are expected to keep Europe at the forefront of the district heating pipeline network market.
Asia Pacific
Asia Pacific accounts for a 28% market share, driven by rapid urbanization, rising energy demand, and supportive government policies. China, South Korea, and Japan are leading regional investments in district heating pipeline networks. Many cities are replacing outdated coal-based systems with cleaner and more efficient pipeline infrastructure. Pre-insulated pipelines are gaining traction due to their energy-saving properties and ease of integration with renewable heat sources. Strong economic growth and large-scale residential construction are expanding network coverage. National decarbonization programs and smart city initiatives are expected to further boost market expansion across key economies.
Latin America
Latin America captures a 7% share of the district heating pipeline network market. Countries such as Brazil, Chile, and Argentina are beginning to invest in energy-efficient heating infrastructure to support growing urban centers. Rising demand for sustainable heating solutions is driving interest in district energy networks, especially in cooler regions. Government incentives and pilot programs are promoting the use of modern, insulated pipeline systems. Although the market is still developing, investments in renewable energy and urban modernization are expected to drive steady growth. Private partnerships and foreign investments also support infrastructure expansion in key cities.
Middle East & Africa
The Middle East & Africa holds a 6% share in the district heating pipeline network market. The region is in the early stage of adoption but shows strong potential in urban development and industrial projects. The UAE and Saudi Arabia are piloting district heating solutions to support sustainable city initiatives. The focus remains on energy efficiency, reduced emissions, and long-term operational savings. Harsh climatic conditions drive the need for robust, insulated pipelines that minimize thermal losses. Increasing collaboration between governments and private developers is likely to accelerate deployment in new infrastructure projects.
Market Segmentations:
By Pipe:
- Pre-Insulated Steel
- Polymer
By Diameter:
- 20-100 mm
- 101-300 mm
By Application:
- Residential
- Commercial
By Geography
- North America
- U.S.
- Canada
- Mexico
- Europe
- Germany
- France
- U.K.
- Italy
- Spain
- Rest of Europe
- Asia Pacific
- China
- Japan
- India
- South Korea
- South-east Asia
- Rest of Asia Pacific
- Latin America
- Brazil
- Argentina
- Rest of Latin America
- Middle East & Africa
- GCC Countries
- South Africa
- Rest of the Middle East and Africa
Competitive Landscape
The competitive landscape of the district heating pipeline network market features key players such as CPV, Isoplus, Golan Plastic Products, Perma-Pipe, Ke Kelit, Microflex, Logstor, Mannesmann Line Pipe, Brugg Pipes, and Aquatherm. The district heating pipeline network market is defined by strong technological innovation, sustainability efforts, and strategic expansion. Companies are investing in advanced pipeline technologies to improve thermal insulation, durability, and overall system performance. Pre-insulated steel and polymer pipelines are gaining traction due to their energy efficiency and ease of installation. Many players are focusing on integrating smart monitoring systems that enable leak detection and predictive maintenance, reducing downtime and operational costs. Strategic collaborations with utility companies and urban developers are also accelerating market penetration. Additionally, growing emphasis on renewable energy integration and regulatory support is encouraging companies to expand their product portfolios and geographical reach, strengthening their positions in both developed and emerging regions.
Key Player Analysis
- CPV
- Isoplus
- Golan Plastic Products
- Perma-Pipe
- Ke Kelit
- Microflex
- Logstor
- Mannesmann Line Pipe
- Brugg Pipes
- Aquatherm
Recent Developments
- In May 2025, ENGIE, in partnership with Suma Capital, inaugurated a new renewable district heating network in the city of Zamora. The project is developed through DH Ecoenergías Zamora, which focuses on sustainable infrastructure for the energy transition. In addition, these initiatives marked a key milestone in advancing the decarbonization of urban heating, integrating technological innovation with the use of local, renewable energy sources.
- In March 2024, Fortum, in collaboration with Hitachi Energy, implemented a groundbreaking project to utilize excess heat from data centers for heating homes and business premises. This project covers 40% of the district heating needs for 250,000 users in a CO2-free manner.
- In February 2024, LOGSTOR seized an opportunity in the district energy pipeline sector. Recognizing that buildings and construction account for significant energy consumption and CO2 emissions, the company is addressing the challenge of reducing energy use and carbon emissions in buildings.
- In February 2024, Ørsted entered into an agreement with VEKS and CTR to utilize surplus heat from the carbon capture process at Avedøre Power Station. The carbon capture plant, set to begin operation in 2026, will capture 150,000 tonnes of CO2 annually from the station's straw-fired unit.
Report Coverage
The research report offers an in-depth analysis based on Pipe, Diameter, Application and Geography. It details leading market players, providing an overview of their business, product offerings, investments, revenue streams, and key applications. Additionally, the report includes insights into the competitive environment, SWOT analysis, current market trends, as well as the primary drivers and constraints. Furthermore, it discusses various factors that have driven market expansion in recent years. The report also explores market dynamics, regulatory scenarios, and technological advancements that are shaping the industry. It assesses the impact of external factors and global economic changes on market growth. Lastly, it provides strategic recommendations for new entrants and established companies to navigate the complexities of the market.
Future Outlook
- The market will experience steady expansion supported by strong energy transition goals.
- Governments will increase funding for sustainable heating infrastructure.
- Renewable energy integration will become a core part of district heating networks.
- Modern pre-insulated pipelines will dominate new network installations.
- Smart monitoring systems will improve operational efficiency and reduce energy loss.
- Public-private partnerships will accelerate large-scale project deployment.
- Urbanization and smart city initiatives will drive network expansion.
- Technological innovations will reduce installation and maintenance costs.
- Emerging economies will adopt district heating to meet rising energy demand.
- Strong policy support and decarbonization goals will shape future market strategies.
Request a Free Sample
Fill in your details and we'll send you a free sample report.
- Sample data tables & charts
- Research methodology
Need a Custom Version of This Report?
Tailor the scope, geography, or segments to your exact requirements.
- Custom geography or segment scope
- Direct access to our analyst team
Frequently Asked Questions
What is the current market size for District Heating Pipeline Network Market, and what is its projected size in 2032?
At what Compound Annual Growth Rate is the District Heating Pipeline Network Market projected to grow between 2025 and 2032?
Which District Heating Pipeline Network Market segment held the largest share in 2024?
What are the primary factors fueling the growth of the District Heating Pipeline Network Market?
Who are the leading companies in the District Heating Pipeline Network Market?
Which region commanded the largest share of the District Heating Pipeline Network Market in 2024?
Table of Content
Chapter 1. Report Introduction
- 1.1 Report Description & Purpose
- 1.1.1 Report Title & Market Definition
- 1.1.2 Unique Selling Propositions (USP) & Key Differentiators
- 1.1.3 Value Proposition for Stakeholders
- 1.2 Research Objectives
- 1.2.1 Market Sizing Objectives (Volume & Revenue)
- 1.2.2 Segmentation Objectives
- 1.2.3 Competitive Intelligence Objectives
- 1.2.4 Forecast & Scenario Objectives
- 1.3 Report Scope
- 1.3.1 District Heating Pipeline Network Scope – Types & Subtypes Covered
- 1.3.2 Geographic Scope – Regions & Countries Covered
- 1.3.3 Historical Period, Base Year & Forecast Period (2024; forecast to 2032)
- 1.3.4 Inclusions & Exclusions
- 1.4 HS Code & Classification Framework
- 1.5 Currency, Units & Pricing Basis
- 1.6 Target Stakeholders
- 1.7 Limitations & Assumptions
Chapter 2. Executive Summary
- 2.1 Global District Heating Pipeline Network Market Snapshot
- 2.1.1 Market Size – Historical (2024) & Forecast (2024-2032) (2024: USD 58.39 billion → 2032: USD 101.83 billion)
- 2.1.2 Volume & Revenue – Global Totals
- 2.1.3 Key Market Highlights – Top Five Facts
- 2.2 District Heating Pipeline Network Market Segmentation Snapshot
- 2.2.1 Market Split by Region – 2024 vs. 2032
- 2.3 Competitive Snapshot
- 2.3.1 Top 10 Players by Revenue Share – 2024
- 2.3.2 Top 10 Players by Volume Share – 2024
- 2.3.3 Recent Strategic Developments (18-Month Summary)
- 2.4 Key Investment Highlights & Strategic Conclusions
Chapter 3. District Heating Pipeline Network Market Dynamics & Industry Analysis
- 3.1 Market Overview & Context
- 3.1.1 District Heating Pipeline Network Market Position in the Broader Automotive Value Chain
- 3.1.2 OEM vs. Replacement Market Dynamics
- 3.1.3 Market Maturity & Development Stage by Region
- 3.2 District Heating Pipeline Network Market Drivers
- 3.3 District Heating Pipeline Network Market Restraints & Challenges
- 3.4 District Heating Pipeline Network Market Opportunities
- 3.5 Porter's Five Forces Analysis
- 3.5.1 Threat of New Entrants
- 3.5.2 Bargaining Power of Suppliers
- 3.5.3 Bargaining Power of Buyers
- 3.5.4 Threat of Substitutes
- 3.5.5 Competitive Rivalry – Intensity Assessment
- 3.6 District Heating Pipeline Network Value Chain Analysis
- 3.6.1 Upstream – Raw Material/Input Suppliers
- 3.6.1.1 Raw Material/Input 1
- 3.6.1.2 Raw Material/Input 2
- 3.6.1.3 Raw Material/Input 3
- 3.6.2 Midstream – Production/Manufacturing/Service Delivery
- 3.6.2.1 Production/Process Overview
- 3.6.2.2 Key Facility Locations & Capacity by Manufacturer
- 3.6.3 Downstream – Distribution & End Consumer
- 3.6.3.1 Primary Channel – B2B/OEM
- 3.6.3.2 Secondary Channels – Dealer, Retail, Online, Direct
- 3.6.4 Value Chain Profitability Analysis
- 3.6.1 Upstream – Raw Material/Input Suppliers
- 3.7 PESTEL Analysis
- 3.7.1 Political Factors
- 3.7.2 Economic Factors
- 3.7.3 Social Factors
- 3.7.4 Technological Factors
- 3.7.5 Environmental Factors
- 3.7.6 Legal Factors
- 3.8 District Heating Pipeline Network Supply Chain Analysis
- 3.8.1 Raw Material/Input Supply Risk Assessment
- 3.8.2 Manufacturing Concentration Risk (Geographic Exposure)
- 3.8.3 Trade Disruption Impact Analysis
- 3.9 Regulatory & Policy Landscape
Note: The regulatory and policy landscape section covers regulations based on their applicability to the market, District Heating Pipeline Network category, geography, and scope of the study. Only regulatory frameworks with a material impact on operations, compliance, trade, sustainability, or market access are analyzed in detail.
Chapter 4. Key Investment Pockets & Opportunity Analysis
- 4.1 District Heating Pipeline Network Market Attractiveness Analysis
- 4.1.1 By Region – Investment Attractiveness Matrix (Volume × CAGR)
- 4.2 Absolute Revenue Growth Opportunity
- 4.2.1 By Region – Absolute USD Growth Through 2032
- 4.3 Incremental Volume Opportunity
- 4.3.1 By Region – Incremental Volume Through 2032
- 4.3.2 Segment – Incremental Volume
- 4.4 Emerging Submarket Opportunity Deep Dive (Subject to Applicability)
- 4.5 Emerging Market Opportunity Scorecards
- 4.5.1 United States
- 4.5.2 Europe
- 4.5.3 Asia
- 4.5.4 Middle East & Africa
Note: Emerging Market Opportunity Scorecards will be included based on relevance and strategic importance. Regions listed are indicative and may vary depending on data availability and market dynamics.
Chapter 5. District Heating Pipeline Network Import-Export Analysis & Trade Flows
- 5.1 Global Trade Overview
- 5.1.1 Global Export Value by Country (2024)
- 5.1.2 Global Export Volume by Country (2024)
- 5.1.3 Global Import Value by Country (2024)
- 5.1.4 Global Import Volume by Country (2024)
- 5.1.5 Net Trade Balance by Country (2024)
- 5.2 Export Analysis – Segment
- 5.2.1 Type 1 (HS Code)
- 5.2.2 Type 2 (HS Code)
- 5.2.3 Type 3 (HS Code)
- 5.2.4 Type 4 (HS Code)
- 5.2.5 Type 5 (HS Code)
- 5.3 Import Analysis – Segment
- 5.3.1 Type 1 (HS Code)
- 5.3.2 Type 2 (HS Code)
- 5.3.3 Type 3 (HS Code)
- 5.3.4 Type 4 (HS Code)
- 5.3.5 Type 5 (HS Code)
- 5.4 Average Unit Trade Prices
- 5.4.1 Average Export Price – Segment & Country
- 5.4.2 Average Import Price – Segment & Source Country
- 5.4.3 Price Trends (2024)
- 5.5 Key Trade Route Analysis
- 5.5.1 Trade Route 1
- 5.5.2 Trade Route 2
- 5.5.3 Trade Route 3
- 5.5.4 Trade Route 4
- 5.5.5 Trade Route 5
- 5.6 Trade Policy Impact Assessment
- 5.6.1 US Anti-Dumping & Section 301 Tariffs
- 5.6.2 EU Customs Union Impact
- 5.6.3 Major Free Trade Agreements
- 5.6.4 USMCA Rules of Origin
Note: Trade policy analysis will be included only where relevant to the District Heating Pipeline Network market.
Chapter 6. Competitive Landscape & Company Benchmarking
- 6.1 District Heating Pipeline Network Market Concentration & Structure
- 6.1.1 Herfindahl-Hirschman Index (HHI) – vs. 2024
- 6.1.2 Tier 1, Tier 2 & Tier 3 Market Structure
- 6.1.3 Global, Regional & Local Player Dynamics
- 6.2 District Heating Pipeline Network Market Share Analysis – 2024
- 6.2.1 Global Revenue Share by Company
- 6.2.2 Global Volume Share by Company
- 6.2.3 Regional Revenue Share
- 6.2.4 Market Share Evolution ( vs. 2024)
- 6.2.5 OEM Segment Share by Company
- 6.2.6 Replacement Segment Share by Company
- 6.3 Production/Delivery Capacity & Facility Analysis
- 6.3.1 Global Installed Capacity
- 6.3.2 Capacity Utilization Rates
- 6.3.3 Production/Output Volume
- 6.3.4 Facility Locations & Capacity Map
- 6.3.5 Planned Capacity Additions
- 6.4 District Heating Pipeline Network Competitive Benchmarking Matrix
- 6.4.1 Revenue, Volume, CAGR & Profitability Comparison
- 6.4.2 Channel Revenue Mix
- 6.4.3 Geographic Revenue Exposure
- 6.4.4 R&D Intensity
- 6.4.5 Sustainability Maturity
- 6.5 Strategic Developments in District Heating Pipeline Network (Last 24 Months)
- 6.5.1 Mergers, Acquisitions & Divestments
- 6.5.2 New District Heating Pipeline Network Launches
- 6.5.3 Facility Expansions
- 6.5.4 Strategic Alliances, Joint Ventures & Partnerships
- 6.5.5 Distribution Expansion & Market Entry
- 6.5.6 Sustainability & ESG Initiatives
- 6.6 Competitive Strategy Mapping
- 6.6.1 Leader, Challenger, Follower & Niche Classification
- 6.6.2 Pricing Strategy Comparison
- 6.6.3 Channel Strategy Matrix
Note: Strategic developments are included based on their materiality and the availability of reliable information.
Chapter 7. Global District Heating Pipeline Network Market – By Distribution Channel
- 7.1 Segment Overview
- 7.1.1 Volume & Revenue Split by Channel (2024 & 2032)
- 7.1.2 Channel Mix Evolution (2024-2032)
Chapter 8. Regional Market Analysis – Global Overview
- 8.1 Global Regional Overview
- 8.1.1 Regional Volume Share
- 8.1.2 Regional Revenue Share
- 8.1.3 Regional Volume by Region
- 8.1.4 Regional Revenue by Region
- 8.1.5 Regional Forecast Through 2032
- 8.2 Cross-Regional Segment Analysis
- 8.2.1 By Distribution Channel
- 8.2.2 By Brand/Price Tier
Chapter 9. North America District Heating Pipeline Network Market
- 9.1 United States
- 9.2 Canada
- 9.3 Mexico
Chapter 10. Europe District Heating Pipeline Network Market
- 10.1 Germany
- 10.2 France
- 10.3 Italy
- 10.4 United Kingdom
- 10.5 Spain
- 10.6 Poland
- 10.7 Russia
- 10.8 Netherlands
- 10.9 Belgium
- 10.10 Sweden
- 10.11 Denmark
- 10.12 Norway
- 10.13 Rest of Europe
Chapter 11. Asia Pacific District Heating Pipeline Network Market
- 11.1 China
- 11.2 India
- 11.3 Japan
- 11.4 South Korea
- 11.5 Thailand
- 11.6 Indonesia
- 11.7 Vietnam
- 11.8 Malaysia
- 11.9 Australia
- 11.10 Rest of Asia Pacific
Chapter 12. Latin America District Heating Pipeline Network Market
- 12.1 Brazil
- 12.2 Argentina
- 12.3 Colombia
- 12.4 Chile
- 12.5 Rest of Latin America
Chapter 13. Middle East District Heating Pipeline Network Market
- 13.1 Saudi Arabia
- 13.2 United Arab Emirates
- 13.3 Turkey
- 13.4 Israel
- 13.5 Iran
- 13.6 Rest of the Middle East
Chapter 14. Africa District Heating Pipeline Network Market
- 14.1 South Africa
- 14.2 Egypt
- 14.3 Nigeria
- 14.4 Morocco
- 14.5 Rest of Africa
Chapter 15. District Heating Pipeline Network Company Profiles
- 15.1 [Company 01]
- 15.1.1 Company Overview
- 15.1.2 Key Management Personnel
- 15.1.3 Products & Services Portfolio
- 15.1.4 Financial Performance
- 15.1.5 Key Market Focus & Geographic Presence
- 15.1.6 Recent Developments & Strategic Initiatives
Note: The company profile list is preliminary and may change based on research findings, market developments, data availability, and client requirements.
Chapter 16. Appendices
- Appendix A – List of Abbreviations & Acronyms
- Appendix B – Industry Classification Code Reference – Full Series
- Appendix C – Production & Capacity Data Tables
- Appendix D – End-Use & Demand Base Tables
- Appendix E – Consumption & Replacement Rate Assumptions
- Appendix F – ASP Reference Tables
- Appendix G – Manufacturing & Facility Database
- Appendix H – Import-Export Data Tables
- Appendix I – Regulatory Summary Tables
- Appendix J – Primary Research Participant List (Anonymized)
- Appendix K – Primary Research Questionnaire Framework
- Appendix L – Data Sources & Bibliography
- Appendix M – Market Size Divergence & Source Comparison
Chapter 17. Research Methodology
- 17.1 Research Framework & Philosophy
- 17.2 Secondary Research – Sources, Hierarchy & Data Extraction
- 17.3 Data Modeling – Bottom-Up & Top-Down Market Sizing
- 17.4 Primary Research – Stakeholder Framework, LOI & Sample Sizes
- 17.5 Forecast Methodology – Regression, Scenario & Sensitivity Analysis
- 17.6 Quality Control – Four-Layer Validation Framework
- 17.7 Limitations & Standard Assumptions
- 17.8 Disclaimer
