Market overview
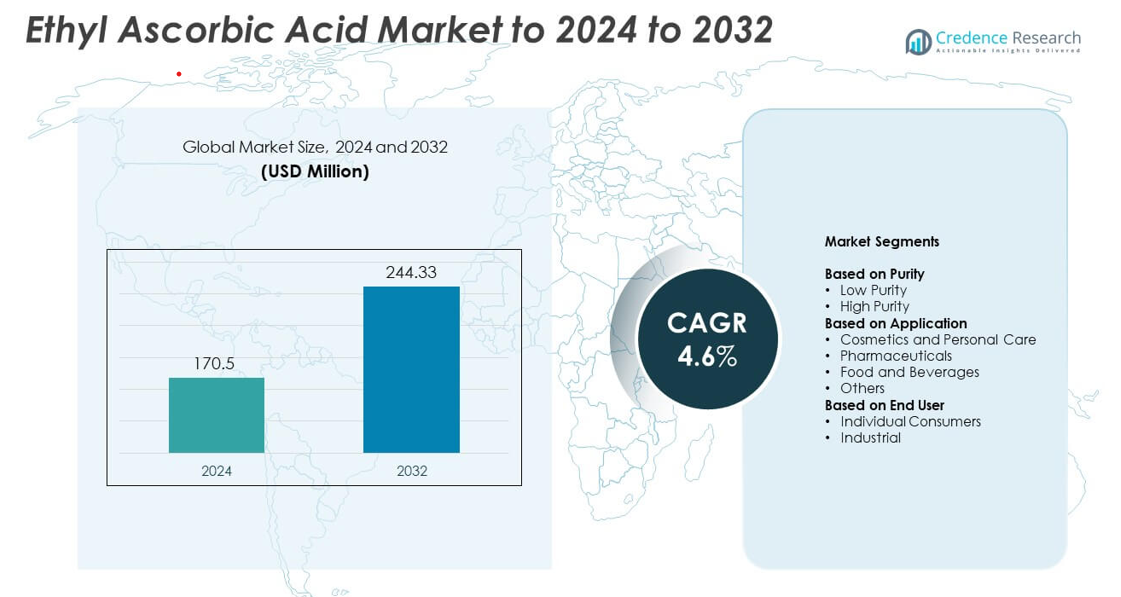
Ethyl Ascorbic Acid market size was valued at USD 170.5 million in 2024 and is anticipated to reach USD 244.33 million by 2032, at a CAGR of 4.6% during the forecast period.
| REPORT ATTRIBUTE |
DETAILS |
| Historical Period |
2020-2023 |
| Base Year |
2024 |
| Forecast Period |
2025-2032 |
| Ethyl Ascorbic Acid Market Size 2024 |
USD 170.5 million |
| Ethyl Ascorbic Acid Market, CAGR |
4.6% |
| Ethyl Ascorbic Acid Market Size 2032 |
USD 244.33 million |
The ethyl ascorbic acid market is highly competitive, with leading players such as Evonik Industries AG, Croda International Plc, Merck KGaA, Lonza Group Ltd., BASF SE, and Symrise AG driving innovation through advanced formulation technologies and sustainable ingredient development. These companies focus on improving product stability, purity, and bioavailability to meet growing demand in cosmetics, pharmaceuticals, and nutraceuticals. Strategic collaborations and R&D investments enhance their global footprint and product portfolios. Asia-Pacific leads the global market with a 33% share in 2024, driven by expanding cosmetics manufacturing, rising skincare awareness, and strong regional production capabilities.
Market Insights
- The ethyl ascorbic acid market was valued at USD 170.5 million in 2024 and is projected to reach USD 244.33 million by 2032, growing at a CAGR of 4.6%.
- Increasing demand for high-purity ethyl ascorbic acid in skincare and pharmaceutical formulations drives market growth.
- Trends such as sustainable ingredient sourcing and integration into advanced delivery systems are shaping market innovation.
- The market remains competitive, with key players focusing on R&D, product stability, and eco-friendly manufacturing to strengthen their position.
- Asia-Pacific leads with a 33% share, followed by North America at 31% and Europe at 28%, while the high-purity segment dominates with 72% market share.
Access crucial information at unmatched prices!
Request your sample report today & start making informed decisions powered by Credence Research Inc.!
Download Sample
Market Segmentation Analysis:
By Purity
The high purity segment dominated the ethyl ascorbic acid market with a 72% share in 2024. Its dominance stems from extensive use in skincare formulations due to superior stability and higher antioxidant efficiency compared to low-purity grades. High-purity ethyl ascorbic acid enhances collagen synthesis and reduces oxidative stress, making it ideal for anti-aging and brightening products. Manufacturers prefer this grade to meet stringent cosmetic and pharmaceutical quality standards. Growing demand for premium skincare and dermatological products continues to drive segment growth across global markets.
- For instance, Tokyo Chemical Industry lists 3-O-ethyl-L-ascorbic acid at ≥98.0% purity (HPLC) with a 112–116 °C melting point, supporting high-purity use.
By Application
The cosmetics and personal care segment held the largest share of 63% in 2024, supported by widespread use in serums, creams, and lotions for skin whitening and anti-aging. Ethyl ascorbic acid’s stability and skin-penetrating ability make it a preferred derivative of vitamin C. Rising awareness of antioxidant-based skincare and demand for multifunctional ingredients are key growth drivers. Expanding product portfolios by beauty brands focusing on brightening and pigmentation control continue to strengthen this segment’s market position worldwide.
- For instance, The Ordinary commercialized a serum containing 15% ethylated ascorbic acid, indicating strong cosmetic adoption.
By End User
The industrial segment accounted for the largest market share of 68% in 2024, driven by large-scale consumption across cosmetic, pharmaceutical, and food processing industries. Industrial users adopt ethyl ascorbic acid for its versatility in formulation stability and compatibility with various product bases. Increased demand from manufacturers seeking long-lasting vitamin C alternatives in bulk drives growth. Continuous innovation in formulation technologies and growing partnerships among ingredient suppliers and personal care product makers further support the industrial segment’s dominance globally
Key Growth Drivers
Rising Demand in Skincare and Cosmetics
The growing demand for advanced skincare formulations is a primary driver of the ethyl ascorbic acid market. This compound offers superior stability and skin absorption compared to traditional vitamin C, making it highly effective in brightening and anti-aging products. The increasing popularity of antioxidant-based beauty solutions, particularly in Asia-Pacific and Europe, strengthens product adoption. Expanding consumer awareness regarding skin health and the rising preference for clean-label and multifunctional cosmetics continue to boost market growth.
- For instance, Matex Lab S.p.A. reported a 15.52% melanin reduction after 4 days on reconstructed pigmented epidermis using a serum with 30% 3-O-ethyl ascorbic acid and 1% lactic acid.
Expansion in Pharmaceutical Applications
Ethyl ascorbic acid is increasingly used in pharmaceutical formulations due to its strong antioxidant and anti-inflammatory properties. It helps improve immune support and tissue repair while maintaining stability under varied conditions. Pharmaceutical manufacturers prefer ethyl ascorbic acid for drug formulations that require extended shelf life. Rising health concerns and ongoing R&D investments in vitamin derivatives for medical applications drive this segment’s expansion, particularly in markets emphasizing preventive healthcare and natural bioactives.
- For instance, research published in Pharmaceutics in April 2020 by scientists from the University of Hertfordshire investigated the topical delivery of 3-O-ethyl-L-ascorbic acid.
Growing Adoption in Functional Food and Beverages
The functional food and beverage sector is emerging as a strong growth area for ethyl ascorbic acid. It serves as a stable vitamin C source in fortified drinks, dietary supplements, and nutraceuticals. Increasing consumer focus on immune health, coupled with demand for clean and effective antioxidants, drives market penetration. Food manufacturers are integrating ethyl ascorbic acid into health-oriented products, promoting its role in extending product shelf life while maintaining nutritional benefits.
Key Trends and Opportunities
Shift Toward Sustainable Ingredient Sourcing
Sustainability is becoming a key trend shaping the ethyl ascorbic acid market. Manufacturers are focusing on eco-friendly production and plant-based sourcing to align with consumer expectations for natural ingredients. Companies are investing in greener synthesis technologies that minimize chemical waste and energy consumption. This shift enhances brand reputation and regulatory compliance while offering new growth opportunities across clean-beauty and nutraceutical sectors.
- For instance, Tokyo Chemical Industry Co., Ltd. lists a specific rotation of +45.0 to +49.0 ° (C=1, MeOH) for 3-O-ethyl-L-ascorbic acid.
Integration in Advanced Formulation Technologies
Innovation in formulation science presents major opportunities for ethyl ascorbic acid. It is increasingly incorporated into microencapsulation and liposomal delivery systems to enhance stability and efficacy. Cosmetic and pharmaceutical companies are developing time-release and combination formulations that improve bioavailability. The growing demand for high-performance, science-backed products supports further integration of ethyl ascorbic acid into next-generation formulations.
- For instance, Allies of Skin markets a waterless serum formulated with 20% ethylated L-ascorbic acid, reflecting high-load, stability-focused formulations.
Key Challenges
High Production and Formulation Costs
High manufacturing and formulation costs remain a key challenge for the ethyl ascorbic acid market. Producing high-purity grades requires advanced equipment, strict quality control, and specialized processes, leading to higher product prices. Smaller manufacturers often face difficulties maintaining profitability amid growing price competition. These costs limit accessibility in price-sensitive markets, slowing overall adoption in emerging economies.
Limited Stability in Harsh Conditions
Despite its improved stability over pure vitamin C, ethyl ascorbic acid can degrade under certain pH and temperature conditions. This poses challenges for long-term product formulation and storage, especially in tropical climates. Maintaining consistent efficacy in complex formulations requires ongoing innovation in stabilization technologies. These technical limitations may restrict broader use across certain food and pharmaceutical applications.
Regional Analysis
North America
North America held a 31% share of the ethyl ascorbic acid market in 2024, driven by high demand from the cosmetics and pharmaceutical sectors. The United States leads regional consumption, supported by strong adoption of premium skincare and anti-aging formulations. Growing consumer preference for vitamin C derivatives and the presence of key cosmetic ingredient suppliers strengthen regional growth. Expanding applications in nutraceuticals and functional beverages also contribute to demand. Continuous innovation in clean-label and dermatology-based formulations keeps North America a key revenue contributor to the global market.
Europe
Europe accounted for 28% of the ethyl ascorbic acid market share in 2024, supported by strong demand from skincare and personal care manufacturers. Countries such as Germany, France, and the United Kingdom are major consumers due to the region’s well-established cosmetics industry. Stringent product safety regulations and a growing preference for sustainable ingredients enhance market growth. The increasing popularity of vitamin-enriched creams and serums drives continuous innovation among European brands. Rising investments in research for natural and stable antioxidant compounds further strengthen regional competitiveness.
Asia-Pacific
Asia-Pacific dominated the ethyl ascorbic acid market with a 33% share in 2024, led by China, Japan, and South Korea. The region’s dominance stems from strong consumer demand for brightening and anti-aging skincare products. Expanding cosmetics manufacturing and large-scale production capabilities drive cost efficiency. Rapid urbanization, increasing disposable income, and the popularity of K-beauty and J-beauty trends continue to boost adoption. Growing health awareness and rising consumption of functional foods and supplements also fuel market expansion across Asia-Pacific, making it the fastest-growing region globally.
Latin America
Latin America captured an 5% share of the ethyl ascorbic acid market in 2024, primarily driven by increasing skincare awareness and rising disposable income. Brazil and Mexico lead regional consumption due to a growing middle-class population adopting personal care routines. Expanding cosmetic manufacturing bases and the influence of global beauty trends contribute to market penetration. The demand for antioxidant-rich products and natural formulations is rising steadily. Supportive government initiatives encouraging local pharmaceutical and cosmetic production also stimulate the adoption of ethyl ascorbic acid in the region.
Middle East and Africa
The Middle East and Africa accounted for 3% of the ethyl ascorbic acid market share in 2024. Growth is supported by increasing demand for premium cosmetics and skincare products in Gulf Cooperation Council countries. Rising consumer focus on personal grooming and exposure to Western beauty trends drive product adoption. Expanding retail distribution networks and the growth of e-commerce platforms improve accessibility across urban areas. However, limited manufacturing infrastructure and dependence on imports constrain faster market growth, though future expansion is expected with rising investments in the beauty and health sectors.
Market Segmentations:
By Purity
By Application
- Cosmetics and Personal Care
- Pharmaceuticals
- Food and Beverages
- Others
By End User
- Individual Consumers
- Industrial
By Geography
- North America
- Europe
- Germany
- France
- Italy
- U.K.
- Russia
- Rest of Europe
- Asia-Pacific
- India
- China
- Japan
- Rest of Asia-Pacific
- Latin America
- Brazil
- Mexico
- Rest of Latin America
- Middle East and Africa
- GCC Countries
- South Africa
- Rest of Middle East and Africa
Competitive Landscape
The competitive landscape of the ethyl ascorbic acid market features leading players such as Evonik Industries AG, Croda International Plc, Merck KGaA, Lonza Group Ltd., Symrise AG, BASF SE, Wacker Chemie AG, Corbion N.V., Ashland Global Holdings Inc., The Lubrizol Corporation, Eastman Chemical Company, Seppic SA, Parchem, and Koninklijke DSM N.V. The market is characterized by strong competition based on product purity, formulation stability, and regulatory compliance. Companies focus on R&D to improve the bioavailability and formulation performance of ethyl ascorbic acid across skincare, pharmaceutical, and food applications. Strategic mergers, partnerships, and capacity expansions are common strategies to strengthen market reach. Rising demand for high-quality, sustainable ingredients drives innovation in green manufacturing processes. Players are also investing in customized formulations to meet specific needs of cosmetic and nutraceutical manufacturers, reinforcing their competitive edge in both developed and emerging markets.
Shape Your Report to Specific Countries or Regions & Enjoy 30% Off!
Key Player Analysis
- Evonik Industries AG
- Croda International Plc
- Merck KGaA
- Lonza Group Ltd.
- Symrise AG
- BASF SE
- Wacker Chemie AG
- Corbion N.V.
- Ashland Global Holdings Inc.
- The Lubrizol Corporation
- Eastman Chemical Company
- Seppic SA
- Parchem
- Koninklijke DSM N.V
Recent Developments
- In 2025, Symrise AG introduces Mindera product platform that unlocks the future of natural cosmetic product protection.
- In 2024, DSM and BASF entered a strategic partnership to co-create and commercialize new, nature-derived vitamin C ingredients
- In 2023, Parchem continued to offer EAA as part of its broad portfolio of fine and specialty chemicals, catering to a wide range of industries including personal care
Report Coverage
The research report offers an in-depth analysis based on Purity, Application, End-User and Geography. It details leading market players, providing an overview of their business, product offerings, investments, revenue streams, and key applications. Additionally, the report includes insights into the competitive environment, SWOT analysis, current market trends, as well as the primary drivers and constraints. Furthermore, it discusses various factors that have driven market expansion in recent years. The report also explores market dynamics, regulatory scenarios, and technological advancements that are shaping the industry. It assesses the impact of external factors and global economic changes on market growth. Lastly, it provides strategic recommendations for new entrants and established companies to navigate the complexities of the market.
Future Outlook
- Demand for ethyl ascorbic acid will rise with growing interest in advanced skincare formulations.
- The cosmetics and personal care industry will remain the leading end-use sector worldwide.
- Increasing use in pharmaceutical products will expand due to its strong antioxidant benefits.
- Asia-Pacific will continue to lead global consumption supported by local production growth.
- Manufacturers will focus on sustainable sourcing and eco-friendly production technologies.
- Functional foods and beverages will emerge as a key growth segment in coming years.
- Research into enhanced formulation stability will drive innovation in product development.
- Partnerships between cosmetic ingredient suppliers and major brands will strengthen market presence.
- Rising consumer preference for vitamin-based and natural products will fuel product adoption.
- Continued investments in R&D will expand new applications across personal care and health industries.



