Market Overview
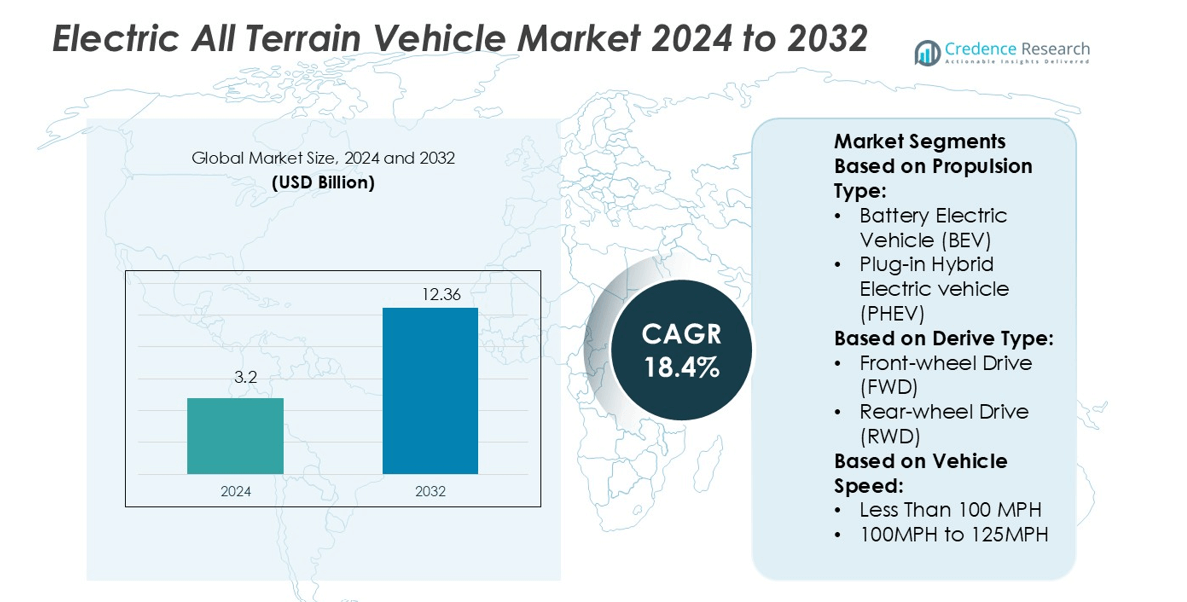
Electric All Terrain Vehicle Market size was valued USD 3.2 billion in 2024 and is anticipated to reach USD 12.36 billion by 2032, at a CAGR of 18.4% during the forecast period.
| REPORT ATTRIBUTE |
DETAILS |
| Historical Period |
2020-2023 |
| Base Year |
2024 |
| Forecast Period |
2025-2032 |
| Electric All Terrain Vehicle Market Size 2024 |
USD 3.2 billion |
| Electric All Terrain Vehicle Market, CAGR |
18.4% |
| Electric All Terrain Vehicle Market Size 2032 |
USD 12.36 billion |
The Electric All Terrain Vehicle Market is led by prominent players including DRR USA, Eco Charger, Polaris Inc., Daymak Inc., Powerland, Artic Cat Inc., Theron, Tesla, Inc., Eco Rider, and BRP. These companies focus on advanced powertrain technologies, extended battery life, and improved off-road performance to strengthen their market positions. Strategic initiatives such as product diversification, technology partnerships, and regional expansions drive competitive advantage. North America leads the global market with a 39.2% share, supported by robust charging infrastructure, favorable government incentives, and a strong outdoor recreation culture. This regional dominance positions manufacturers to capitalize on rising consumer demand and expand their technological capabilities.
Market Insights
- The Electric All Terrain Vehicle Market was valued at USD 3.2 billion in 2024 and is expected to reach USD 12.36 billion by 2032, growing at a CAGR of 18.4%.
- Rising demand for sustainable mobility and growing off-road recreational activities drive market expansion, supported by technological innovation in powertrain and battery systems.
- Smart connectivity, lightweight designs, and expanded charging networks are key trends enhancing performance and user experience across multiple applications.
- Competitive strategies focus on product diversification, advanced engineering, and strategic partnerships, strengthening the positions of leading manufacturers in both recreational and commercial segments.
- North America leads with a 39.2% market share, supported by strong infrastructure and consumer adoption, while the battery electric segment dominates the market with the highest share due to cost efficiency and environmental benefits.
Access crucial information at unmatched prices!
Request your sample report today & start making informed decisions powered by Credence Research Inc.!
Download Sample
Market Segmentation Analysis:
By Propulsion Type
Battery Electric Vehicles (BEV) dominate the electric all-terrain vehicle market with a 57.8% share. The demand for BEVs is driven by their low maintenance, high energy efficiency, and strong regulatory support for zero-emission vehicles. Advancements in lithium-ion battery capacity and fast-charging infrastructure are boosting their adoption. The lightweight structure of BEVs also enhances vehicle range and performance, making them ideal for off-road applications in both recreational and commercial use cases. These benefits position BEVs as the leading propulsion segment in this market.
- For instance, DRR USA’s EV Safari 4×4 model runs on an 11 kW electric motor and offers a 50-mile range on a single charge (in standard conditions). The ATV can switch between 2WD and 4WD modes and includes differential lock for challenging terrain.
By Drive Type
All-wheel Drive (AWD) holds the dominant position with a 49.6% market share. This drive type ensures better traction and handling on challenging terrains, increasing its appeal among outdoor enthusiasts and utility users. The rising use of AWD systems in performance-focused ATVs improves stability and control, particularly in uneven or wet conditions. Manufacturers are integrating advanced torque vectoring systems and electronic differential controls to boost ride safety and power distribution efficiency. These advantages make AWD the preferred choice across both recreational and professional segments.
- For instance, Eco Charger’s Lithium POWER 4WD quad uses a bespoke 72 V lithium-ion battery pack and drives power through a selectable 4WD shaft-driven chassis with lockable front differential.
By Vehicle Speed
The 100 MPH to 125 MPH segment leads the market with a 46.2% share. This speed range offers a strong balance between performance, energy efficiency, and safety, making it suitable for a wide user base. Growing consumer demand for powerful yet manageable ATVs supports this segment’s dominance. Manufacturers are optimizing aerodynamic designs, advanced motor control units, and regenerative braking systems to enhance performance. This speed range is increasingly favored in adventure sports, agriculture, and defense applications, driving consistent growth in the segment.
Key Growth Drivers
Rising Adoption of Sustainable Mobility
The shift toward eco-friendly transportation boosts electric ATV demand. Consumers and governments favor zero-emission vehicles to reduce carbon footprints. Electric ATVs offer low noise levels, reduced maintenance, and improved energy efficiency. Incentives, tax rebates, and green infrastructure investments enhance market adoption. Off-road enthusiasts and businesses are shifting from ICE to electric options for sustainability goals. This transition supports environmental policies and long-term cost savings, strengthening market growth and technological upgrades in the segment.
- For instance, Polaris’ RANGER XP Kinetic UTV (leveraged in its powersports electrification) uses a 14.9 kWh lithium-ion battery in its Premium trim and delivers an estimated 45 mile range in true AWD/2WD/VersaTrac Turf mode.
Advancements in Battery and Powertrain Technologies
Modern battery systems improve range, charging speed, and overall ATV performance. Lightweight lithium-ion batteries extend ride time and reduce operational costs. Improved motor efficiency enhances torque and acceleration in tough terrains. Companies are investing in R&D to boost energy density and safety. Faster charging infrastructure and modular battery packs increase user convenience. These developments make electric ATVs more practical for recreational and utility use, driving rapid market expansion in multiple regions.
- For instance, Daymak’s Beast ATV Ultimate, featuring a 2,000 W AWD system with twin 1,000 W electric motors, was offered with a standard lithium-ion battery providing a range of approximately 100 km.
Expanding Off-Road Recreational Activities
Growing interest in outdoor and adventure tourism drives the electric ATV market. Parks, resorts, and adventure trails are integrating electric ATVs for eco-conscious visitors. Low operating costs and minimal noise make them ideal for protected areas. Rental and tourism operators prefer electric models to meet regulatory standards and enhance customer experience. Expanding off-road infrastructure in North America, Europe, and Asia Pacific creates strong commercial opportunities. This expansion directly accelerates adoption among both individual buyers and fleet operators.
Key Trends & Opportunities
Integration of Smart and Connected Features
Manufacturers are adding GPS, Bluetooth, and IoT sensors to improve rider experience. Connected ATVs allow remote diagnostics, ride tracking, and predictive maintenance. These features enhance safety and performance monitoring. Integration with mobile apps enables navigation and performance analytics. Fleet managers can optimize usage, reduce downtime, and track energy consumption. This shift toward connected ATVs creates opportunities for premium offerings and subscription-based services.
- For instance, Alterra 600 EPS features a 600 cc, liquid-cooled single-cylinder engine paired with a CVTech transmission offering high and low ranges plus reverse.
Expansion of Commercial and Military Applications
Electric ATVs are increasingly used in defense, logistics, and agriculture. Their quiet operation, reduced heat signature, and low maintenance costs make them suitable for tactical and remote operations. Farms and construction sites deploy ATVs for efficient, eco-friendly mobility. Defense organizations are testing electric ATVs for stealth missions and transport in rugged areas. This diversification beyond recreational use opens new revenue streams and supports market stability.
- For instance, Theron’s Reever ATV was developed as an all-electric platform, featuring a 52 kW electric motor. The company offered a larger 20 kWh battery pack option, which could enable a maximum range of up to 180 km under ideal conditions.
Growth in Charging Infrastructure and Partnerships
Public and private investments are improving charging network coverage. Outdoor activity hubs and recreational parks are adding fast chargers to support electric ATVs. OEMs are forming partnerships with energy firms to integrate solar-based charging stations. These developments reduce range anxiety and boost user confidence. Enhanced infrastructure also supports fleet operators and rental services, creating a scalable growth path for the industry.
Key Challenges
High Initial Cost of Electric ATVs
Electric ATVs often cost more than conventional models due to battery and motor expenses. The upfront investment can deter budget-sensitive customers and small businesses. Limited access to financing further slows adoption in developing markets. Although operating costs are lower over time, initial pricing remains a barrier. Manufacturers face pressure to balance innovation with cost competitiveness to attract broader customer segments.
Limited Range and Charging Accessibility
Range limitations and sparse charging points restrict long-distance or extended off-road use. Many adventure locations lack reliable charging infrastructure. Riders may face delays or logistical issues during recreational or commercial activities. Battery performance can also degrade in extreme terrain or temperatures. These factors reduce customer confidence and slow widespread adoption, especially in regions with underdeveloped EV infrastructure.
Regional Analysis
North America
North America dominates the global electric ATV market with a 39.2% share. Strong consumer interest in outdoor recreational activities drives steady adoption. The U.S. leads due to advanced charging infrastructure and early technology adoption. Supportive state incentives and tax credits boost vehicle sales. Major manufacturers operate extensive dealer networks, improving product accessibility. Canada also sees rising demand from tourism and agricultural sectors. Expanding off-road parks and rental services strengthen market penetration. This region continues to set standards for product innovation, performance, and environmental compliance in the electric ATV industry.
Europe
Europe holds a 27.6% share of the global electric ATV market. The region benefits from strict emission regulations and strong sustainability goals. Countries like Germany, France, and the Nordics lead in eco-friendly mobility programs. Expanding off-road trails and tourism infrastructure support vehicle usage growth. EU incentives and tax rebates encourage consumers and commercial operators to shift from ICE to electric models. Advancements in battery technology further boost efficiency and range. European manufacturers focus on integrating smart connectivity, improving product performance, and meeting evolving regulatory requirements, reinforcing the region’s strong market position.
Asia Pacific
Asia Pacific accounts for 22.4% of the global electric ATV market. China, Japan, and Australia lead adoption with rising eco-tourism, agricultural modernization, and technology integration. Government subsidies and infrastructure investments accelerate the shift to electric mobility. Expanding off-road adventure tourism creates new market opportunities. Local manufacturers offer cost-effective models that increase accessibility in rural and semi-urban areas. Battery production capacity in China also drives price competitiveness. Rapid urbanization and environmental regulations further enhance market growth, making Asia Pacific one of the fastest-growing regions for electric ATVs.
Latin America
Latin America captures an 8.1% share of the global electric ATV market. Growth is supported by rising adventure tourism in Brazil, Argentina, and Chile. Limited but expanding charging infrastructure enables early adoption in recreational and agricultural sectors. Favorable import policies and partnerships with global OEMs improve product availability. Adventure parks and eco-tourism destinations are key demand drivers. While the market remains in its early stages, ongoing investments in EV infrastructure and affordability initiatives create strong potential for rapid growth in the coming years.
Middle East & Africa
The Middle East & Africa region holds a 2.7% share of the global electric ATV market. Market growth is driven by rising eco-tourism and government diversification strategies. Countries such as the UAE and South Africa are promoting electric mobility to reduce emissions. Desert and safari tourism encourage the use of silent, low-maintenance vehicles. Infrastructure development remains limited but is steadily improving through public-private initiatives. OEMs are forming partnerships with local distributors to expand reach. Although still developing, this region offers strong potential for future adoption through tourism and government-supported clean energy programs.
Market Segmentations:
By Propulsion Type:
- Battery Electric Vehicle (BEV)
- Plug-in Hybrid Electric vehicle (PHEV)
By Derive Type:
- Front-wheel Drive (FWD)
- Rear-wheel Drive (RWD)
By Vehicle Speed:
- Less Than 100 MPH
- 100MPH to 125MPH
By Geography
- North America
- Europe
- Germany
- France
- U.K.
- Italy
- Spain
- Rest of Europe
- Asia Pacific
- China
- Japan
- India
- South Korea
- South-east Asia
- Rest of Asia Pacific
- Latin America
- Brazil
- Argentina
- Rest of Latin America
- Middle East & Africa
- GCC Countries
- South Africa
- Rest of the Middle East and Africa
Competitive Landscape
The competitive landscape of the Electric All Terrain Vehicle Market features key players such as DRR USA, Eco Charger, Polaris Inc., Daymak Inc., Powerland, Artic Cat Inc., Theron, Tesla, Inc., Eco Rider, and BRP. The Electric All Terrain Vehicle Market is shaped by strong technological innovation and strategic expansion. Leading manufacturers focus on developing high-performance electric powertrains, longer battery life, and faster charging capabilities. Companies are investing in R&D to enhance vehicle range, improve torque delivery, and optimize off-road performance. Partnerships with charging infrastructure providers strengthen product accessibility in remote and recreational areas. Many players are also integrating smart connectivity features, enabling real-time diagnostics and fleet management solutions. Competitive strategies emphasize sustainable production, cost efficiency, and product differentiation to gain a strong foothold in both recreational and commercial segments.
Shape Your Report to Specific Countries or Regions & Enjoy 30% Off!
Key Player Analysis
- DRR USA
- Eco Charger
- Polaris Inc.
- Daymak Inc.
- Powerland
- Artic Cat Inc.
- Theron
- Tesla, Inc.
- Eco Rider
- BRP
Recent Developments
- In April 2025, Sheffield Financial and Polaris Inc. extended their retail financing partnership, upgrading dealer pre-qualification tools to accelerate approvals on new and pre-owned Polaris products.
- In March 2025, Polaris Inc. unveiled its 2026 snowmobile lineup, adding Voyageur work-and-play models, limited-edition PRO RMK trims, and an expanded TITAN series, with SnowCheck customization running through March 2025.
- In November 2024, Gravton Motors launched Quanta, an all-terrain electric motorcycle featuring advanced Lithium Manganese Iron Phosphate (LMFP) battery technology. Quanta is designed for both urban and rural commuting, showcasing a range of up to 130 kilometers on a single charge and the capability to reach 80% charge in just 90 minutes using a standard 3-pin socket.
- In April 2024, NexGen Energia, an e-mobility company headquartered in Noida, India introduced a cost-effective electric two-wheeler. This unveiling signifies a significant stride towards enhancing the accessibility and affordability of EVs
Report Coverage
The research report offers an in-depth analysis based on Propulsion Type, Derive Type, Vehicle Speed and Geography. It details leading market players, providing an overview of their business, product offerings, investments, revenue streams, and key applications. Additionally, the report includes insights into the competitive environment, SWOT analysis, current market trends, as well as the primary drivers and constraints. Furthermore, it discusses various factors that have driven market expansion in recent years. The report also explores market dynamics, regulatory scenarios, and technological advancements that are shaping the industry. It assesses the impact of external factors and global economic changes on market growth. Lastly, it provides strategic recommendations for new entrants and established companies to navigate the complexities of the market.
Future Outlook
- The market will grow with rising demand for eco-friendly off-road mobility solutions.
- Advancements in battery technology will extend vehicle range and reduce charging time.
- Expansion of charging infrastructure will boost recreational and commercial adoption.
- Smart connectivity features will enhance rider safety and performance monitoring.
- Governments will support market growth through subsidies and green mobility policies.
- Manufacturers will invest more in lightweight materials to improve efficiency.
- Tourism and adventure sports will remain strong demand drivers worldwide.
- Fleet electrification in agriculture and defense will create new revenue streams.
- Partnerships with energy providers will improve charging accessibility in remote areas.
- Continuous product innovation will strengthen competition and market penetration.


