Home » Semiconductor & Electronics » Fiber Optic Sensors Market

Fiber Optic Sensors Market By Product Type (Intrinsic Fiber Optic Sensors, Extrinsic Fiber Optic Sensors), By Material (Plastic, Glass), By End-user (Industrial, Oil & Gas, Energy & Utilities, Healthcare, Automotive & Transportation and Defense) – Growth, Future Prospects & Competitive Analysis, 2018 – 2026

Price: $4999

Published: | Report ID: 6420 | Report Format : PDF

The fiber optic sensors market is driven by strong demand from the oil and gas industry.

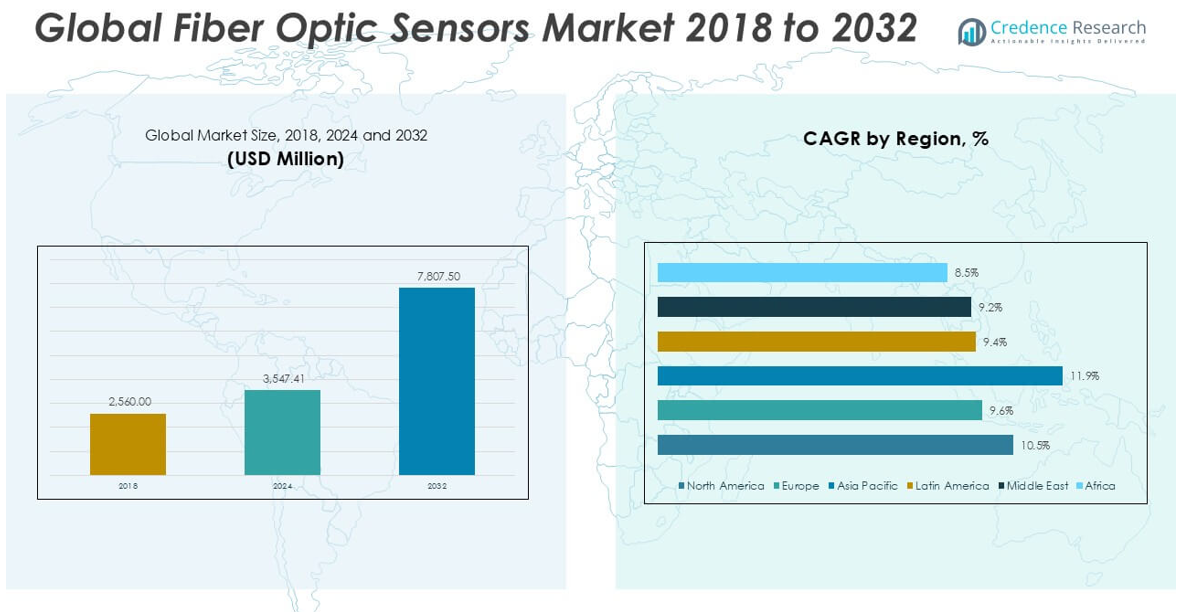
Fiber optic sensors have offered a viable solution for various industry verticals, including industrial manufacturing and processing, oil and gas, energy and utilities, transportation, healthcare, and others. Some of the key benefits offered by fiber optic sensors include ease of installation, distributed measurements all along the fiber length, and cost-effectiveness. Such sensors are widely deployed for measuring temperature, chemical composition, pressure, acoustics, and strain. The sensors are further connected to an appropriate data infrastructure, which enables the processing of the measurements in order to draw insights from them. Due to their small size and capability to function in harsh environments, the market is set to continue witnessing robust growth over the forecast period. All these factors are expected to contribute to a compounded annual growth rate (CAGR) of 10.1% during the forecast period of 2018–2026.

Market Synopsis

Intrinsic Fiber Optic Sensors to Remain the Largest Segment

In 2017, the intrinsic fiber optic sensors segment led the overall market, contributing to more than 2/3 of the global market value. Intrinsic fiber optic sensors are more sensitive as compared to their extrinsic counterparts. These sensors have an all-fiber design, which further reduces the issues related to connection (as opposed to extrinsic sensors). Furthermore, intrinsic fiber optic sensors are more versatile and robust than extrinsic sensors, making them the preferred choice for the majority of harsh environment applications. As a result, despite the higher cost, the intrinsic fiber optic sensors segment would continue to dominate the market during the forecast period.

Consistent Need for Design Enhancement to Ensure a Competitive Market

Some of the major fiber optic sensor companies profiled in the report include ABB Ltd., Halliburton Co., Fiso Technologies, Inc., OMRON Corporation, OmniSens S.A., Opsens Oil and Gas, Deltex Medical Group PLC, Finisar Corporation, and Sumitomo Electric Industries Ltd. Other major players covered in the report are Luna Innovations Inc., Ziebel AS, OptaSense (QinetiQ Company), AP Sensing GmbH, Pepperl+Fuchs GmbH, Petrospec Engineering Inc., Schlumberger Ltd., AFL Group, SCHOTT AG, TE Connectivity, and others.

Design Element 2

Access crucial information at unmatched prices!

Request your free sample report today & start making informed decisions powered by Credence Research!

Download Free Sample
CTA Design Element 3

Periods of History and Forecast

This research report presents the analysis of each segment from 2016 to 2026, considering 2017 as the base year for the research. The compound annual growth rate (CAGR) for each of the respective segments was calculated for the forecast period from 2018 to 2026.

Report Scope by Segments

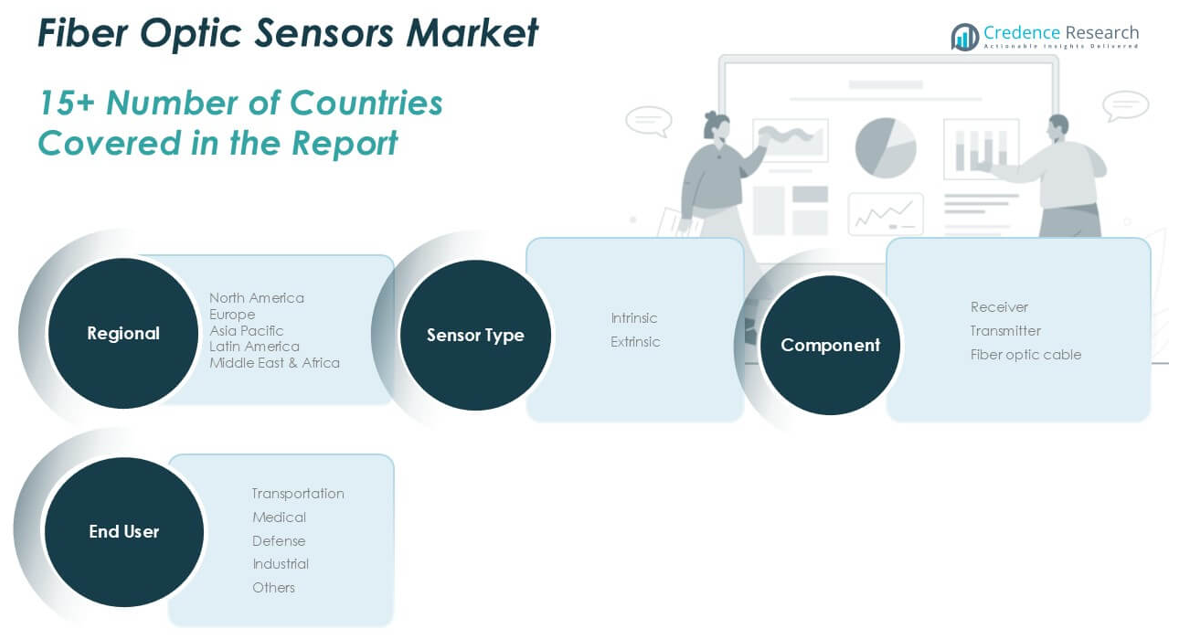
The fiber optic sensors market report provides market size and estimates based on market dynamics and key trends observed in the industry. The report provides a holistic view of the global fiber optic sensors market based on product type, material, end-user, and geography.

Shape Your Report to Specific Countries or Regions & Enjoy 30% Off!

Key questions are answered in this report.

  • What was the market size of fiber optic sensors in 2017, and what is the forecast up to 2026?
  • Which is the largest regional market for fiber optic sensors?
  • What are the major trends followed in overall sensors and fiber optic sensors across different regions?
  • Who are the key fiber optic sensor companies leading the market?
  • What are the key strategies adopted by the leading fiber optic sensor companies in the market?

This report’s distinct data points

  • Statistics on the industrial and oil and gas sectors worldwide
  • Recent trends across different regions in terms of the adoption of fiber optic sensors across different industry verticals
  • Attractive investment propositions for end-users, product type segments, and geography
  • Comparative scenario for all the segments for years 2017 (actual) and 2026 (forecast)

Chapter 1 Preface
1.1 Report Scope and Description
1.1.1 Study Purpose
1.1.2 Target Audience
1.1.3 USP and Key Offerings
1.2 Research Scope
1.3 Research Methodology
1.3.1 Phase I – Secondary Research
1.3.2 Phase II – Primary Research
1.3.3 Approach Adopted
1.3.4 Top-Down Approach
1.3.5 Bottom-Up Approach
1.3.6 Phase III – Expert Panel Review
1.3.7 Assumptions
1.4 Market Segmentation

Chapter 2 Executive Summary
2.1 Market Snapshot: Global FOS Market
2.1.1 Global FOS Market, by Product Type, 2017 (US$ Mn)
2.1.2 Global FOS Market, by Material, 2017 (US$ Mn)
2.1.3 Global FOS Market, by End-user, 2017 (US$ Mn)
2.1.4 Global FOS Market, by Geography, 2017 (US$ Mn)

Chapter 3 Market Dynamics
3.1 Introduction
3.2 Market Dynamics
3.2.1 Market Drivers
3.2.1.1 Rising Industrial Manufacturing & Processing Sector Worldwide
3.2.1.2 Steadily Growing Oil & Gas Industry Worldwide
3.2.1.3 Superior Benefits and Convenient Designs
3.2.2 Market Restraint
3.2.2.1 Established Conventional Sensors Market
3.3 Attractive Investment Proposition, by Geography, 2017
3.4 Market Positioning of Key Fiber Optic Sensors Vendors, 2017

Chapter 4 Global Fiber Optic Sensors (FOS) Market, by Product Type
4.1 Overview
4.1.1 Global FOS Market Value Share, by Product Type, 2017 & 2026 (Value, %)
4.2 Intrinsic Fiber Optic Sensors
4.2.1 Global Intrinsic FOS Market Value, 2016 – 2026 (US$ Mn)
4.3 Extrinsic Fiber Optic Sensors
4.3.1 Global Extrinsic FOS Market Value, 2016 – 2026 (US$ Mn)

Chapter 5 Global Fiber Optic Sensors (FOS) Market, by Material
5.1 Overview
5.1.1 Global FOS Market Value Share, by Material, 2017 & 2026 (Value, %)
5.2 Glass Fiber Optic Sensors
5.2.1 Global Glass FOS Market Value, 2016 – 2026 (US$ Mn)
5.3 Plastic Fiber Optic Sensors
5.3.1 Global Plastic FOS Market Value, 2016 – 2026 (US$ Mn)

Chapter 6 Global Fiber Optic Sensors (FOS) Market, by End-user
6.1 Overview
6.1.1 Global FOS Market Value Share, by End-user, 2017 & 2026 (Value, %)
6.2 Industrial Manufacturing & Processing
6.2.1 Global FOS Market Value from Industrial Manufacturing & Processing, 2016 – 2026 (US$ Mn)
6.3 Oil & Gas
6.3.1 Global FOS Market Value from Oil & Gas, 2016 – 2026 (US$ Mn)
6.4 Energy & Utilities
6.4.1 Global FOS Market Value from Energy & Utilities, 2016 – 2026 (US$ Mn)
6.5 Healthcare
6.5.1 Global FOS Market Value from Healthcare, 2016 – 2026 (US$ Mn)
6.6 Automotive & Transportation
6.6.1 Global FOS Market Value from Automotive & Transportation, 2016 – 2026 (US$ Mn)
6.7 Defense
6.7.1 Global FOS Market Value from Defense, 2016 – 2026 (US$ Mn)

Chapter 7 North America Fiber Optic Sensors (FOS) Market Analysis, 2016 – 2026 (US$ Mn)
7.1 Overview
7.2 North America FOS Market Analysis, by Product Type, 2016 – 2026 (US$ Mn)
7.2.1 Market Analysis
7.3 North America FOS Market Analysis, by Material, 2016 – 2026 (US$ Mn)
7.3.1 Market Analysis
7.4 North America FOS Market Analysis, by End-user, 2016 – 2026 (US$ Mn)
7.4.1 Market Analysis
7.5 North America FOS Market, by Country, 2016 – 2026 (US$ Mn)
7.5.1 Market Analysis
7.5.2 U.S.
7.5.2.1 U.S. FOS Market Value, by Product Type, 2016 – 2026 (US$ Mn)
7.5.2.2 U.S. FOS Market Value, by Material, 2016 – 2026 (US$ Mn)
7.5.2.3 U.S. FOS Market Value, by End-user, 2016 – 2026 (US$ Mn)
7.5.3 Rest of North America
7.5.3.1 Rest of North America FOS Market Value, by Product Type, 2016 – 2026 (US$ Mn)
7.5.3.2 Rest of North America FOS Market Value, by Material, 2016 – 2026 (US$ Mn)
7.5.3.3 Rest of North America FOS Market Value, by End-user, 2016 – 2026 (US$ Mn)

Chapter 8 Europe Fiber Optic Sensors (FOS) Market Analysis, 2016 – 2026 (US$ Mn)
8.1 Overview
8.2 Europe FOS Market Analysis, by Product Type, 2016 – 2026 (US$ Mn)
8.2.1 Market Analysis
8.3 Europe FOS Market Analysis, by Material, 2016 – 2026 (US$ Mn)
8.3.1 Market Analysis
8.4 Europe FOS Market Analysis, by End-user, 2016 – 2026 (US$ Mn)
8.4.1 Market Analysis
8.5 Europe FOS Market, by Country, 2016 – 2026 (US$ Mn)
8.5.1 Market Analysis
8.5.2 U.K.
8.5.2.1 U.K. FOS Market Value, by Product Type, 2016 – 2026 (US$ Mn)
8.5.2.2 U.K. FOS Market Value, by Material, 2016 – 2026 (US$ Mn)
8.5.2.3 U.K. FOS Market Value, by End-user, 2016 – 2026 (US$ Mn)
8.5.3 Germany
8.5.3.1 Germany FOS Market Value, by Product Type, 2016 – 2026 (US$ Mn)
8.5.3.2 Germany FOS Market Value, by Material, 2016 – 2026 (US$ Mn)
8.5.3.3 Germany FOS Market Value, by End-user, 2016 – 2026 (US$ Mn)
8.5.4 France
8.5.4.1 France FOS Market Value, by Product Type, 2016 – 2026 (US$ Mn)
8.5.4.2 France FOS Market Value, by Material, 2016 – 2026 (US$ Mn)
8.5.4.3 France FOS Market Value, by End-user, 2016 – 2026 (US$ Mn)
8.5.5 Rest of Europe
8.5.5.1 Rest of Europe FOS Market Value, by Product Type, 2016 – 2026 (US$ Mn)
8.5.5.2 Rest of Europe FOS Market Value, by Material, 2016 – 2026 (US$ Mn)
8.5.5.3 Rest of Europe FOS Market Value, by End-user, 2016 – 2026 (US$ Mn)

Chapter 9 Asia Pacific Fiber Optic Sensors (FOS) Market Analysis, 2016 – 2026 (US$ Mn)
9.1 Overview
9.2 Asia Pacific FOS Market Analysis, by Product Type, 2016 – 2026 (US$ Mn)
9.2.1 Market Analysis
9.3 Asia Pacific FOS Market Analysis, by Material, 2016 – 2026 (US$ Mn)
9.3.1 Market Analysis
9.4 Asia Pacific FOS Market Analysis, by End-user, 2016 – 2026 (US$ Mn)
9.4.1 Market Analysis
9.5 Asia Pacific FOS Market, by Country, 2016 – 2026 (US$ Mn)
9.5.1 Market Analysis
9.5.2 China
9.5.2.1 China FOS Market Value, by Product Type, 2016 – 2026 (US$ Mn)
9.5.2.2 China FOS Market Value, by Material, 2016 – 2026 (US$ Mn)
9.5.2.3 China FOS Market Value, by End-user, 2016 – 2026 (US$ Mn)
9.5.3 Japan
9.5.3.1 Japan FOS Market Value, by Product Type, 2016 – 2026 (US$ Mn)
9.5.3.2 Japan FOS Market Value, by Material, 2016 – 2026 (US$ Mn)
9.5.3.3 Japan FOS Market Value, by End-user, 2016 – 2026 (US$ Mn)
9.5.4 India
9.5.4.1 India FOS Market Value, by Product Type, 2016 – 2026 (US$ Mn)
9.5.4.2 India FOS Market Value, by Material, 2016 – 2026 (US$ Mn)
9.5.4.3 India FOS Market Value, by End-user, 2016 – 2026 (US$ Mn)
9.5.5 Rest of Asia Pacific
9.5.5.1 Rest of Asia Pacific FOS Market Value, by Product Type, 2016 – 2026 (US$ Mn)
9.5.5.2 Rest of Asia Pacific FOS Market Value, by Material, 2016 – 2026 (US$ Mn)
9.5.5.3 Rest of Asia Pacific FOS Market Value, by End-user, 2016 – 2026 (US$ Mn)

Chapter 10 Rest of the World (RoW) Fiber Optic Sensors (FOS) Market Analysis, 2016 – 2026 (US$ Mn)
10.1 Overview
10.2 RoW FOS Market Analysis, by Product Type, 2016 – 2026 (US$ Mn)
10.2.1 Market Analysis
10.3 RoW FOS Market Analysis, by Material, 2016 – 2026 (US$ Mn)
10.3.1 Market Analysis
10.4 RoW FOS Market Analysis, by End-user, 2016 – 2026 (US$ Mn)
10.4.1 Market Analysis
10.5 RoW FOS Market, by Region (US$ Mn)
10.5.1 Market Analysis
10.5.2 Middle East & Africa (MEA)
10.5.2.1 MEA FOS Market Value, by Product Type, 2016 – 2026 (US$ Mn)
10.5.2.2 MEA FOS Market Value, by Material, 2016 – 2026 (US$ Mn)
10.5.2.3 MEA FOS Market Value, by End-user, 2016 – 2026 (US$ Mn)
10.5.3 Latin America
10.5.3.1 Latin America FOS Market Value, by Product Type, 2016 – 2026 (US$ Mn)
10.5.3.2 Latin America FOS Market Value, by Material, 2016 – 2026 (US$ Mn)
10.5.3.3 Latin America FOS Market Value, by End-user, 2016 – 2026 (US$ Mn)

Chapter 11 Company Profiles
11.1 ABB Ltd.
11.2 AFL Group
11.3 AP Sensing GmbH
11.4 Deltex Medical Group PLC
11.5 Finisar Corporation
11.6 Fiso Technologies, Inc.
11.7 Halliburton CO
11.8 Luna Innovations Inc.
11.9 OmniSens S.A.
11.10 OMRON Corporation
11.11 Opsens, Inc.
11.12 OptaSense (QinetiQ Company)
11.13 Pepperl+Fuchs GmbH
11.14 Petrospec Engineering Inc.
11.15 Schlumberger Ltd.
11.16 SCHOTT AG
11.17 Sumitomo Electric Industries Ltd.
11.18 TE Connectivity
11.19 Ziebel AS

List Of Figures

FIG. 1 Global Fiber Optic Sensors (FOS) Market: Research Methodology
FIG. 2 Market Size Estimation – Top Down & Bottom up Approach
FIG. 3 Global FOS Market Segmentation
FIG. 4 Global FOS Market, by Product Type, 2017 (US$ Mn)
FIG. 5 Global FOS Market, by Material, 2017 (US$ Mn)
FIG. 6 Global FOS Market, by End-user, 2017 (US$ Mn)
FIG. 7 Global FOS Market, by Geography, 2017 (US$ Mn)
FIG. 8 Attractive Investment Proposition, by Geography, 2017
FIG. 9 Market Positioning of Key Fiber Optic Sensors Vendors, 2017
FIG. 10 Global FOS Market Value Share, by Product Type, 2017 & 2026 (Value, %)
FIG. 11 Global Intrinsic FOS Market Value, 2016 – 2026 (US$ Mn)
FIG. 12 Global Extrinsic FOS Market Value, 2016 – 2026 (US$ Mn)
FIG. 13 Global FOS Market Value Share, by Material, 2017 & 2026 (Value, %)
FIG. 14 Global Glass FOS Market Value, 2016 – 2026 (US$ Mn)
FIG. 15 Global Plastic FOS Market Value, 2016 – 2026 (US$ Mn)
FIG. 16 Global FOS Market Value Share, by End-user, 2017 & 2026 (Value, %)
FIG. 17 Global FOS Market Value from Industrial Manufacturing & Processing, 2016 – 2026 (US$ Mn)
FIG. 18 Global FOS Market Value from Oil & Gas, 2016 – 2026 (US$ Mn)
FIG. 19 Global FOS Market Value from Energy & Utilities, 2016 – 2026 (US$ Mn)
FIG. 20 Global FOS Market Value from Healthcare, 2016 – 2026 (US$ Mn)
FIG. 21 Global FOS Market Value from Automotive & Transportation, 2016 – 2026 (US$ Mn)
FIG. 22 Global FOS Market Value from Defense, 2016 – 2026 (US$ Mn)

List of Tables

TABLE 1 Market Snapshot: Global Fiber Optic Sensors (FOS) Market Value
TABLE 2 North America FOS Market Value, by Product Type, 2016 – 2026 (US$ Mn)
TABLE 3 North America FOS Market Value, by Material, 2016 – 2026 (US$ Mn)
TABLE 4 North America FOS Market Value, by End-user, 2016 – 2026 (US$ Mn)
TABLE 5 North America FOS Market Value, by Country, 2016 – 2026 (US$ Mn)
TABLE 6 U.S. FOS Market Value, by Product Type 2016 – 2026 (US$ Mn)
TABLE 7 U.S. FOS Market Value, by Material 2016 – 2026 (US$ Mn)
TABLE 8 U.S. FOS Market Value, by End-user 2016 – 2026 (US$ Mn)
TABLE 9 Rest of North America FOS Market Value, by Product Type 2016 – 2026 (US$ Mn)
TABLE 10 Rest of North America FOS Market Value, by Material 2016 – 2026 (US$ Mn)
TABLE 11 Rest of North America FOS Market Value, by End-user 2016 – 2026 (US$ Mn)
TABLE 12 Europe FOS Market Value, by Product Type, 2016 – 2026 (US$ Mn)
TABLE 13 Europe FOS Market Value, by Material, 2016 – 2026 (US$ Mn)
TABLE 14 Europe FOS Market Value, by End-user, 2016 – 2026 (US$ Mn)
TABLE 15 Europe FOS Market Value, by Country, 2016 – 2026 (US$ Mn)
TABLE 16 U.K. FOS Market Value, by Product Type 2016 – 2026 (US$ Mn)
TABLE 17 U.K. FOS Market Value, by Material 2016 – 2026 (US$ Mn)
TABLE 18 U.K. FOS Market Value, by End-user 2016 – 2026 (US$ Mn)
TABLE 19 Germany FOS Market Value, by Product Type 2016 – 2026 (US$ Mn)
TABLE 20 Germany FOS Market Value, by Material 2016 – 2026 (US$ Mn)
TABLE 21 Germany FOS Market Value, by End-user 2016 – 2026 (US$ Mn)
TABLE 22 France FOS Market Value, by Product Type 2016 – 2026 (US$ Mn)
TABLE 23 France FOS Market Value, by Material 2016 – 2026 (US$ Mn)
TABLE 24 France FOS Market Value, by End-user 2016 – 2026 (US$ Mn)
TABLE 25 Rest of Europe FOS Market Value, by Product Type 2016 – 2026 (US$ Mn)
TABLE 26 Rest of Europe FOS Market Value, by Material 2016 – 2026 (US$ Mn)
TABLE 27 Rest of Europe FOS Market Value, by End-user 2016 – 2026 (US$ Mn)
TABLE 28 Asia Pacific FOS Market Value, by Product Type, 2016 – 2026 (US$ Mn)
TABLE 29 Asia Pacific FOS Market Value, by Material, 2016 – 2026 (US$ Mn)
TABLE 30 Asia Pacific FOS Market Value, by End-user, 2016 – 2026 (US$ Mn)
TABLE 31 Asia Pacific FOS Market Value, by Country, 2016 – 2026 (US$ Mn)
TABLE 32 China FOS Market Value, by Product Type 2016 – 2026 (US$ Mn)
TABLE 33 China FOS Market Value, by Material 2016 – 2026 (US$ Mn)
TABLE 34 China FOS Market Value, by End-user 2016 – 2026 (US$ Mn)
TABLE 35 Japan FOS Market Value, by Product Type 2016 – 2026 (US$ Mn)
TABLE 36 Japan FOS Market Value, by Material 2016 – 2026 (US$ Mn)
TABLE 37 Japan FOS Market Value, by End-user 2016 – 2026 (US$ Mn)
TABLE 38 India FOS Market Value, by Product Type 2016 – 2026 (US$ Mn)
TABLE 39 India FOS Market Value, by Material 2016 – 2026 (US$ Mn)
TABLE 40 India FOS Market Value, by End-user 2016 – 2026 (US$ Mn)
TABLE 41 Rest of Asia Pacific FOS Market Value, by Product Type 2016 – 2026 (US$ Mn)
TABLE 42 Rest of Asia Pacific FOS Market Value, by Material 2016 – 2026 (US$ Mn)
TABLE 43 Rest of Asia Pacific FOS Market Value, by End-user 2016 – 2026 (US$ Mn)
TABLE 44 RoW FOS Market Value, by Product Type, 2016 – 2026 (US$ Mn)
TABLE 45 RoW FOS Market Value, by Material, 2016 – 2026 (US$ Mn)
TABLE 46 RoW FOS Market Value, by End-user, 2016 – 2026 (US$ Mn)
TABLE 47 RoW FOS Market Value, by Country, 2016 – 2026 (US$ Mn)
TABLE 48 MEA FOS Market Value, by Product Type 2016 – 2026 (US$ Mn)
TABLE 49 MEA FOS Market Value, by Material 2016 – 2026 (US$ Mn)
TABLE 50 MEA FOS Market Value, by End-user 2016 – 2026 (US$ Mn)
TABLE 51 Latin America FOS Market Value, by Product Type 2016 – 2026 (US$ Mn)
TABLE 52 Latin America FOS Market Value, by Material 2016 – 2026 (US$ Mn)
TABLE 53 Latin America FOS Market Value, by End-user 2016 – 2026 (US$ Mn)
TABLE 54 ABB Ltd.: Company Snapshot (Business Description; Product Portfolio; Financial Information; Business Overview and Recent Development)
TABLE 55 AFL Group: Company Snapshot (Business Description; Product Portfolio; Financial Information; Business Overview and Recent Development)
TABLE 56 AP Sensing GmbH: Company Snapshot (Business Description; Product Portfolio; Financial Information; Business Overview and Recent Development)
TABLE 57 Deltex Medical Group PLC: Company Snapshot (Business Description; Product Portfolio; Financial Information; Business Overview and Recent Development)
TABLE 58 Finisar Corporation: Company Snapshot (Business Description; Product Portfolio; Financial Information; Business Overview and Recent Development)
TABLE 59 Fiso Technologies, Inc.: Company Snapshot (Business Description; Product Portfolio; Financial Information; Business Overview and Recent Development)
TABLE 60 Halliburton CO: Company Snapshot (Business Description; Product Portfolio; Financial Information; Business Overview and Recent Development)
TABLE 61 Luna Innovations Inc.: Company Snapshot (Business Description; Product Portfolio; Financial Information; Business Overview and Recent Development)
TABLE 62 OmniSens S.A.: Company Snapshot (Business Description; Product Portfolio; Financial Information; Business Overview and Recent Development)
TABLE 63 OMRON Corporation: Company Snapshot (Business Description; Product Portfolio; Financial Information; Business Overview and Recent Development)
TABLE 64 Opsens, Inc.: Company Snapshot (Business Description; Product Portfolio; Financial Information; Business Overview and Recent Development)
TABLE 65 OptaSense (QinetiQ Company): Company Snapshot (Business Description; Product Portfolio; Financial Information; Business Overview and Recent Development)
TABLE 66 Pepperl+Fuchs GmbH: Company Snapshot (Business Description; Product Portfolio; Financial Information; Business Overview and Recent Development)
TABLE 67 Petrospec Engineering Inc.: Company Snapshot (Business Description; Product Portfolio; Financial Information; Business Overview and Recent Development)
TABLE 68 Schlumberger Ltd.: Company Snapshot (Business Description; Product Portfolio; Financial Information; Business Overview and Recent Development)
TABLE 69 SCHOTT AG: Company Snapshot (Business Description; Product Portfolio; Financial Information; Business Overview and Recent Development)
TABLE 70 Sumitomo Electric Industries Ltd.: Company Snapshot (Business Description; Product Portfolio; Financial Information; Business Overview and Recent Development)
TABLE 71 TE Connectivity: Company Snapshot (Business Description; Product Portfolio; Financial Information; Business Overview and Recent Development)
TABLE 72 Ziebel AS: Company Snapshot (Business Description; Product Portfolio; Financial Information; Business Overview and Recent Development)

Frequently Asked Questions:

What is the size of Fiber Optic Sensors Market?

The market for Fiber Optic Sensors Market is expected to reach US$ XX Mn by 2026.

What is the Fiber Optic Sensors Market CAGR?

The Fiber Optic Sensors Market is expected to see significant CAGR growth over the coming years, at 10.1%.

What is the Forecast period considered for Fiber Optic Sensors Market?

The report is forecasted from 2018-2026.

What is the base year considered for Fiber Optic Sensors Market?

The base year of this report is 2017.

Who are the major players in this market?

Deltex Medical Group PLC, Finisar Corporation, and Sumitomo Electric Industries Ltd. Other major players covered in the report are Luna Innovations Inc., Ziebel AS, OptaSense (QinetiQ Company), AP Sensing GmbH, Pepperl+Fuchs GmbH, Petrospec Engineering Inc., Schlumberger Ltd are some of the major players in the global market.

Electrical Computer-Aided Design (ECAD) Market

Published:
Report ID: 36638

Fiber Optics Market

Published:
Report ID: 36367

Field Programmable Gate Array (FPGA) Market

Published:
Report ID: 36359

Electronic Contract Manufacturing and Design Services Market

Published:
Report ID: 36355

Battery Energy Storage System Market

Published:
Report ID: 36352

Laptop Market

Published:
Report ID: 36318

Fiber Optic Preform Market

Published:
Report ID: 36286

Commercial Display Market

Published:
Report ID: 36262

Vibration Control System Market

Published:
Report ID: 36259

Semiconductor Memory Market

Published:
Report ID: 36250

North America Industrial Valve Market

Published:
Report ID: 36223

Flip Chip Market

Published:
Report ID: 36203

Purchase Options

$2999
Delivery Format: Excel.
$4999
Designed for the individual purchaser.
$6999
Users located at a single corporate site or regional office.
$7999
Allowed for unlimited sharing globally within one company.
Smallform of Sample request

Have a question?

User Profile

Don’t settle for less – trust Mitul to help you find the best solution.

Report delivery within 24 to 48 hours

– Other Info –

What people say?-

User Review

I am very impressed with the information in this report. The author clearly did their research when they came up with this product and it has already given me a lot of ideas.

Jana Schmidt
CEDAR CX Technologies

– Connect with us –

Phone

+91 6232 49 3207


support

24/7 Research Support


sales@credenceresearch.com

– Research Methodology –

Going beyond the basics: advanced techniques in research methodology

– Trusted By –

Pepshi, LG, Nestle
Motorola, Honeywell, Johnson and johnson
LG Chem, SIEMENS, Pfizer
Unilever, Samsonite, QIAGEN