Market Overview
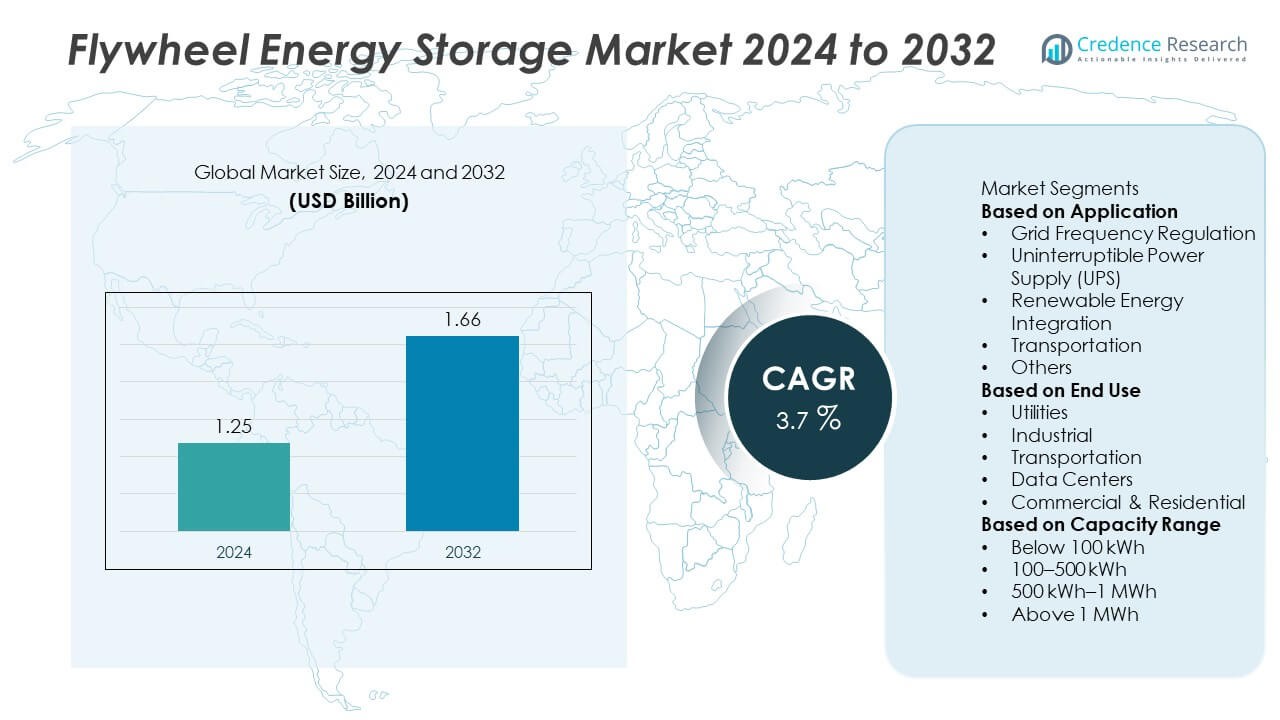
The Flywheel Energy Storage Market was valued at USD 1.25 billion in 2024 and is projected to reach USD 1.66 billion by 2032, growing at a CAGR of 3.7% during the forecast period.
| REPORT ATTRIBUTE |
DETAILS |
| Historical Period |
2020-2023 |
| Base Year |
2024 |
| Forecast Period |
2025-2032 |
| Flywheel Energy Storage Market Size 2024 |
USD 1.25 Billion |
| Flywheel Energy Storage Market, CAGR |
3.7% |
| Flywheel Energy Storage Market Size 2032 |
USD 1.66 Billion |
The Flywheel Energy Storage Market is driven by leading players including Amber Kinetics, Inc., Beacon Power, LLC, Stornetic GmbH, Langley Holdings plc, Kinetic Traction Systems, Inc., VYCON, Inc., PUNCH Flybrid, Energiestro, Bc New Energy (Tianjin) Co., Ltd. (BNE), and Temporal Power Ltd. These companies are advancing high-speed flywheel technologies, composite rotor designs, and hybrid energy systems to enhance performance and efficiency. North America led the market with a 37% share in 2024, supported by large-scale renewable integration and grid stabilization projects. Europe followed with 30%, driven by strong sustainability initiatives and clean energy regulations. Asia-Pacific accounted for 25%, emerging as the fastest-growing region due to industrial expansion and growing demand for cost-effective and reliable short-duration energy storage solutions.
Access crucial information at unmatched prices!
Request your sample report today & start making informed decisions powered by Credence Research Inc.!
Download Sample
Market Insights
- The Flywheel Energy Storage Market was valued at USD 1.25 billion in 2024 and is projected to reach USD 1.66 billion by 2032, growing at a CAGR of 3.7%.
- Rising demand for grid stability, renewable energy integration, and high-efficiency short-term energy storage is driving market expansion globally.
- Advancements in magnetic bearings, carbon fiber rotors, and hybrid systems are key trends improving durability and energy density.
- Leading companies such as Amber Kinetics, Beacon Power, Stornetic GmbH, and VYCON focus on modular, scalable designs and strategic collaborations with utilities and data centers.
- North America led with 37% share in 2024, followed by Europe at 30% and Asia-Pacific at 25%, while the 100–500 kWh capacity segment dominated with 46% share due to its optimal balance between performance and cost-effectiveness in medium-scale applications.
Market Segmentation Analysis:
By Application
The grid frequency regulation segment dominated the Flywheel Energy Storage Market with a 41% share in 2024. Its dominance is driven by the growing need for real-time power stabilization and grid balancing in renewable energy systems. Flywheels provide instantaneous response and high cycle durability, making them ideal for grid frequency support. Their ability to absorb and release energy rapidly enhances system reliability during fluctuations in power demand. Increasing integration of intermittent renewable sources such as solar and wind is further propelling demand for flywheel-based frequency regulation solutions across major power networks.
- For instance, Convergent Energy and Power operates a 20 MW flywheel plant in Stephentown, New York. The facility provides fast-response frequency regulation to the regional grid. It was originally built by Beacon Power with 200 flywheels capable of 25 kWh each and can achieve full power in less than four seconds.
By End Use
The utilities segment led the market with a 39% share in 2024, supported by large-scale adoption of energy storage for grid reliability and renewable power management. Utility operators prefer flywheels for their long operational life, minimal maintenance, and environmental safety. These systems enable efficient load leveling and frequency control in high-capacity grids. Industrial users are also expanding adoption for backup and power quality management. Government initiatives promoting grid modernization and renewable integration continue to boost investments in flywheel energy storage within the utility sector.
- For instance, Temporal Power partnered with NRStor to operate a 2 MW flywheel energy storage facility in Minto, Ontario, which uses 10 steel flywheels for grid regulation services. The system, commissioned in 2014, provides critical grid balancing for the Independent Electricity System Operator (IESO).
By Capacity Range
The 100–500 kWh capacity range segment accounted for a 46% share in 2024, making it the leading category in the Flywheel Energy Storage Market. This range provides an optimal balance between energy density, cost-efficiency, and operational performance, suitable for both grid and commercial applications. These systems are widely deployed in industrial facilities, data centers, and renewable power plants. Their modular scalability and high discharge efficiency make them well-suited for medium-scale storage applications. The increasing demand for flexible and sustainable mid-range storage solutions is driving segment growth across emerging energy networks.
Key Growth Drivers
Rising Demand for Grid Stability and Frequency Regulation
The increasing integration of renewable energy sources such as solar and wind has amplified the need for grid stability solutions. Flywheel energy storage systems deliver instantaneous response to frequency fluctuations, ensuring power quality and system reliability. Their ability to operate continuously with minimal degradation makes them ideal for high-cycle applications. As utilities modernize grids to handle fluctuating renewable inputs, the adoption of flywheel systems for frequency regulation and short-term energy balancing is expected to rise steadily over the forecast period.
- For instance, Stornetic deployed a flywheel storage unit at its site in Jülich, Germany, which was tested and evaluated for the municipal utility Stadtwerke München (SWM) to demonstrate its performance for grid applications.
Growing Adoption in Data Centers and Industrial Facilities
Data centers and industrial facilities are increasingly turning to flywheel energy storage systems for reliable power backup and energy efficiency. These systems provide seamless, short-duration energy supply during outages, preventing data loss and operational disruptions. Flywheels’ low maintenance and long lifecycle make them cost-effective alternatives to batteries in mission-critical operations. With rapid growth in cloud infrastructure and industrial automation, demand for uninterrupted and sustainable power solutions continues to fuel market expansion across developed and emerging economies.
- For instance, Active Power supplied over 4,000 CleanSource flywheel UPS systems worldwide, each capable of delivering 300 kW for 15 seconds to protect critical IT infrastructure. The company’s systems have accumulated more than 1.3 billion operating hours globally, demonstrating exceptional reliability in data center power continuity.
Technological Advancements in Materials and System Efficiency
Ongoing innovations in rotor materials, magnetic bearings, and power electronics are significantly enhancing flywheel performance. The introduction of lightweight carbon fiber composites has improved energy density and rotational speed, while advanced control systems optimize charge-discharge cycles. These technological upgrades reduce energy losses and operational costs, increasing the appeal of flywheel systems for both grid and commercial applications. Manufacturers are also integrating digital monitoring and predictive maintenance features, making modern flywheel solutions smarter and more efficient than ever.
Key Trends & Opportunities
Integration with Renewable and Hybrid Energy Systems
Flywheel energy storage systems are increasingly being integrated with renewable and hybrid microgrid setups to enhance reliability and sustainability. Their high cycling capability and fast charge-discharge rate complement intermittent renewable sources, stabilizing power output. As global energy systems shift toward decentralized and low-carbon models, hybrid installations combining flywheels with batteries or supercapacitors are emerging as viable energy management solutions. This trend offers significant opportunities for technology providers to expand across off-grid and renewable-dense regions.
- For instance, Amber Kinetics developed a 32 kWh flywheel system integrated with a hybrid solar microgrid in California, operating at a maximum continuous speed of 7,700 rpm with over 86% round-trip efficiency.
Expansion of Modular and Scalable Flywheel Systems
The development of modular and scalable flywheel designs is creating new opportunities in distributed energy applications. Modular systems allow easy capacity expansion and efficient space utilization in commercial or utility projects. These configurations reduce installation complexity and adapt to varying power demands, improving economic feasibility. The shift toward modularity supports cost reduction and operational flexibility, making flywheel systems increasingly attractive for microgrids, transportation hubs, and industrial energy storage installations.
- For instance, Piller Group’s POWERBRIDGE flywheel energy storage systems can store up to 60+ MJ per unit, and installations can be scaled for use in grid or data center applications. Each module operates with a design life of over 20 years and is built for high reliability, demonstrating strong adaptability in modular energy storage architectures.
Key Challenges
High Initial Investment and Capital Costs
Despite their long-term benefits, flywheel systems face adoption barriers due to high upfront costs associated with materials, installation, and infrastructure. Advanced components such as magnetic bearings and carbon fiber rotors increase manufacturing expenses. This cost challenge limits adoption, especially in developing regions where capital budgets are constrained. However, ongoing R&D and economies of scale are expected to gradually lower system costs, enhancing market accessibility in the coming years.
Limited Energy Storage Duration Compared to Batteries
One of the main limitations of flywheel systems is their relatively short energy retention period compared to chemical batteries. While flywheels excel in high-power, short-duration applications, they are less effective for long-term energy storage. This restricts their use in large-scale renewable integration where sustained power delivery is required. Manufacturers are addressing this limitation through hybrid configurations and improved rotor designs, but overcoming the intrinsic duration challenge remains a key focus for technological innovation in the market.
Regional Analysis
North America
North America held the largest share of 37% in the Flywheel Energy Storage Market in 2024. The region’s dominance is driven by strong adoption of renewable energy and increasing investments in grid modernization projects. The United States leads due to extensive deployment of flywheel systems for frequency regulation, data centers, and industrial backup applications. Supportive policies for sustainable energy storage and technological advancements in composite materials strengthen regional growth. Major manufacturers are also investing in pilot projects to enhance energy efficiency and reliability across smart grid infrastructure and decentralized power systems.
Europe
Europe accounted for 30% of the global Flywheel Energy Storage Market in 2024, supported by strict energy efficiency regulations and rapid renewable energy integration. Countries such as Germany, the United Kingdom, and France are leading adoption due to ongoing grid stabilization and energy transition initiatives. The European Union’s focus on carbon neutrality and clean technology deployment drives demand for high-performance energy storage systems. Regional manufacturers are developing lightweight, high-speed flywheels with improved energy retention, making Europe a key hub for innovation in sustainable energy storage and advanced grid management solutions.
Asia-Pacific
Asia-Pacific captured a 25% share of the Flywheel Energy Storage Market in 2024 and is expected to record the fastest growth through 2032. Rapid industrialization, growing electricity demand, and renewable energy expansion are fueling adoption. China, Japan, and South Korea are investing heavily in energy storage infrastructure, while India’s smart grid initiatives further support market growth. Increasing use of flywheels in hybrid renewable systems and transportation applications also strengthens regional presence. Government-backed sustainability goals and advancements in domestic manufacturing capabilities continue to boost adoption of flywheel energy storage technologies across Asia-Pacific.
Latin America
Latin America held a 5% share of the Flywheel Energy Storage Market in 2024, driven by the growing need for reliable backup power and renewable integration. Brazil and Mexico lead adoption as part of national efforts to enhance grid stability and reduce dependency on fossil fuels. Investments in energy storage pilot projects and regional manufacturing partnerships are supporting gradual market penetration. However, high initial costs and limited technological awareness constrain widespread deployment. Expanding renewable capacity and supportive government initiatives are expected to stimulate further growth across the region in the coming years.
Middle East & Africa
The Middle East & Africa accounted for a 3% share of the Flywheel Energy Storage Market in 2024. The region’s growth is supported by rising investments in renewable energy and smart city infrastructure. GCC countries, particularly Saudi Arabia and the UAE, are deploying flywheel systems to stabilize power supply and enhance grid reliability. In Africa, energy storage adoption remains at an early stage but is gaining attention for microgrid and off-grid applications. Increasing collaboration with international energy technology providers and government sustainability programs is expected to accelerate regional market expansion.
Market Segmentations:
By Application
- Grid Frequency Regulation
- Uninterruptible Power Supply (UPS)
- Renewable Energy Integration
- Transportation
- Others
By End Use
- Utilities
- Industrial
- Transportation
- Data Centers
- Commercial & Residential
By Capacity Range
- Below 100 kWh
- 100–500 kWh
- 500 kWh–1 MWh
- Above 1 MWh
By Geography
- North America
- Europe
- Germany
- France
- U.K.
- Italy
- Spain
- Rest of Europe
- Asia Pacific
- China
- Japan
- India
- South Korea
- South-east Asia
- Rest of Asia Pacific
- Latin America
- Brazil
- Argentina
- Rest of Latin America
- Middle East & Africa
- GCC Countries
- South Africa
- Rest of the Middle East and Africa
Competitive Landscape
The competitive landscape of the Flywheel Energy Storage Market features key players such as Amber Kinetics, Inc., Beacon Power, LLC, Stornetic GmbH, Langley Holdings plc, Kinetic Traction Systems, Inc., VYCON, Inc., PUNCH Flybrid, Energiestro, Bc New Energy (Tianjin) Co., Ltd. (BNE), and Temporal Power Ltd. These companies focus on improving energy density, system efficiency, and cost-effectiveness through advanced materials and magnetic bearing technologies. Leading manufacturers are investing in composite rotor designs and hybrid energy systems that integrate flywheels with batteries for enhanced performance. Strategic collaborations with utilities, renewable energy developers, and data center operators are strengthening market presence and application diversity. North American and European players emphasize grid stabilization and industrial use, while Asian manufacturers prioritize scalable and low-cost solutions. Continuous innovation in modular flywheel systems, long-life designs, and predictive monitoring technologies is driving competition and shaping the global evolution of high-performance energy storage solutions.
Shape Your Report to Specific Countries or Regions & Enjoy 30% Off!
Key Player Analysis
Recent Developments
- In May 2025, Amber Kinetics, Unveiled a containerized Flywheel Energy Storage System for above-ground deployment; announced testing at Miramar (planned H2 2025).
- In April 2025, PUNCH Flybrid Parent company Punch Powertrain published activity around Auto Shanghai 2025 (April 2025) and other 2025 product updates.
- In March 2025, Energiestro Tech press coverage (CompositesWorld, Mar 5, 2025) described Energiestro’s prototype approach using glass-fibre composites and prestressed concrete to lower flywheel costs-company remains active in R&D/low-cost structural approaches.
- In September 2024, Bc New Energy (Tianjin) Co., Ltd. (BNE) Reported as technology provider for China’s first large-scale grid-connected flywheel plant (30 MW) that was connected to the grid in mid-September 2024 (Shanxi / Changzhi project).
Report Coverage
The research report offers an in-depth analysis based on Application, End Use, Capacity Range and Geography. It details leading market players, providing an overview of their business, product offerings, investments, revenue streams, and key applications. Additionally, the report includes insights into the competitive environment, SWOT analysis, current market trends, as well as the primary drivers and constraints. Furthermore, it discusses various factors that have driven market expansion in recent years. The report also explores market dynamics, regulatory scenarios, and technological advancements that are shaping the industry. It assesses the impact of external factors and global economic changes on market growth. Lastly, it provides strategic recommendations for new entrants and established companies to navigate the complexities of the market.
Future Outlook
- Demand for flywheel energy storage will grow with increasing renewable energy integration.
- Advancements in composite materials will enhance energy density and system efficiency.
- Modular and hybrid flywheel systems will gain traction across grid and industrial sectors.
- Utilities will adopt flywheels for frequency regulation and short-term energy balancing.
- Data centers will expand use of flywheels for uninterrupted power and low-maintenance backup.
- Asia-Pacific will experience the fastest growth due to rapid industrialization and energy transition.
- Partnerships between technology developers and power companies will strengthen market presence.
- Cost reduction through material innovation will make flywheels more competitive with batteries.
- Governments will promote flywheel adoption under clean energy and grid modernization policies.
- Continuous innovation in digital monitoring and predictive maintenance will improve system reliability.



