Chinese supply sets the price as supplements add value
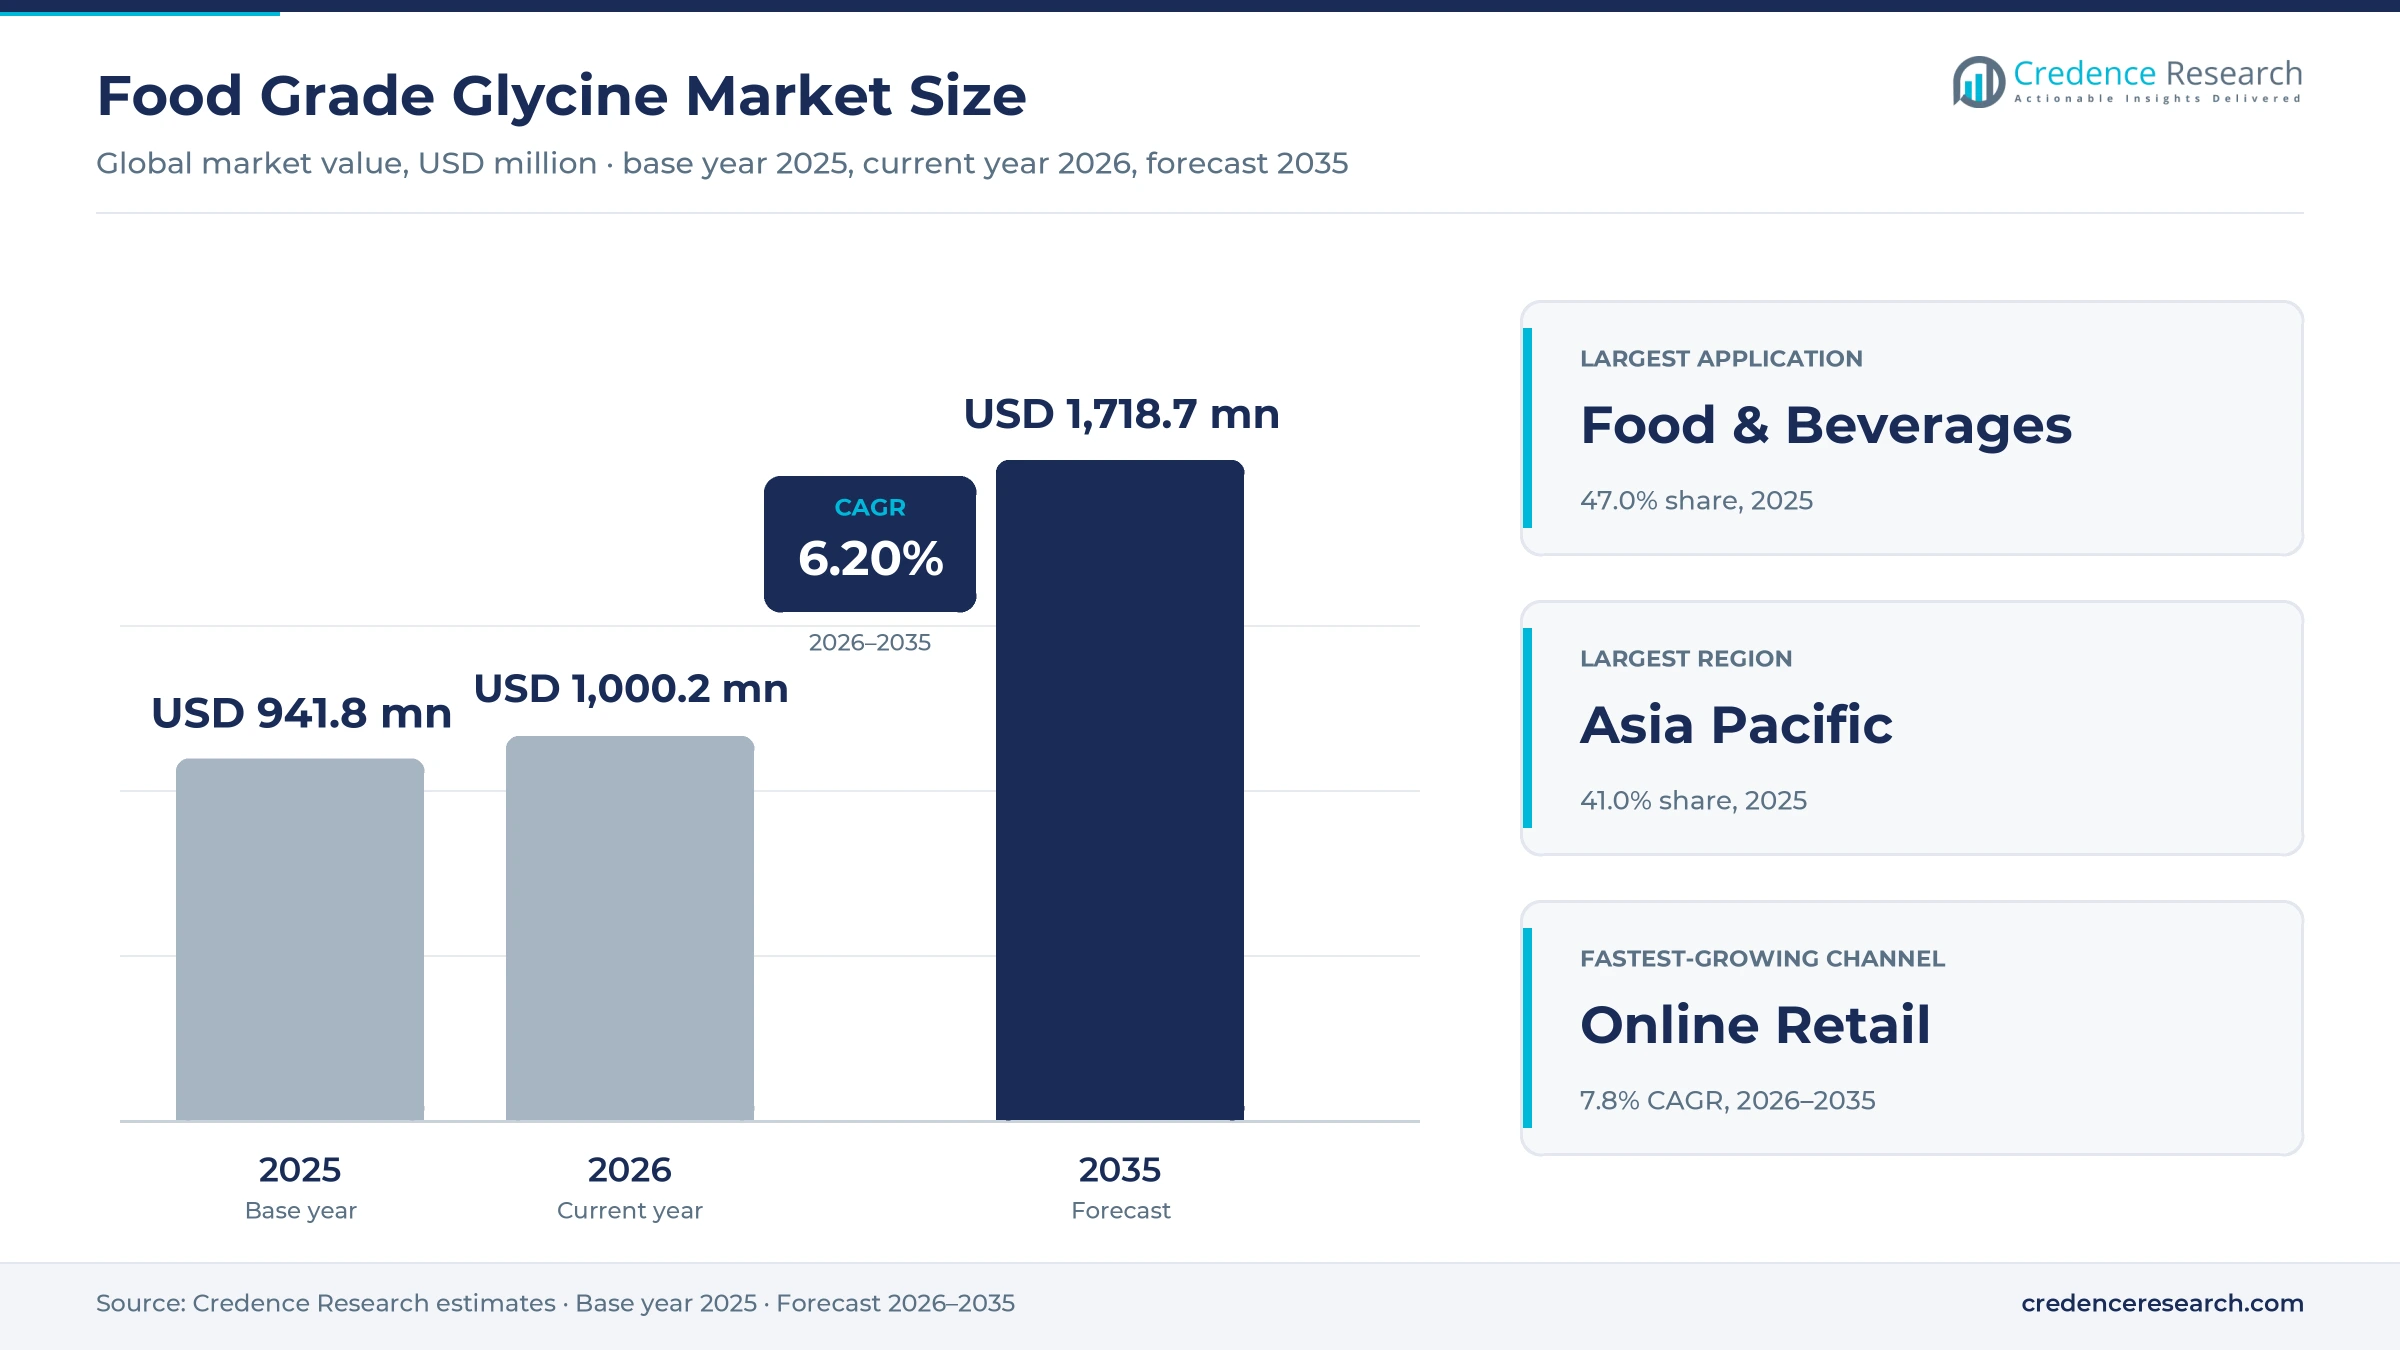
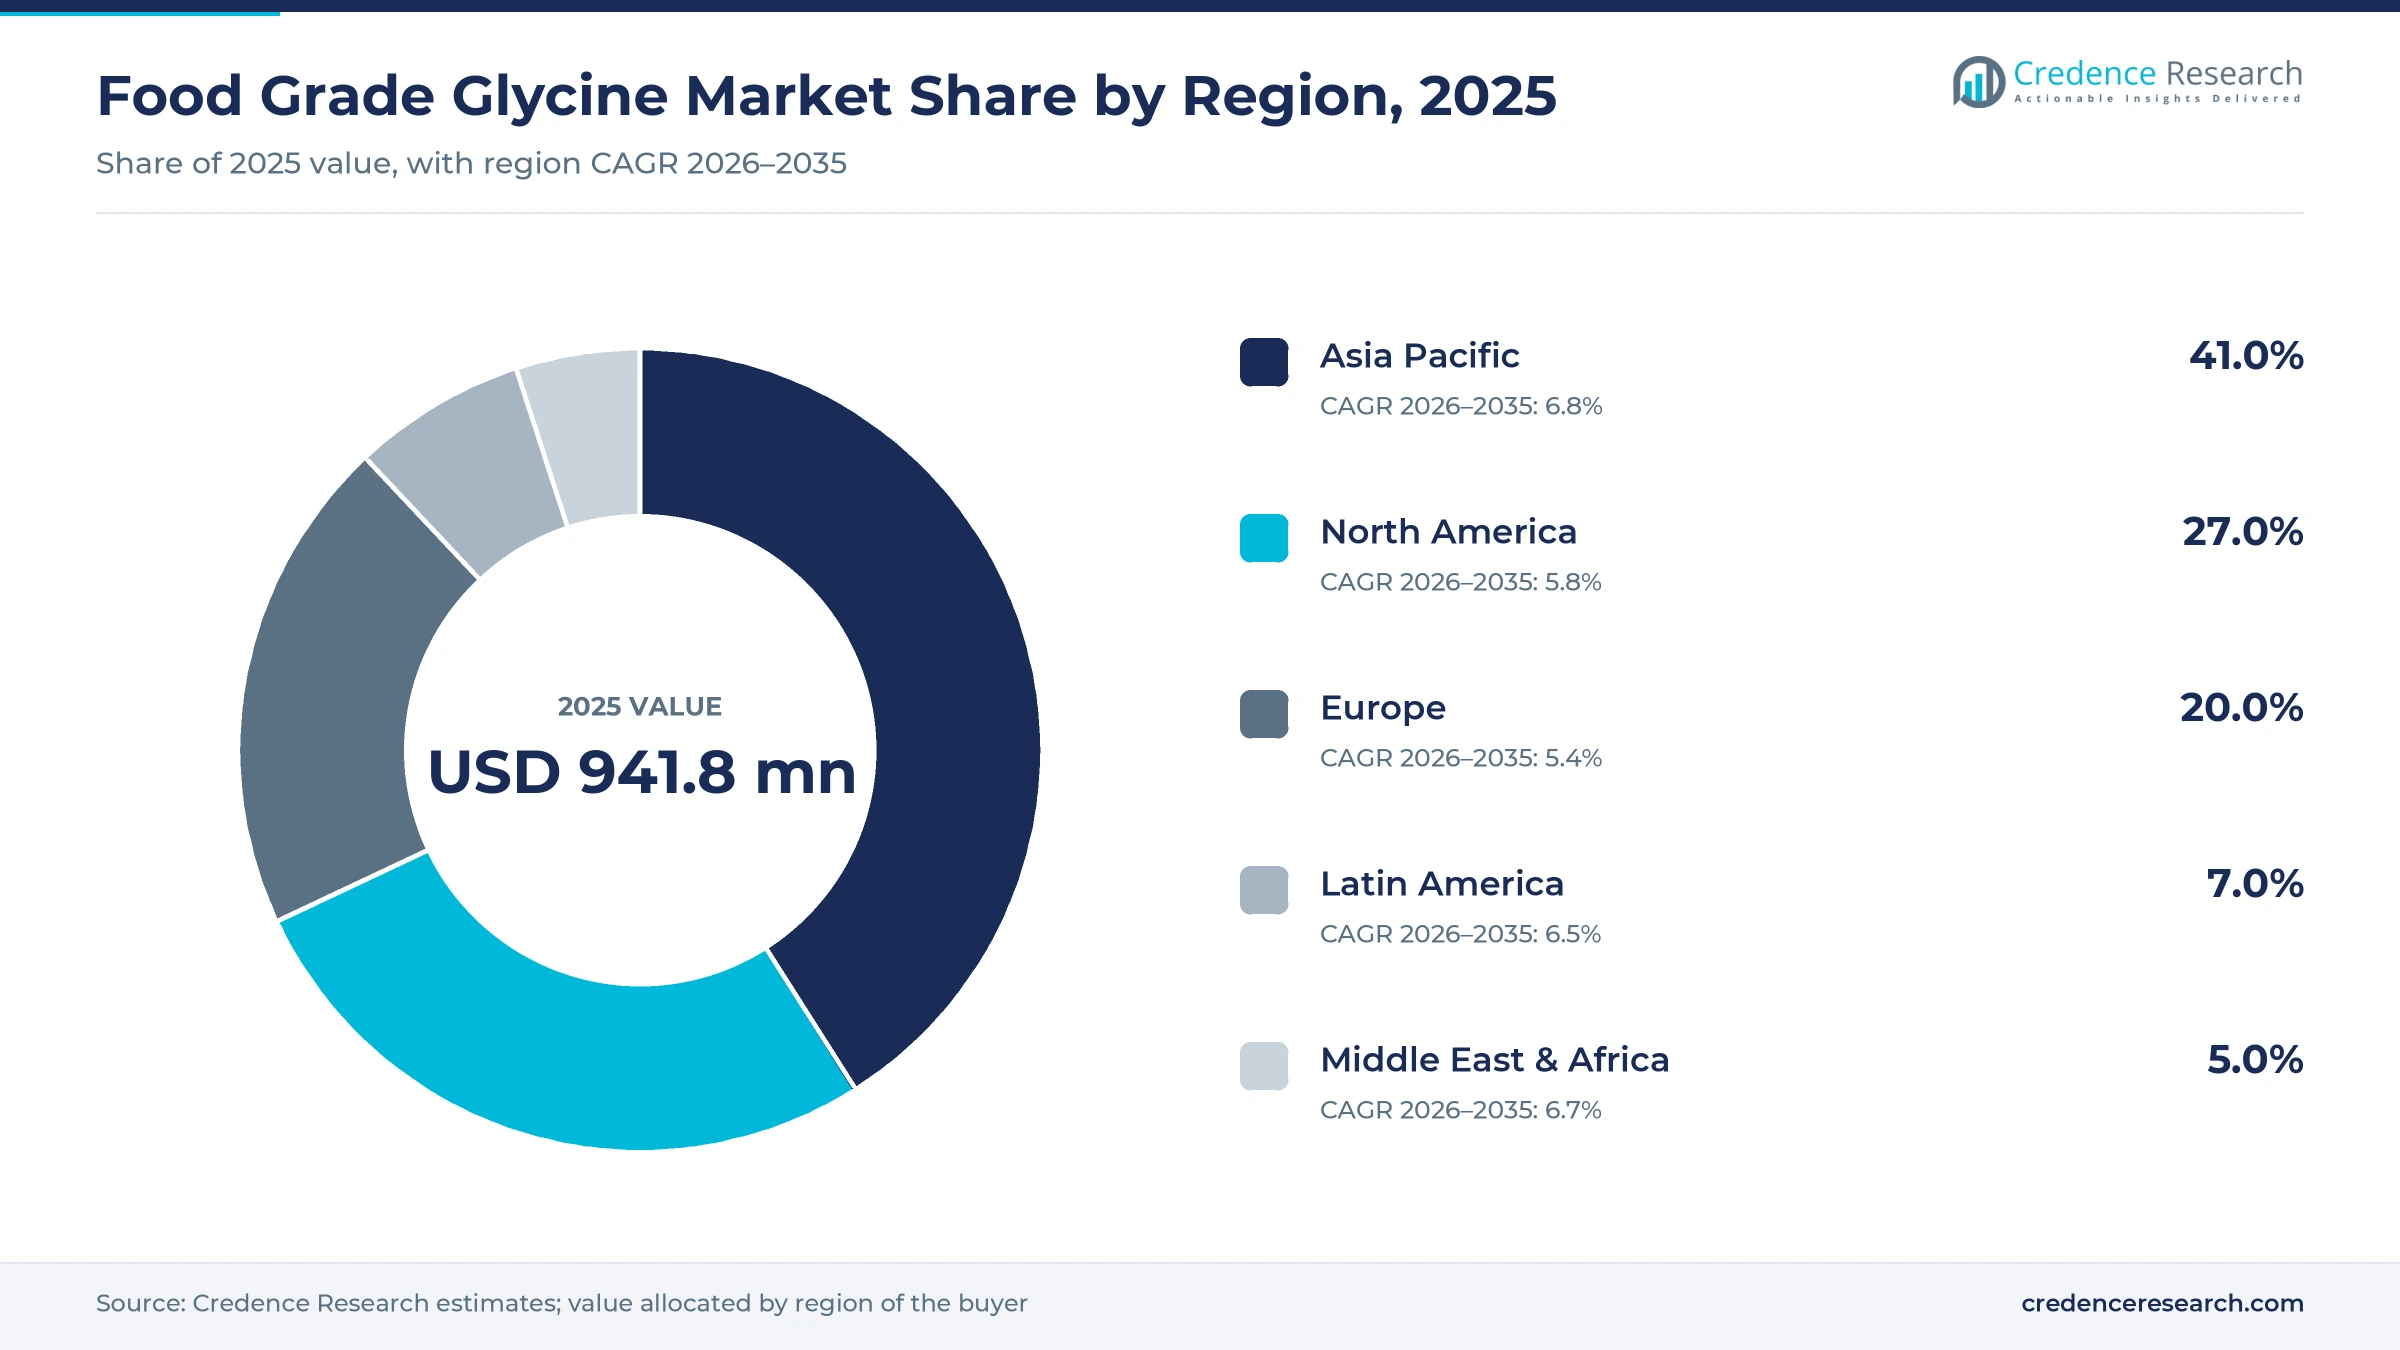
The global food grade glycine market was valued at USD 941.8 million in 2025 and is projected to increase from USD 1.00 billion in 2026 to USD 1.72 billion by 2035, registering a CAGR of 6.20% during 2026–2035. Most volume goes into seasonings, pickled and processed foods and beverage bases, where glycine adds sweetness and slows bacterial spoilage, while feed mills and supplement brands add the fastest-growing demand. Asia Pacific held the largest regional share, 41.0% in 2025, and is also the fastest-growing region at 6.8% a year, because China dominates production and Japan remains a large food user. North America follows with 27.0%, where antidumping and countervailing duty orders continued in November 2024 keep import prices above world levels. The main restraint is price, because Chinese plants built for glyphosate also make food-grade material and keep bulk offers near three dollars per kilogram.
Which buyers pay the most for each kilogram of glycine?
The market counts glycine sold to food, beverage, feed and supplement makers in grades that meet the Food Chemicals Codex, USP or EP and feed-additive specifications, valued at the ingredient price paid by the processor or brand. Seasoning and processed-food plants buy in 25-kilogram bags on annual contracts, while supplement brands buy smaller lots with tighter purity and testing files.
Injectable pharmaceutical grade and technical glycine for herbicide synthesis and metal finishing are excluded from the value, although they share plants with food-grade lines. The value chain runs from Strecker and chloroacetic acid synthesis plants in China, India and Japan through traders and ingredient distributors to food processors, feed mills and supplement brands that reprice the material many times over.
Food Grade Glycine Market Insights
- The market is projected to rise from USD 941.8 million in 2025 to USD 1.72 billion by 2035 at 6.20% a year, with supplement and feed uses adding the most new value.
- Asia Pacific held 41.0% of 2025 value and grows fastest at 6.8% a year, because China supplies most world volume and Japan uses it widely in food.
- Food & Beverages led the application split with 47.0% of 2025 value, as seasoning and shelf-life uses absorb most bulk tonnage.
- China supplied 53.8% of world export quantity in the glycine trade basket in 2023, up from 38.8% in 2018, according to the USITC.
- India opened an antidumping investigation into Chinese glycine on Sept. 22, 2026, covering every grade from feed to injectable.
Seasoning and preservation still take most volume
Why does food processing still take most glycine value?
Based on application, the market is categorized into food and beverages, animal feed and functional food and nutritional supplements. Food & Beverages led with 47.0% of 2025 value because processors use glycine as both a seasoning and a shelf-life tool, and Yuki Gosei states that glycine is about 70% as sweet as sugar and inhibits heat-resistant bacteria. Functional Food & Nutritional Supplements grow fastest at 7.1% a year, as a 3-gram bedtime dose improved sleep quality in a 2007 clinical study and brands now sell 3,000-milligram stick packs. Supplement brands gain pricing room, while bulk seasoning buyers keep pressing for lower prices.
Why does powder dominate glycine forms?
Based on form, the market is categorized into powder, granules and liquid. Powder led with 78.0% of 2025 value because seasoning blends, beverage bases and feed premixes all dose dry crystalline material, and NOW Foods sells its glycine as a pure powder with a 3-gram serving. Granules grow fastest at 6.9% a year, as capsule and tablet makers need free-flowing material for small doses, such as the 500-milligram AjiPure capsules Swanson lists at USD 6.49 for 60. Producers with sieving and granulation lines earn a premium, while liquid forms remain a niche for beverage plants.
How do buyers source glycine across channels?
Based on distribution channel, the market is categorized into direct sales, distributors and wholesalers, and online retail. Distributors/Wholesalers led with 48.0% of 2025 value because most food and supplement makers buy small lots from Chinese plants through traders that consolidate small orders and hold certificates of analysis. Online Retail grows fastest at 7.8% a year, as the Census Bureau put e-commerce at 17.1% of U.S. retail sales in the second quarter of 2026 and online stores such as Vitacost list glycine tubs. Distributors holding local stock and fast delivery gain, while direct sales stay with large accounts.
| Segment Group | Leading Sub-segment | Share, 2025 | Fastest-growing Sub-segment | CAGR, 2026–2035 |
|---|---|---|---|---|
| By Application | Food & Beverages | 47.0% | Functional Food & Nutritional Supplements | 7.1% |
| By Form | Powder | 78.0% | Granules | 6.9% |
| By Distribution Channel | Distributors/Wholesalers | 48.0% | Online Retail | 7.8% |
Retail glycine sells at ten times the bulk price
Bulk glycine is priced per kilogram on quarterly or annual contracts, and Chinese food-grade offers near three dollars set the floor for every other supplier. Japanese, U.S. and European producers charge more for FCC and USP documentation, traceability and steady supply, and the U.S. duty orders let domestic plants hold that premium. Price moves with chloroacetic acid and hydrogen cyanide costs, with glyphosate demand that absorbs the same Chinese capacity, and with trade cases. Supplement brands resell the same molecule at roughly ten times the bulk price, so most value is added after the ingredient leaves the plant.
| Offer or segment | Typical price or fee | Basis |
|---|---|---|
| Food-grade glycine, China FOB, 25 kg bags | USD 3.1-3.5 per kg | Echemi supplier listing, 2026 |
| Feed-grade glycine, bulk | USD 2.0-2.8 per kg | Credence Research estimate from China offers and feed premix margins |
| FCC or USP glycine made in Japan, the U.S. or Europe | USD 6-10 per kg | Credence Research estimate from duty-inclusive landed costs |
| Retail glycine powder, 454 g tub | USD 16.53 per tub | Vitacost list price for NOW Foods, November 2026 |
| Retail glycine capsules, 60 x 500 mg | USD 6.49 per bottle | Swanson list price, November 2026 |
Request a Free Sample
Fill in your details and we'll send you a free sample report.
- Sample data tables & charts
- Research methodology
Low-protein feed and sleep supplements widen demand
Low-protein broiler diets need added glycine
Poultry nutritionists are cutting crude protein to reduce feed cost and nitrogen output, and that shift makes glycine a limiting amino acid that must be added in purified form. A December 2024 Poultry Science study found that broilers on an 18% crude protein diet matched the 20% control when the digestible glycine plus serine to lysine ratio reached 134% to 137%. The EU authorized glycine as a feed additive for all animal species in February 2018, so mills can use it across species. EU Directive 2024/1785, in force since Aug. 4, 2024, also brings more pig and poultry farms under emission permits. Feed-grade suppliers and premix makers serving poultry feed formulators gain, while crude protein sellers lose volume.
Sleep supplements turn glycine into a branded ingredient
Supplement brands now sell glycine on its own for sleep, which moves part of demand from bulk seasoning prices to retail nutrition prices. A 2007 study in Sleep and Biological Rhythms reported that 3 grams of glycine before bedtime shortened the time to slow-wave sleep and improved subjective sleep quality. The user base is large, since the CDC found that 57.6% of U.S. adults used a dietary supplement in the past 30 days in 2017–2018, and 80.2% of women aged 60 and over did so. Ajinomoto sells its Glyna stick packs with 3,000 milligrams per serving. Producers with supplement documentation gain, while seasoning-only plants miss this premium.
Asian seasoning and preservation uses anchor volume
Food processors in Japan, China and Southeast Asia keep glycine in seasonings, pickles, noodles and ready meals because it does two jobs at a low price, rounding flavor and slowing bacterial growth. Yuki Gosei says glycine boosts umami with MSG and nucleotides and softens saltiness, sourness and bitterness. Japan exported 17.8 million pounds of glycine and related amino acids in 2023, of which 4.6 million went to the U.S., according to the USITC. In Europe, Annex III of Regulation 1333/2008 lists E 640 glycine at quantum satis as an additive in nutrient preparations, which keeps it in vitamin and mineral premixes. Processors replacing preservatives on clean labels favor it, and Japanese and Chinese producers with FCC certification gain repeat contracts from large seasoning makers.
Trade remedies lift prices for non-Chinese producers
Duty orders reroute supply and raise the landed price of imports, which protects domestic plants and favors exporters not covered by duties. The U.S. kept antidumping orders on India, Japan and Thailand and countervailing duty orders on India and China from Nov. 29, 2024, after the USITC review of November 2024. India in turn opened an antidumping case on Chinese glycine on Sept. 22, 2026, after Avid Organics, with 66% of Indian output, filed the complaint. USITC data show no U.S. imports of Thai glycine from 2020 to 2023, which left India and Japan as the main subject import sources. Deer Park Glycine, Chattem and Indian producers gain, while importers and small supplement brands carry the higher cost.
Trade remedies and low-carbon routes reshape supply
Western amino acid groups are narrowing their glycine focus
European amino acid makers are shifting toward high-purity pharmaceutical and medical nutrition grades and away from commodity volume, leaving bulk food-grade supply to Asian plants. Evonik announced on Oct. 11, 2024, that it would restructure its keto and pharma amino acid business, evaluating partnerships or a sale for its Ham, France and Wuming, China, sites. Indian Pharma Post reported in June 2026 that Evonik is selling selected Hanau pharmaceutical ingredient assets to ProChem, while REXIM amino acids continue at Ham and Wuming. Evonik markets REXIM glycine under ICH Q7 and food for special medical purposes standards. Buyers needing documented medical nutrition grades should expect fewer Western sources and longer qualification times.
CO2-based glycine routes are moving into research
Japanese producers are shifting toward lower-carbon glycine synthesis to meet customer emission targets, which creates openings for premium food and supplement grades that carry a carbon claim. Resonac, Nippon Steel and the University of Toyama were selected by NEDO on May 1, 2025, to research glycine made from CO2-derived methanol and hydrogen cyanide. The work runs from fiscal 2025 to fiscal 2027 and is still at the research stage, with no pilot plant announced. Resonac already makes acrylonitrile at Kawasaki, which supplies the cyanide route. A carbon claim matters most in export markets, since 4.6 million of Japan's 17.8 million pounds of glycine-basket exports in 2023 went to the U.S. The project helps Japanese suppliers defend premium pricing against Chinese offers, although no cost data have been published.
Feed-grade glycine in Asian broiler programs is an opening
Integrated broiler producers in Asia are an underserved customer group for feed-grade glycine, because low-protein diet trials now give them a tested dose and they buy at large scale. The same broiler study also produced a requirement model that lets nutritionists set glycine by body weight and daily gain. India exported 21.2 million pounds of glycine and related amino acids in 2023, of which 10.6 million went to the U.S. under the wider HS 2922.49 heading, according to the USITC, so South Asian plants already hold export capacity that could serve regional feed mills. Suppliers that pair feed-grade glycine with formulation support could win volume from soybean meal, although commercial amino acids such as lysine and threonine compete for the same budget.
Documented supplement grades are an opening in India and the Gulf
Supplement brands in India and the Gulf states are an opening for documented supplement-grade glycine, because regulators there check ingredient specifications and imported certificates closely. The investigation noted above covers imports from April 1, 2025, to March 31, 2026, and lists nine grades, from crude and feed material to EP, USP and injectable glycine, which signals that buyers are already comparing domestic and Chinese supply grade by grade. Indian producers can serve local brands without import duty risk and ship to Gulf importers at short freight distances, all the more since Commerce set preliminary U.S. margins of 57.17% for two Indian exporters in May 2026. Credence Research found no public statistic on Gulf glycine supplement sales, so the size of that opening remains an evidence gap that buyers should test with their own sell-through data.
Duties, use limits and thin margins restrain growth
Chinese capacity keeps bulk prices low
Chinese plants built for herbicide-grade glycine also make food grade, so spare capacity keeps bulk offers low. The USITC found that China's share of world export quantity in the glycine trade basket rose from 38.8% in 2018 to 53.8% in 2023. Producers in Japan, Europe and the U.S. are most exposed when glyphosate demand weakens and Chinese plants switch output to food grade. Purity documentation and reliable delivery are their main defense against this pressure.
Duty orders raise landed costs for importers
Duty orders raise the cost of imported glycine for U.S. food and supplement makers that cannot buy enough domestic material, and the rates are steep. Commerce applied a 227.17% antidumping rate to Newtrend Food Ingredient, the sole Thai respondent in the original case, according to the USITC. CBP also found Chinese glycine shipped through Indonesia, whose exports rose from 211,000 pounds in 2018 to 28.8 million pounds in 2023. Small supplement brands without long contracts are the most exposed.
Use limits cap glycine in U.S. beverages
U.S. food additive rules limit where glycine can be added directly, which restrains volume in beverages. Under 21 CFR 172.812, glycine may mask the aftertaste of saccharin at no more than 0.2% of a finished beverage and stabilize mono- and diglycerides at 0.02%. Beverage makers moving away from artificial sweeteners therefore remove one of glycine's legal uses. U.S. food demand depends more on supplements and flavor systems than on soft drinks.
Trade cases create supply uncertainty in India
Repeated trade cases make Indian glycine prices hard to plan, which hurts processors that sign annual supply contracts. India's Finance Ministry declined a DGTR recommendation for duties on Chinese glycine in January 2023, after Paras Intermediates and Avid Organics had applied. The new investigation noted above, filed by Avid Organics alone, keeps that uncertainty open into 2027. Food and feed makers relying on Chinese supply are most exposed until a decision is made.
Asia Pacific leads on production and food use
Regional demand follows where glycine is made, where food processors use it as a seasoning and where supplement and feed buyers pay for documented grades. Regional shares and growth rates are Credence Research estimates built from trade and production data.
| Region | Value, 2025 (USD million) | Share, 2025 | CAGR, 2026–2035 |
|---|---|---|---|
| Asia Pacific | 386.1 | 41.0% | 6.8% |
| North America | 254.3 | 27.0% | 5.8% |
| Europe | 188.4 | 20.0% | 5.4% |
| Latin America | 65.9 | 7.0% | 6.5% |
| Middle East & Africa | 47.1 | 5.0% | 6.7% |
Asia Pacific leads on Chinese supply and Japanese food use
Asia Pacific held 41.0% of 2025 value and is the fastest-growing region at 6.8% a year, because the region both makes and eats most food-grade glycine. Hebei Donghua Jiheng in Hengshui sells pharma, food, fodder and technical grades to USP, FCC, BP and EP standards. Yuki Gosei markets glycine to Japanese food makers as a seasoning, sweetening and shelf-life ingredient. India adds supplement demand and local plants, and the pending antidumping case may shift Indian purchases toward domestic producers.
North America pays duty-protected prices
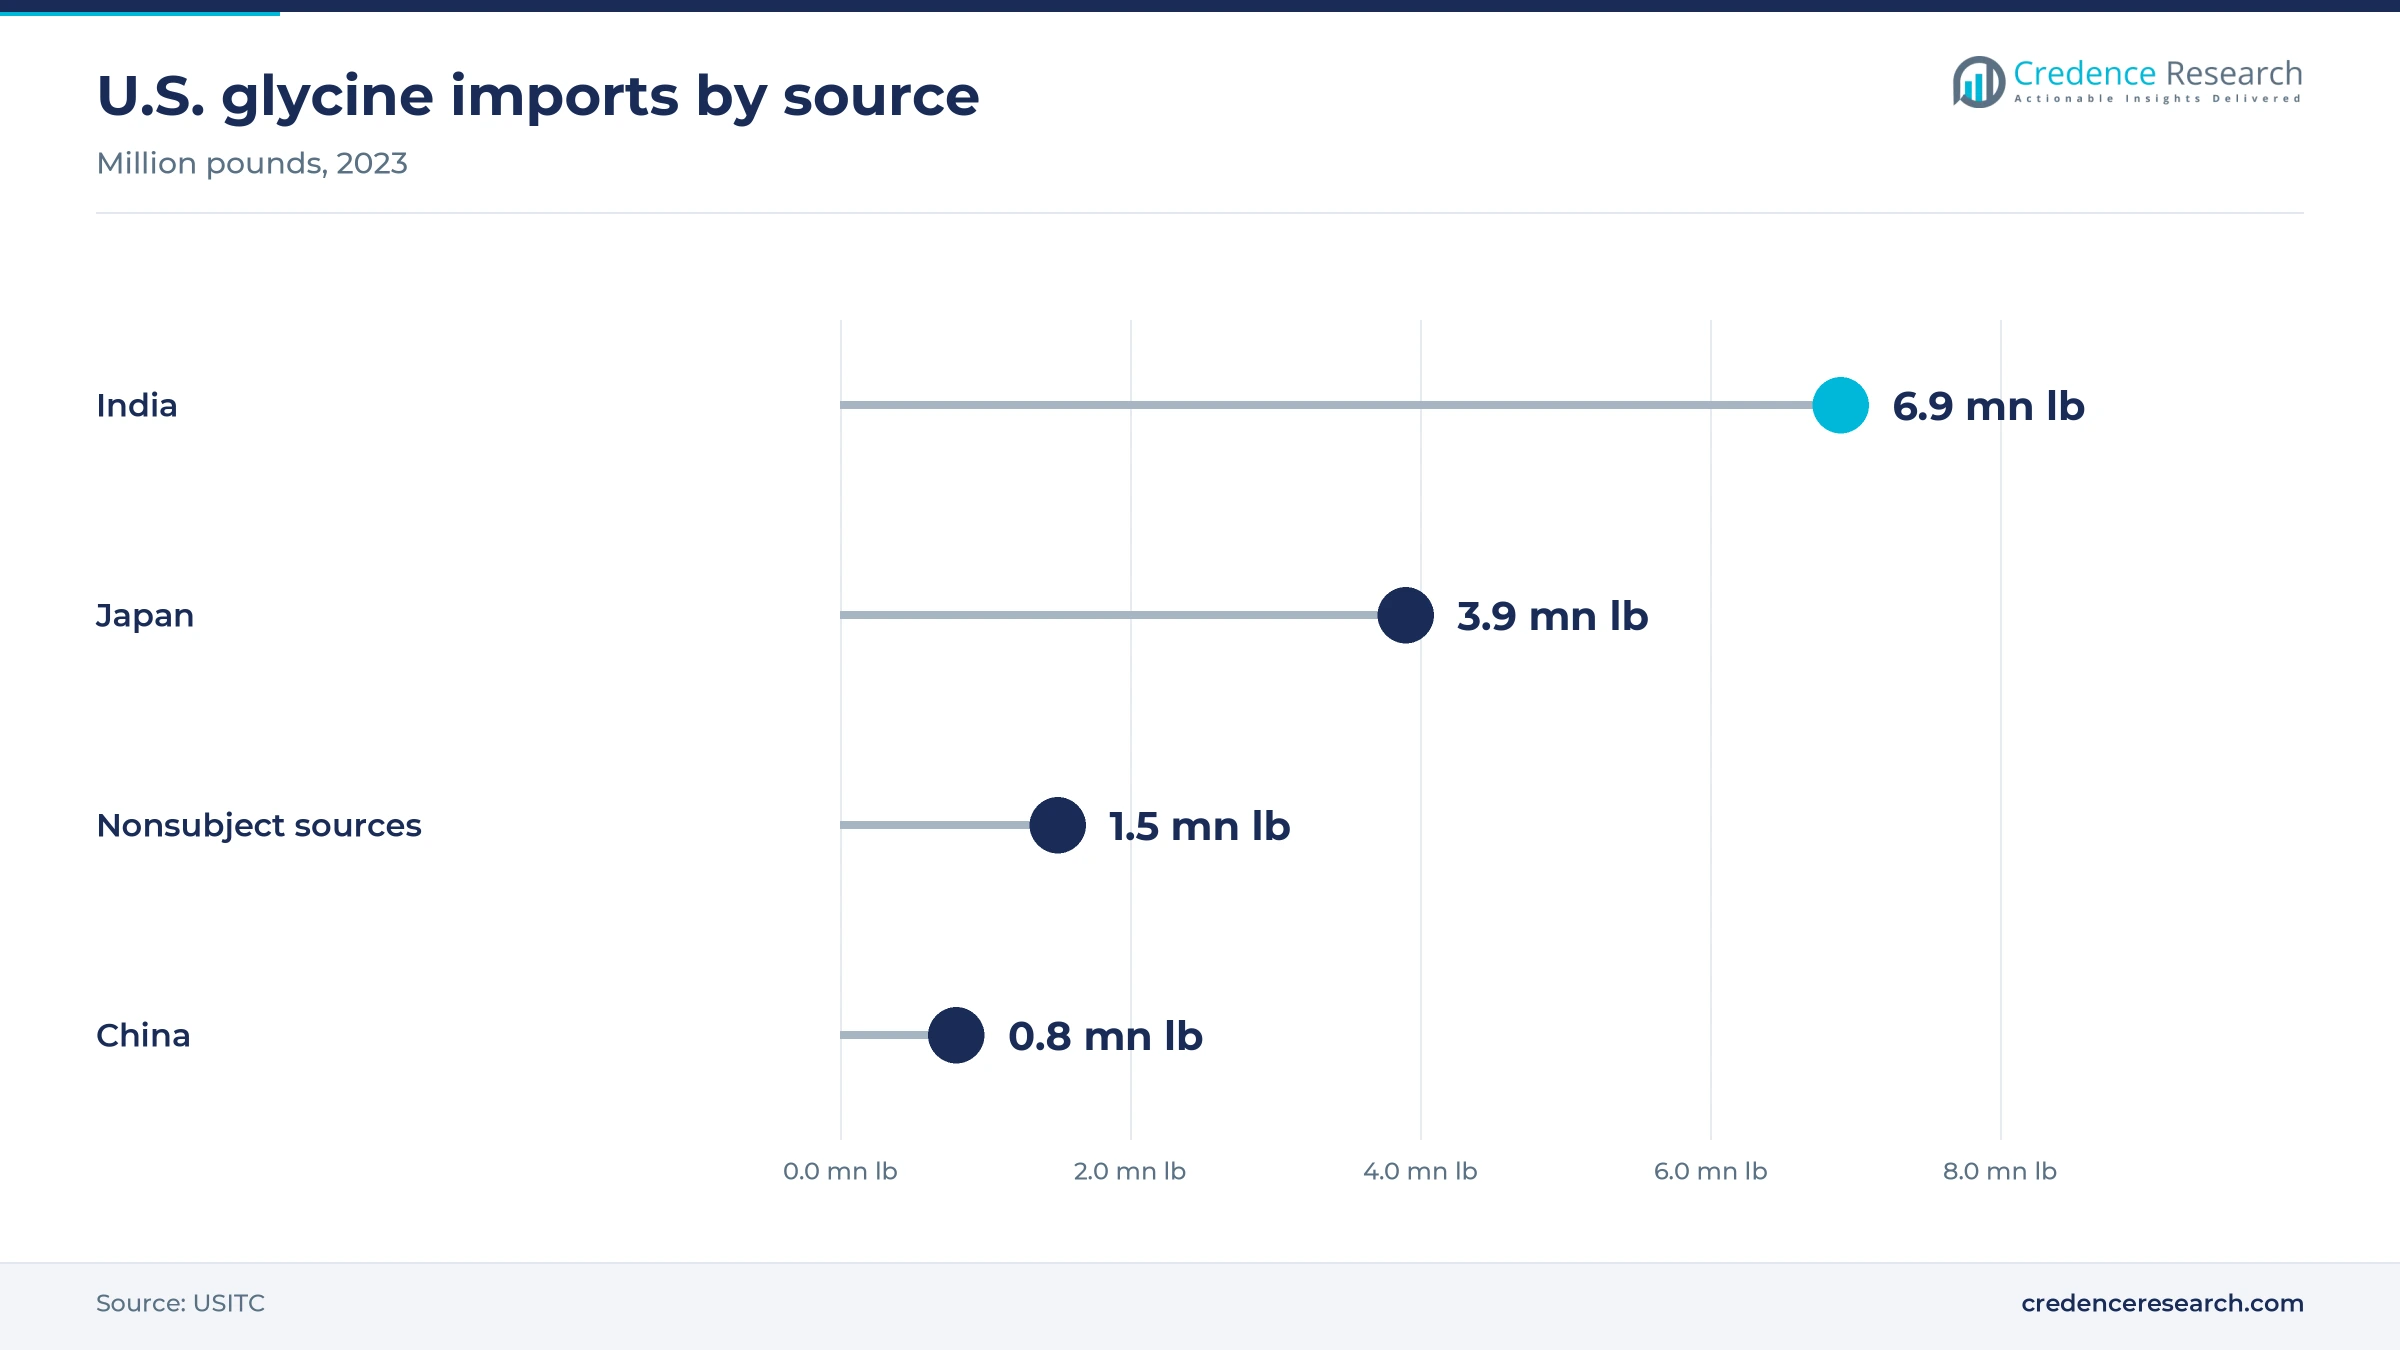
North America held 27.0% of 2025 value and grows at 5.8% a year, with supplements and flavor systems driving demand rather than beverages. Two domestic producers, Deer Park Glycine, a GEO Specialty Chemicals unit, and Chattem Chemicals, operate behind duty orders, and U.S. imports came mainly from India at 6.9 million pounds and Japan at 3.9 million pounds in 2023. Supplement use by 57.6% of adults gives the U.S. the largest retail glycine base. Credence Research puts the U.S. at about 85% of regional value.
Europe relies on imports and high-purity niches
Europe held 20.0% of 2025 demand and grows at 5.4% a year, the slowest rate, because local production now focuses on high-purity medical grades. Evonik makes REXIM amino acids at Ham in France and is reviewing that business, while most food and feed glycine arrives from China. Feed use is the main growth point, helped by the EU authorization for all species and stricter farm emission permits. European supplement brands buy documented grades, but volumes stay small next to Asian seasoning use.
Latin America grows through broiler feed
Latin America held 7.0% of 2025 demand and grows at 6.5% a year, mainly through feed premixes for broiler and pig producers in Brazil and Mexico. The low-protein broiler results described in the drivers section apply directly to large integrated broiler companies there. Credence Research found no regional glycine plant of scale, so buyers import from China and India and pay freight on top of bulk prices. Supplement demand in Brazil and Mexico is growing from a small base.
Middle East and Africa remains import-led
Middle East & Africa held 5.0% of 2025 value and grows at 6.7% a year, with demand coming from imported supplements, food processing in the Gulf states and poultry feed in Saudi Arabia, Egypt and South Africa. Credence Research found no regional glycine production, so this estimate rests on imports of finished goods and ingredients. No public statistic separates glycine in Gulf supplement sales, and that remains an evidence gap. Suppliers with halal certificates and Gulf import registrations are best placed to win these contracts, although no public data rank them.
Trade cases and portfolio moves marked 2024 to 2026
| Development | Status and market relevance |
|---|---|
| In October 2024, Evonik announced a restructuring of its keto and pharma amino acid business, including a review of partnerships or a sale for its Ham and Wuming sites. | Strategic plan; the Ham and Wuming sites continue to supply customers while options are evaluated. |
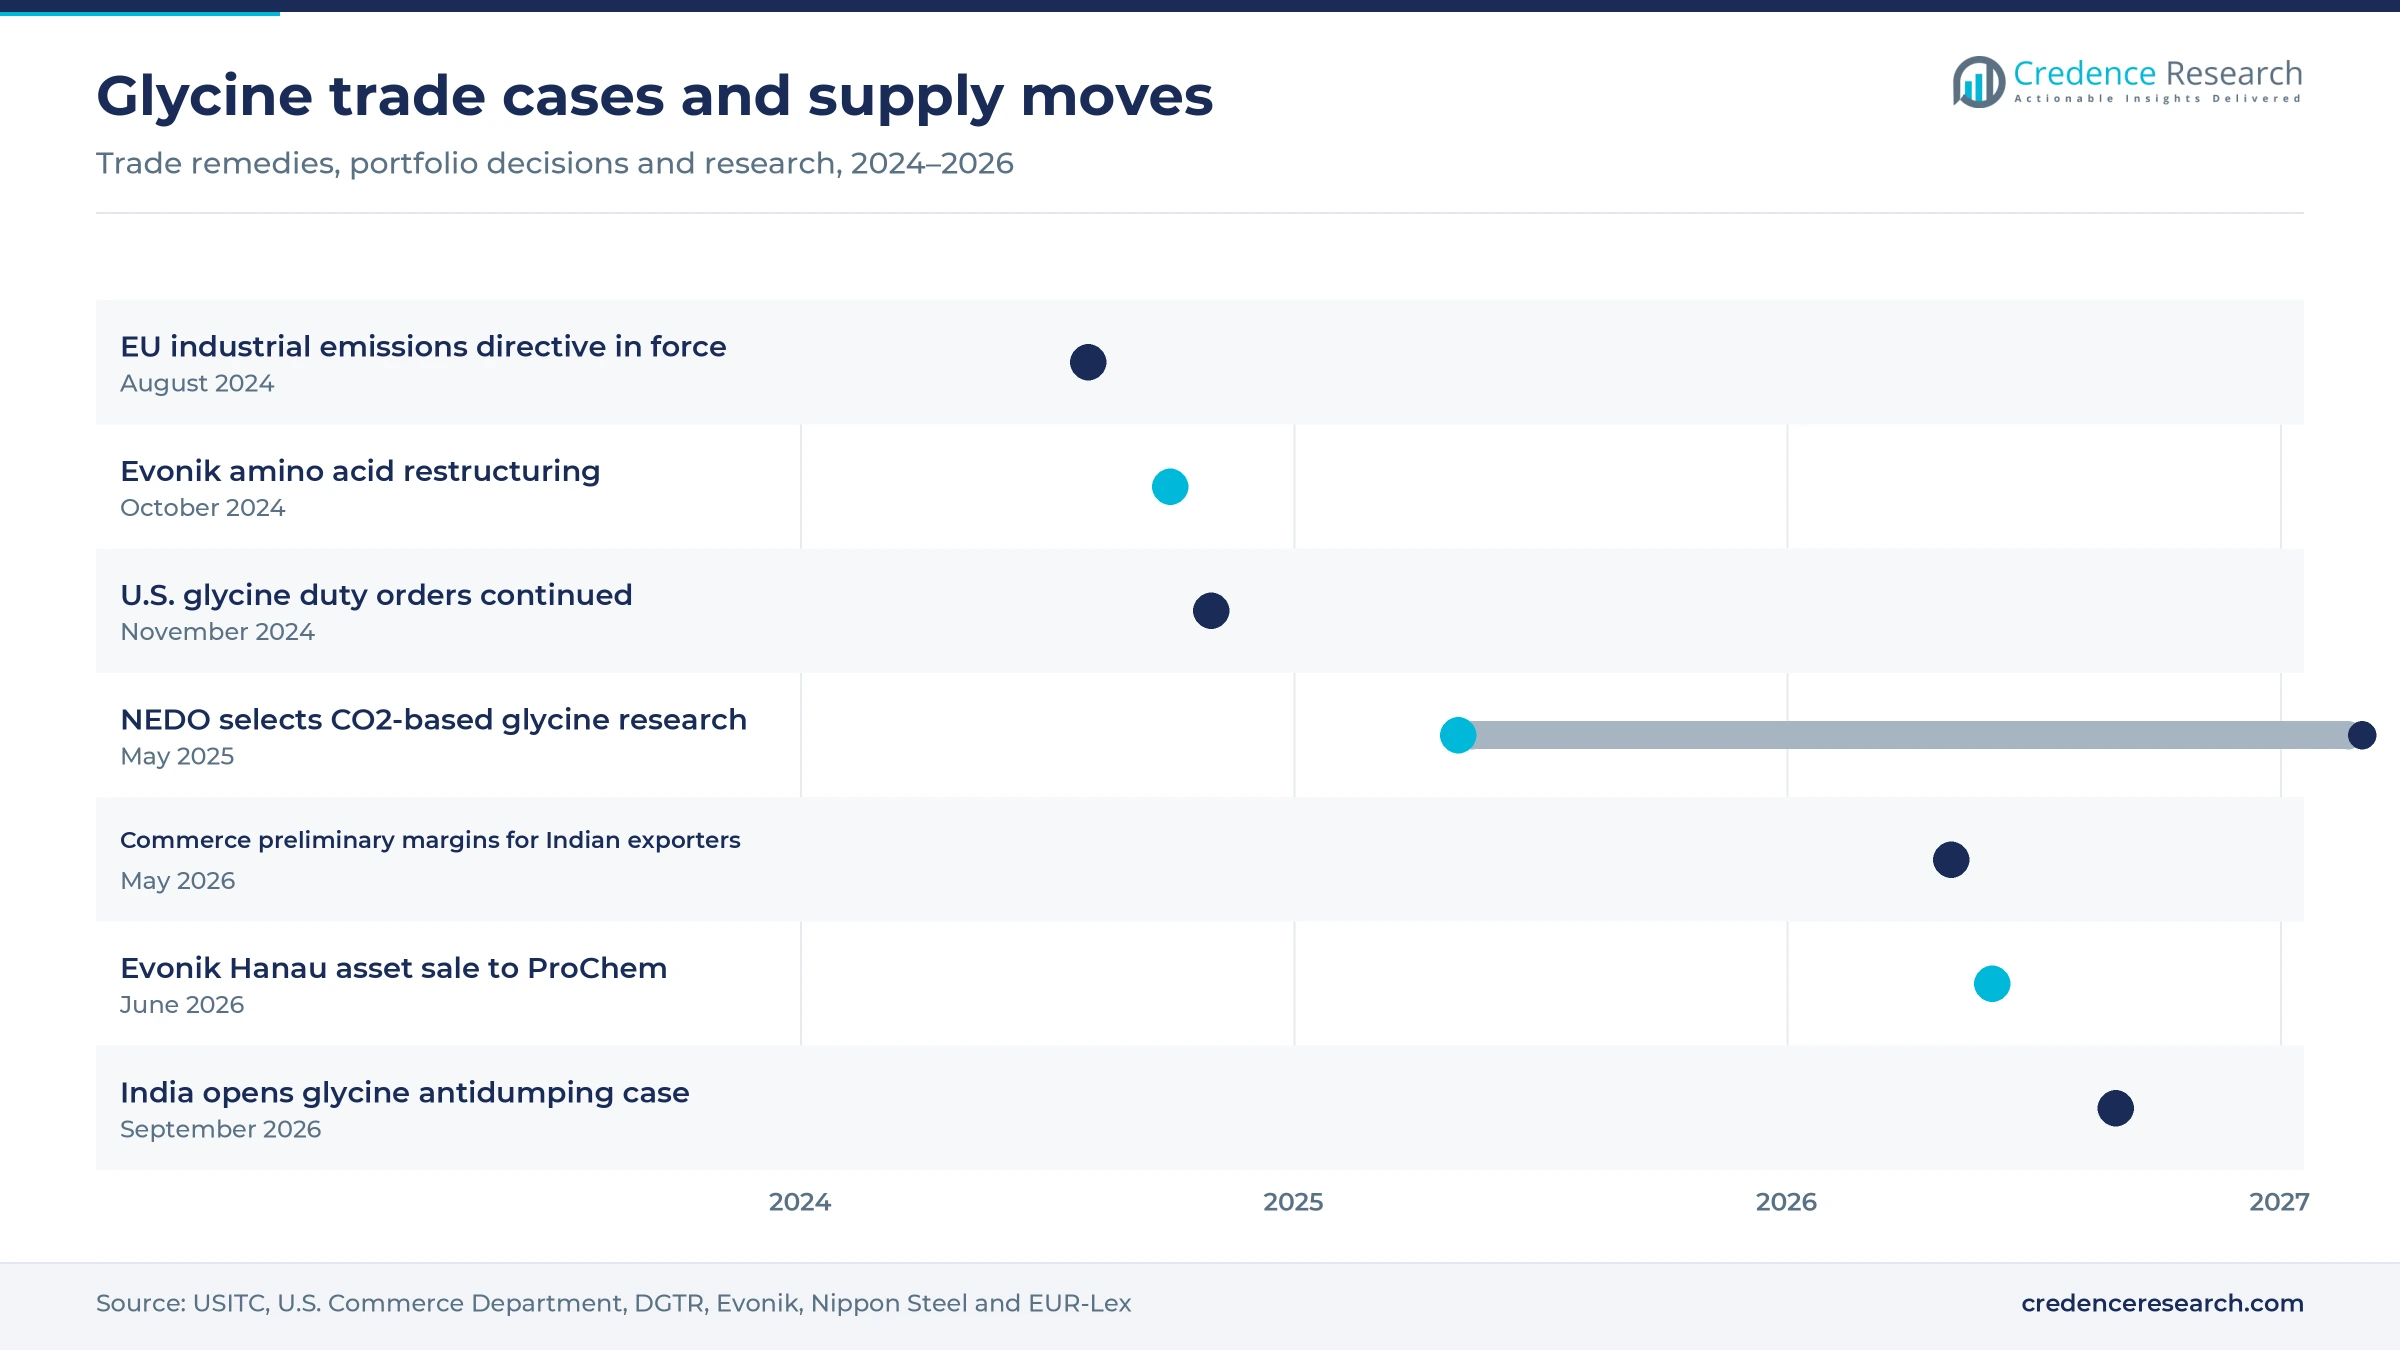
| In November 2024, the USITC voted to keep the antidumping and countervailing duty orders on glycine from China, India, Japan and Thailand, and Commerce continued them from Nov. 29, 2024. | Completed decision; the orders stay in place until the next five-year review. |
| In June 2025, Resonac, Nippon Steel and the University of Toyama announced NEDO-funded research into glycine made from CO2-derived methanol. | Research project for fiscal 2025 to fiscal 2027; no pilot plant or production date has been announced. |
| In May 2026, the U.S. Commerce Department set preliminary antidumping margins of 57.17% for two Indian glycine exporters. | Preliminary results; final rates follow after comments from interested parties. |
| In September 2026, India's DGTR started an antidumping investigation into glycine from China after a complaint from Avid Organics. | Investigation initiated; no duty rate has been proposed yet. |
Synthesis route and purification decide the grade
- Strecker synthesis reacts formaldehyde, hydrogen cyanide and ammonia, and plants linked to acrylonitrile units get low-cost cyanide as a by-product, which is why acrylonitrile makers hold a cost edge.
- Chloroacetic acid amination reacts chloroacetic acid with ammonia and leaves ammonium chloride that must be washed out before material can be sold as a food grade.
- Recrystallization and drying separate FCC and USP material from technical grade and set the crystal size that powder, granule and capsule buyers specify.
- Certificate and impurity testing covers heavy metals, chloride and residual solvents, and supplement and medical nutrition buyers ask for these files before approval.
Need a Custom Version of This Report?
Tailor the scope, geography, or segments to your exact requirements.
- Custom geography or segment scope
- Direct access to our analyst team
Chinese volume makers face Japanese and Western purity
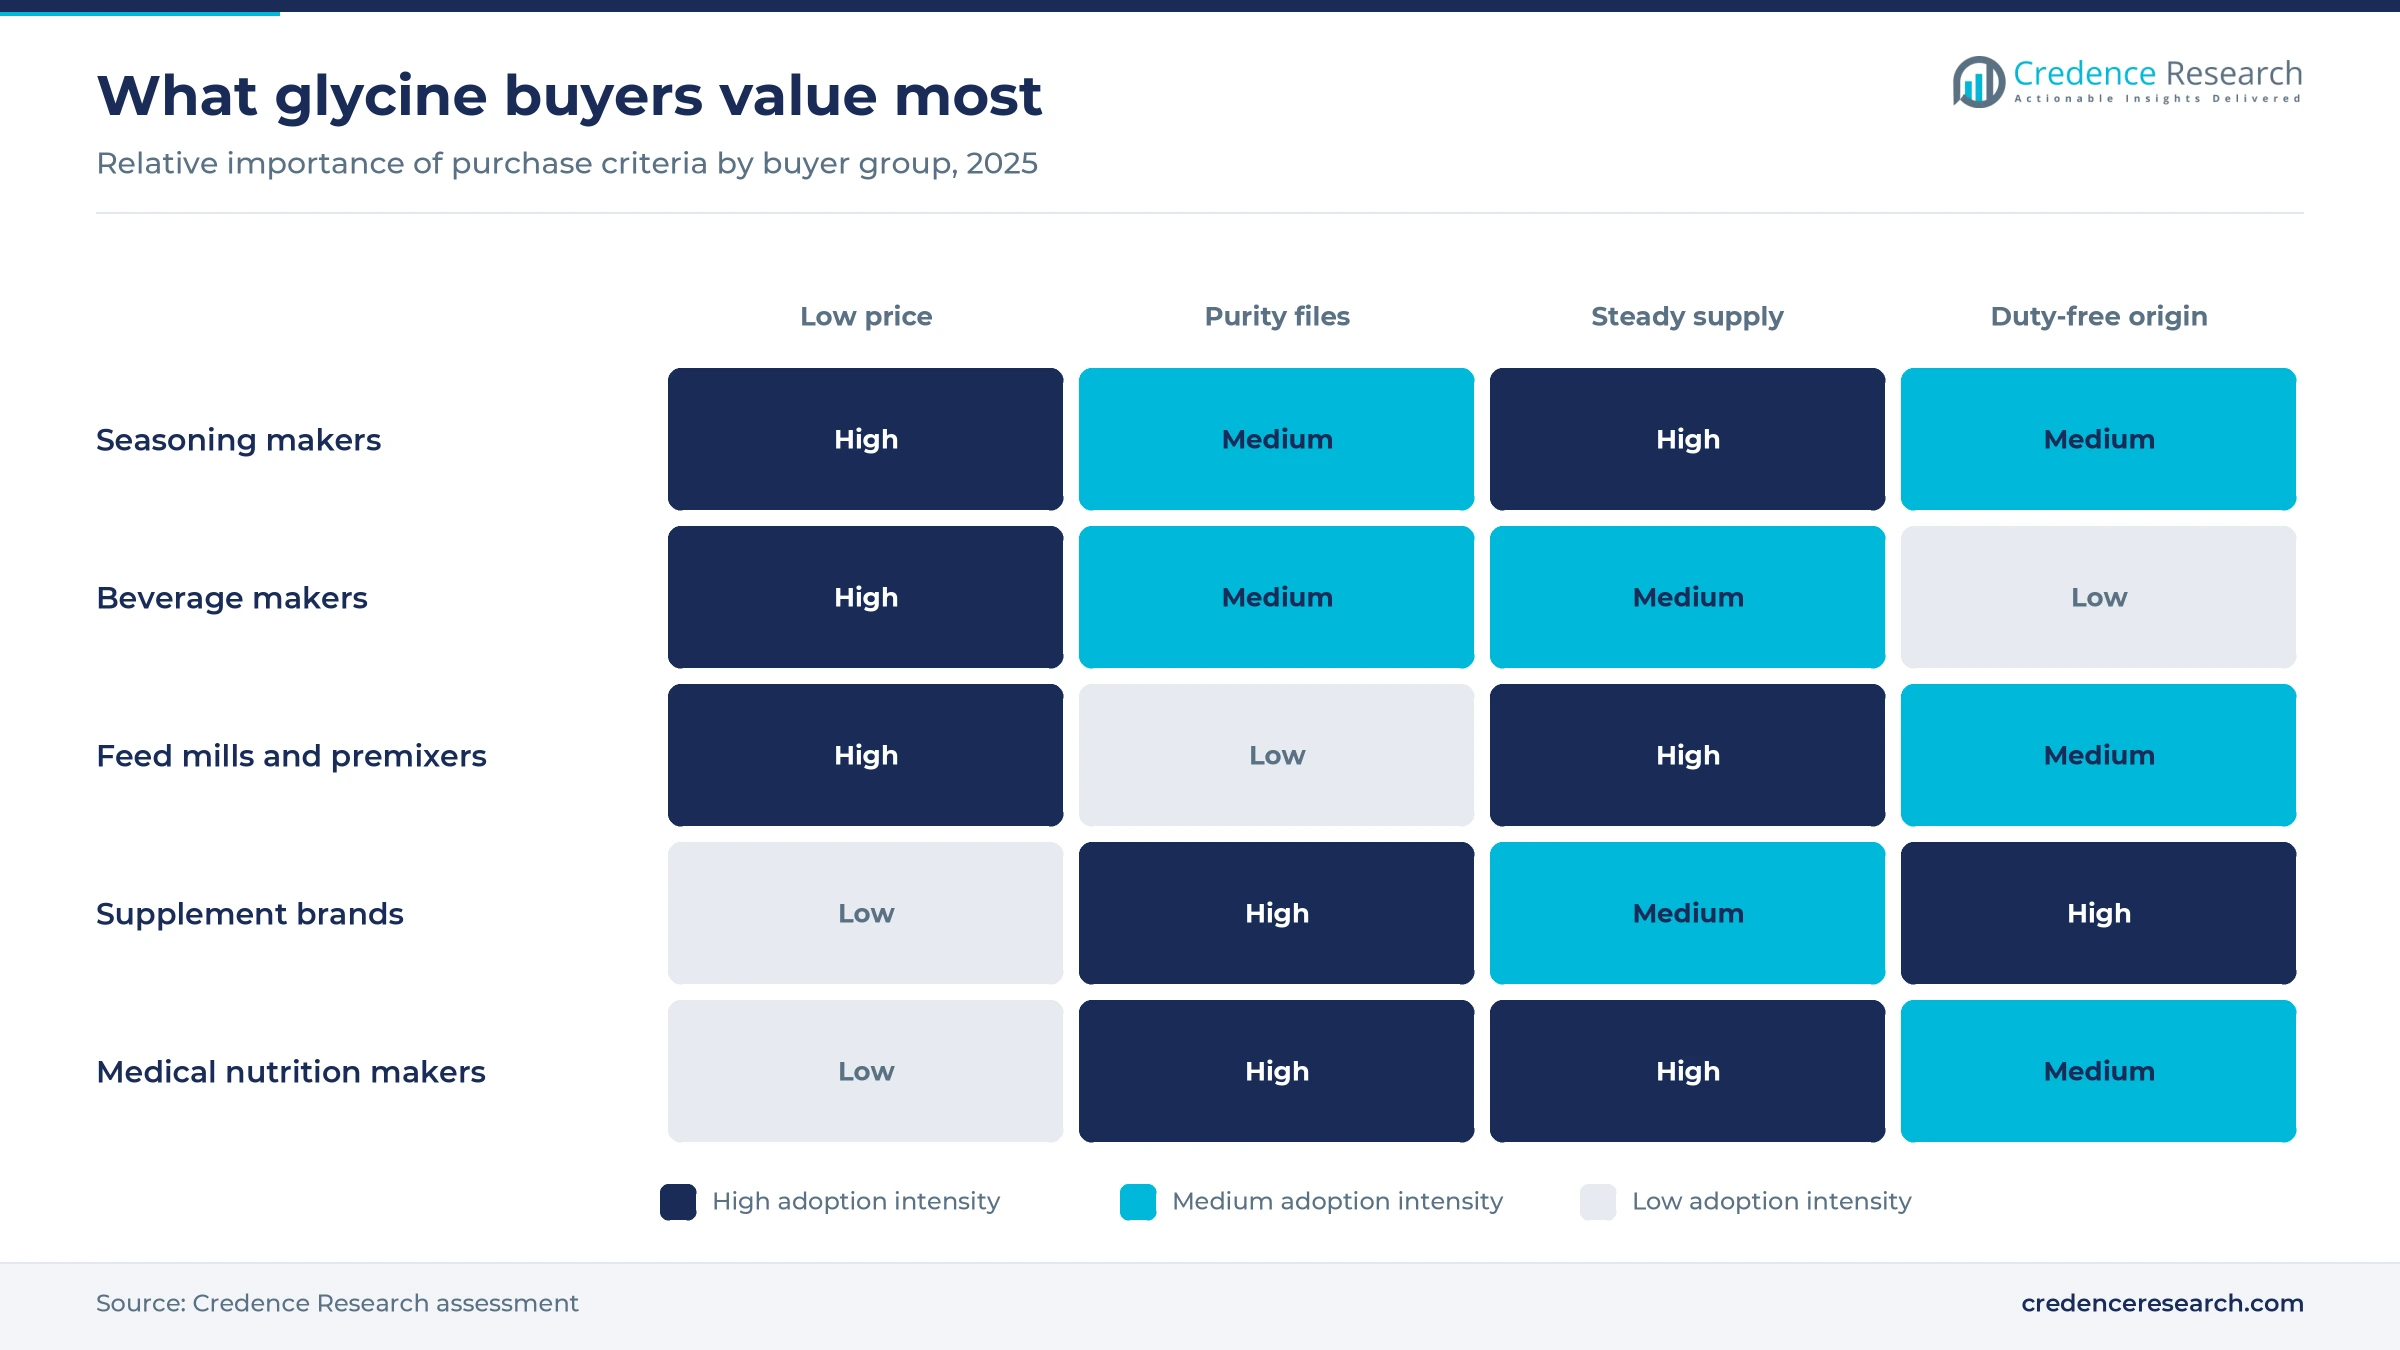
Competition splits between Chinese volume producers and specialists that sell on purity and documentation. Hebei Donghua Jiheng and Newtrend sell large volumes of food, feed and pharmaceutical grades worldwide from Chinese plants, and Newtrend also runs a Thai unit. Ajinomoto and Yuki Gosei serve Japanese seasoning makers and supplement brands with high-purity material, and Ajinomoto also sells its own glycine sleep products. Deer Park Glycine and Chattem Chemicals supply the U.S. market behind duty orders, while Avid Organics and Paras Intermediates lead Indian supply. Evonik focuses on medical nutrition grades sold under the REXIM brand. Suppliers win through certificates, steady lead times and duty-free access rather than list price alone. Buyers in the U.S. and India now weigh origin as heavily as price, because duty orders and open trade cases can change landed cost within a single contract year.
How is the glycine supply side organized?
Supply sits with about a dozen large producers, led by Chinese plants that also make technical glycine for herbicides, plus specialists in Japan, India, the U.S. and Europe. Chinese makers win on cost and scale, while Japanese and Western producers win on purity documentation and steady supply. Entry barriers are moderate, since synthesis is well known, but cyanide handling, wastewater treatment and certification raise capital needs. Margins in bulk food grade are thin, and most value is captured by supplement brands and distributors that resell in small packs.
Companies profiled and their roles in this market
| Company | Type | Role in the market |
|---|---|---|
| Ajinomoto Co., Inc. | Full-line supplier | AjiPure food-grade glycine and Glyna glycine sleep supplements |
| Evonik Industries AG (REXIM) | Specialist | REXIM high-purity glycine for medical nutrition and supplements |
| Yuki Gosei Kogyo Co., Ltd. | Specialist | Food-grade glycine for seasoning, sweetening and shelf-life uses |
| Hebei Donghua Jiheng Amino Acid Sci-Tec Co., Ltd. | Volume producer | Pharma, food, feed and technical glycine to USP, FCC and EP standards |
| Newtrend Group | Volume producer | Glycine and food ingredients from Chinese and Thai plants |
| Deer Park Glycine (GEO Specialty Chemicals) | Domestic producer | U.S.-made USP glycine for food, nutraceutical and pharmaceutical buyers |
| Chattem Chemicals, Inc. | Domestic producer | U.S. glycine producer named in the 2024 USITC duty order review |
| Avid Organics Pvt. Ltd. | Local manufacturer | Largest Indian glycine producer and applicant in the current Indian duty case |
| Paras Intermediates Pvt. Ltd. | Local manufacturer | Indian glycine producer and co-applicant in the earlier Indian duty case |
Value shifts from bulk seasoning to branded nutrition
Credence Research's view is that food grade glycine value is moving from bulk seasoning toward branded nutrition and feed, even though food and beverages keep 47.0% of 2025 value. Chinese plants will keep setting the floor price, so non-Chinese producers need documentation, duty-free access or carbon claims to hold premiums. Trade remedies in the U.S. and India redistribute volume rather than add it, and they raise costs for small supplement brands. Feed-grade glycine in low-protein broiler diets is the largest volume opportunity, while sleep supplements carry the highest value per kilogram.
Estimates rest on trade data and price build-up
The report uses 2025 as the base year and forecasts to 2035. The 2025 value carries forward the earlier Credence Research estimate at its own growth rate and was checked against a volume and price build-up using USITC trade data, supplier price listings and feed and supplement demand. The growth rate was lowered from the earlier estimate to reflect commodity pricing. Regional shares, segment splits and price ranges are Credence Research estimates. Sources include regulator documents, trade remedy filings, company releases and peer-reviewed studies; no interviews or surveys are claimed.
Feed and supplement uses carry growth to 2035
Functional Food & Nutritional Supplements should keep growing at 7.1% a year to 2035, the fastest application rate in food grade glycine demand. The market should reach USD 1.72 billion by 2035, with food and beverages still the largest application and supplements growing fastest. Growth through 2027 depends on Chinese capacity use, the outcome of India's trade case and the pace of low-protein feed adoption. Supply should keep concentrating in China and India for bulk grades, while Japanese and Western producers focus on medical nutrition, supplements and lower-carbon routes. These projections are modeled estimates and would shift with trade decisions and herbicide demand.
How wide is the range of glycine outcomes?
The range depends mainly on Chinese capacity use and on how fast supplement and feed demand grows. A weak herbicide cycle would push more Chinese output into food grade and cut prices, while wider trade cases would raise landed costs for importers. Faster adoption of low-protein broiler diets in Asia and Latin America is the main upside, because feed volume can scale far faster than seasoning use.
| Scenario | CAGR, 2026–2035 | Value, 2035 | What has to hold |
|---|---|---|---|
| Downside | 4.7% | USD 1.51 billion | Chinese output floods food grade and bulk prices fall below USD 3 per kg |
| Base | 6.20% | USD 1.72 billion | Steady seasoning use, gradual low-protein feed adoption and stable trade remedies |
| Upside | 7.4% | USD 1.90 billion | Asian broiler integrators adopt low-protein diets widely and sleep supplements keep growing |
Frequently Asked Questions
How big is the food grade glycine market?
How large is the glycine supplement market?
How large is the U.S. glycine supplement market?
Which countries export the most glycine powder?
What is feed grade glycine used for?
Who are the main glycine suppliers?
How is the India glycine market changing?
Which region leads the food grade glycine market?
Table of Content
Chapter 1 Market Segmentation
- 1.1 Segmentation Framework
- 1.1.1 Product and Service Classification
- 1.1.2 Application and End-Use Classification
- 1.1.3 Technology and Solution Classification
- 1.1.4 Customer and Distribution Channel Classification
- 1.1.5 Geographic Segmentation
- 1.1.6 Market Segment Definitions and Boundaries
- 1.2 By Application
- 1.2.1 Food & Beverages
- 1.2.2 Animal Feed
- 1.2.3 Functional Food & Nutritional Supplements
- 1.3 By Form
- 1.3.1 Powder
- 1.3.2 Granules
- 1.3.3 Liquid
Chapter 2 Introduction
- 2.1 Report Objectives and Scope
- 2.2 Product Definition and Industry Terminology
- 2.3 Market Inclusions and Exclusions
- 2.4 Research Process
- 2.4.1 Primary Research and Expert Interviews
- 2.4.2 Secondary Research and Source Review
- 2.4.3 Top-Down and Bottom-Up Estimation
- 2.4.4 Data Triangulation and Verification
- 2.5 Market Size Measurement Basis
- 2.5.1 2025: USD 941.8 million → 2035: USD 1.72 billion
- 2.6 Historical and Forecast Reference Periods
- 2.6.1 Historical Period: 2018-2025
- 2.6.2 Base Year: 2025
- 2.6.3 Forecast Period: 2025-2035
- 2.7 Research Assumptions and Limitations
Chapter 3 Executive Summary
- 3.1 Market Snapshot and Key Findings
- 3.2 Base-Year Market Size, 2025
- 3.3 Forecast Market Size, 2035
- 3.4 Revenue and Volume Growth Outlook
- 3.5 Key Demand and Supply Indicators
- 3.6 Leading Market Segments
- 3.7 Fastest-Growing Market Opportunities
- 3.8 Regional Performance Highlights
- 3.9 Technology and Industry Transformation
- 3.10 Competitive Landscape Summary
- 3.11 Analyst View and Strategic Implications
Chapter 4 Global Food Grade Glycine Market Trends and Developments
- 4.1 Historical Industry Development, 2018-2025
- 4.2 Recent Market Trends and Developments
- 4.3 Demand and Customer Behavior Trends
- 4.4 Technology and Product Innovation
- 4.5 Artificial Intelligence, Automation and Digitalization
- 4.6 Local Manufacturing and Supply Chain Realignment
- 4.7 Industry Partnerships, Mergers and Acquisitions
- 4.8 Sustainability and Circular Economy Developments
- 4.9 Government and Private Sector Investment Trends
- 4.10 Emerging Business Models and Commercialization
- 4.11 Industry Developments and Announcements
Chapter 5 Global Food Grade Glycine Market Production, Supply and Demand Analysis
- 5.1 Demand Trend and Consumption Analysis, 2018-2025
- 5.2 Demand Forecast, 2025-2035
- 5.3 Production and Output Trend, 2018-2025
- 5.4 Production and Output Forecast, 2025-2035
- 5.5 Installed Capacity and Capacity Utilization
- 5.6 Company-Wise Production Plants and Statistics
- 5.6.1 Installed Production Capacity
- 5.6.2 Actual Production
- 5.6.3 Planned Capacity and Expansion Targets
- 5.7 Supply Chain Structure and Procurement Trends
- 5.8 Supply-Demand Gap and Bottlenecks
- 5.9 Import Dependence and Sourcing Structure
- 5.10 Contract Manufacturing and Outsourcing
- 5.11 Regional Supply and Demand Concentration
Chapter 6 Global Food Grade Glycine Market Pricing Analysis
- 6.1 Pricing Structure and Measurement
- 6.2 Historical Pricing Trends, 2018-2025
- 6.3 Pricing Outlook, 2025-2035
- 6.4 Average Selling Price and Unit Economics
- 6.5 Pricing by Product and Market Segment
- 6.6 Geographic Pricing Differences
- 6.7 Key Input, Energy, Labor and Logistics Costs
- 6.8 Contract Pricing and Purchasing Models
- 6.9 Pricing Sensitivity and Competitive Positioning
- 6.10 Price, Margin and Profitability Implications
Chapter 7 Global Food Grade Glycine Market Dynamics
- 7.1 Market Growth Drivers
- 7.1.1 Demand-Side Drivers
- 7.1.2 Technology and Innovation Drivers
- 7.1.3 Infrastructure and Investment Drivers
- 7.1.4 Regulatory and Policy Drivers
- 7.2 Market Restraints
- 7.2.1 Cost and Affordability Constraints
- 7.2.2 Technology and Adoption Barriers
- 7.2.3 Supply Chain and Operational Constraints
- 7.3 Market Challenges
- 7.3.1 Competitive Pressure and Margin Erosion
- 7.3.2 Skills, Infrastructure and Implementation Gaps
- 7.4 Emerging Market Opportunities
- 7.5 Market Dynamics Impact and Time-Horizon Assessment
Chapter 8 Global Food Grade Glycine Value Chain Analysis
- 8.1 Industry Value Chain Overview
- 8.2 Upstream Suppliers and Critical Inputs
- 8.3 Technology and Component Providers
- 8.4 Manufacturing or Service Delivery
- 8.5 Distribution, Channel Partners and Integrators
- 8.6 Downstream Applications and End Users
- 8.7 Value Addition and Profit Pools
- 8.8 Vertical Integration and Outsourcing
- 8.9 Supplier Concentration and Risk
- 8.10 Supply Chain Localization and Resilience
Chapter 9 Global Food Grade Glycine Market Regulations and Policies
- 9.1 Relevant Laws, Standards and Compliance Frameworks
- 9.2 Product, Service, Safety and Quality Requirements
- 9.3 Government Policies, Incentives and Subsidies
- 9.4 Imports, Exports and Trade Barriers
- 9.5 Public Procurement and Local Content Requirements
- 9.6 Environmental and Sustainability Compliance
- 9.7 Upcoming Policy Changes and Market Implications
Chapter 10 Global Food Grade Glycine Market Hotspots and Opportunities
- 10.1 Market Opportunity Mapping and Growth Hotspots
- 10.2 High-Growth Applications and Customer Groups
- 10.3 Underserved Markets and White-Space Opportunities
- 10.4 Emerging Technology and Product Opportunities
- 10.5 New Capacity and Investment Hotspots
- 10.6 Market Entry and Expansion Opportunities
- 10.7 Distribution and Partnership Opportunities
- 10.8 Near-Term and Long-Term Commercial Potential
- 10.9 Opportunity Attractiveness and Execution Risks
Chapter 11 Global Food Grade Glycine Market Outlook, 2025-2035
- 11.1 Market Size and Analysis
- 11.1.1 Revenue (Market Measurement: 2025: USD 941.8 million → 2035: USD 1.72 billion)
- 11.1.2 Market Volume and Quantity Sold
- 11.1.3 Historical Market Size, 2018-2025
- 11.1.4 Base-Year Market Size, 2025
- 11.2 Market Forecast, 2025-2035
- 11.2.1 Revenue Forecast to 2035
- 11.2.2 Volume Forecast to 2035
- 11.2.3 CAGR and Year-on-Year Growth
- 11.2.4 Incremental Revenue Opportunity
- 11.3 Forecast Assumptions and Scenario Analysis
- 11.3.1 Base-Case Forecast
- 11.3.2 Optimistic and Conservative Scenarios
- 11.3.3 Technology, Pricing and Policy Sensitivities
- 11.4 Market Attractiveness and Growth Outlook
Chapter 12 Global Food Grade Glycine Market Segmentation and Outlook
- 12.1 Segmentation Summary and Market Shares, 2025
- 12.2 Largest and Fastest-Growing Segments
- 12.3 By Application - Market Size and Forecast, 2025-2035
- 12.3.1 Segment Definition and Scope
- 12.3.2 Historical Market Size, 2018-2025
- 12.3.3 Revenue Forecast, 2025-2035
- 12.3.4 Volume Forecast, 2025-2035
- 12.3.5 Base-Year Market Share, 2025
- 12.3.6 Segment CAGR and Growth Drivers
- 12.3.7 Subsegment Market Size and Forecast
- 12.3.7.1 Food & Beverages
- 12.3.7.2 Animal Feed
- 12.3.7.3 Functional Food & Nutritional Supplements
- 12.3.8 Subsegment Pricing and Adoption Trends
- 12.3.9 Leading Suppliers and Competition
- 12.3.10 Regional Demand and Opportunities
- 12.4 By Form - Market Size and Forecast, 2025-2035
- 12.4.1 Segment Definition and Scope
- 12.4.2 Historical Market Size, 2018-2025
- 12.4.3 Revenue Forecast, 2025-2035
- 12.4.4 Volume Forecast, 2025-2035
- 12.4.5 Base-Year Market Share, 2025
- 12.4.6 Segment CAGR and Growth Drivers
- 12.4.7 Subsegment Market Size and Forecast
- 12.4.7.1 Powder
- 12.4.7.2 Granules
- 12.4.7.3 Liquid
- 12.4.8 Subsegment Pricing and Adoption Trends
- 12.4.9 Leading Suppliers and Competition
- 12.4.10 Regional Demand and Opportunities
- 12.5 Segment Growth Comparison
- 12.6 Segment Attractiveness and Priority Matrix
Chapter 13 Global Food Grade Glycine End-Use and Application Market Outlook
- 13.1 End-Use Industry and Customer Demand Structure
- 13.2 Leading Applications and Customer Groups
- 13.3 End-Use Market Size, Share and Forecast
- 13.4 Major End-Use Industry Deep Dives
- 13.4.1 Customer Requirements and Use Cases
- 13.4.2 Demand and Replacement Cycles
- 13.4.3 Technical and Regulatory Considerations
- 13.4.4 Purchasing and Procurement Models
- 13.4.5 Leading Vendors and Distribution Channels
- 13.4.6 Forecast and Commercial Opportunities
- 13.5 Emerging Applications and Cross-Segment Demand
- 13.6 End-Use Industry Investment Priorities
Chapter 14 Global Food Grade Glycine Geographic Market Outlook, 2025-2035
- 14.1 Regional Market Size and Share, 2025
- 14.2 Regional Market Forecast, 2025-2035
- 14.3 Regional Pricing, Production and Demand Differences
- 14.4 North America
- 14.4.1 United States
- 14.4.2 Canada
- 14.4.3 Mexico
- 14.5 Europe
- 14.5.1 Germany
- 14.5.2 France
- 14.5.3 Italy
- 14.5.4 United Kingdom
- 14.5.5 Spain
- 14.5.6 Poland
- 14.5.7 Russia
- 14.5.8 Netherlands
- 14.5.9 Belgium
- 14.5.10 Sweden
- 14.5.11 Denmark
- 14.5.12 Norway
- 14.5.13 Rest of Europe
- 14.6 Asia Pacific
- 14.6.1 China
- 14.6.2 India
- 14.6.3 Japan
- 14.6.4 South Korea
- 14.6.5 Thailand
- 14.6.6 Indonesia
- 14.6.7 Vietnam
- 14.6.8 Malaysia
- 14.6.9 Australia
- 14.6.10 Rest of Asia Pacific
- 14.7 Latin America
- 14.7.1 Brazil
- 14.7.2 Argentina
- 14.7.3 Colombia
- 14.7.4 Chile
- 14.7.5 Rest of Latin America
- 14.8 Middle East
- 14.8.1 Saudi Arabia
- 14.8.2 United Arab Emirates
- 14.8.3 Turkey
- 14.8.4 Israel
- 14.8.5 Iran
- 14.8.6 Rest of the Middle East
- 14.9 Africa
- 14.9.1 South Africa
- 14.9.2 Egypt
- 14.9.3 Nigeria
- 14.9.4 Morocco
- 14.9.5 Rest of Africa
- 14.10 Regional Investment, Policy and Supply Chain Differences
- 14.11 Regional Competitive Landscape
- 14.12 Geographic Growth Hotspots
Chapter 15 Global Food Grade Glycine Technology, Innovation and Sustainability Outlook
- 15.1 Technology Landscape and Maturity
- 15.2 Product, Process and Service Innovation
- 15.3 AI, Automation and Digital Tools in the Industry
- 15.4 Technology Adoption and Performance Benchmarking
- 15.5 Innovation Pipeline and R&D Investment
- 15.6 Patent and Intellectual Property Trends
- 15.7 Energy Efficiency and Resource Management
- 15.8 Sustainability, Recycling and Circularity
- 15.9 Technology Roadmap, 2025-2035
- 15.10 Risks of Obsolescence and Technology Substitution
Chapter 16 Global Food Grade Glycine Market Key Strategic Imperatives
- 16.1 Growth and Market Entry Priorities
- 16.2 High-Return Products and Segments
- 16.3 Pricing, Profitability and Cost Optimization
- 16.4 Technology Investment and Product Differentiation
- 16.5 Supply Chain Localization and Resilience
- 16.6 Distribution and Customer Acquisition
- 16.7 Partnership, Acquisition and Capacity Strategy
- 16.8 Regional Expansion Priorities
- 16.9 Short-, Medium- and Long-Term Actions
Chapter 17 Competition Outlook
- 17.1 Industry Competition Characteristics
- 17.2 Market Structure and Concentration
- 17.3 Market Share and Competitive Positioning, 2025
- 17.4 Company-Wise Revenue and Product Benchmarking
- 17.5 Production and Service Capacity Benchmarking
- 17.6 Technology, Pricing and Differentiation
- 17.7 Regional Footprint and Distribution Strength
- 17.8 Mergers, Acquisitions and Strategic Alliances
- 17.9 New Entrants and Competitive Threats
- 17.10 Porter's Five Forces and Industry Attractiveness
- 17.11 Competitive Outlook, 2025-2035
Chapter 18 Company Profiles
- 18.1 Company Coverage and Selection Criteria
- 18.2 Ajinomoto Co., Inc.
- 18.2.1 Business Description
- 18.2.2 Company Ownership and Geographic Presence
- 18.2.3 Product and Service Portfolio
- 18.2.4 Manufacturing and Operating Footprint
- 18.2.5 Production Capacity and Expansion Plans
- 18.2.6 Financial Performance and Investment
- 18.2.7 Market Share and Competitive Position
- 18.2.8 Technology and Innovation Capabilities
- 18.2.9 Strategic Alliances or Partnerships
- 18.2.10 Recent Developments
- 18.2.11 Growth Strategy and Outlook
- 18.3 Evonik Industries AG (REXIM)
- 18.4 Yuki Gosei Kogyo Co., Ltd.
- 18.5 Hebei Donghua Jiheng Amino Acid Sci-Tec Co., Ltd.
- 18.6 Newtrend Group
- 18.7 Deer Park Glycine (GEO Specialty Chemicals)
- 18.8 Chattem Chemicals, Inc.
- 18.9 Avid Organics Pvt. Ltd.
- 18.10 Paras Intermediates Pvt. Ltd.
- 18.11 Other Relevant Market Participants
Note: Every listed company is profiled on the structure shown under the first company. The company list is preliminary and may change based on research findings, market developments, data availability and client requirements.
Chapter 19 Disclaimer
- 19.1 Research and Forecast Disclaimer
- 19.2 Data Source and Estimation Limitations
Note: The depth of individual sections depends on data availability for this market. Volume, capacity, trade and other unit-based metrics are included where applicable.