Market Overview:
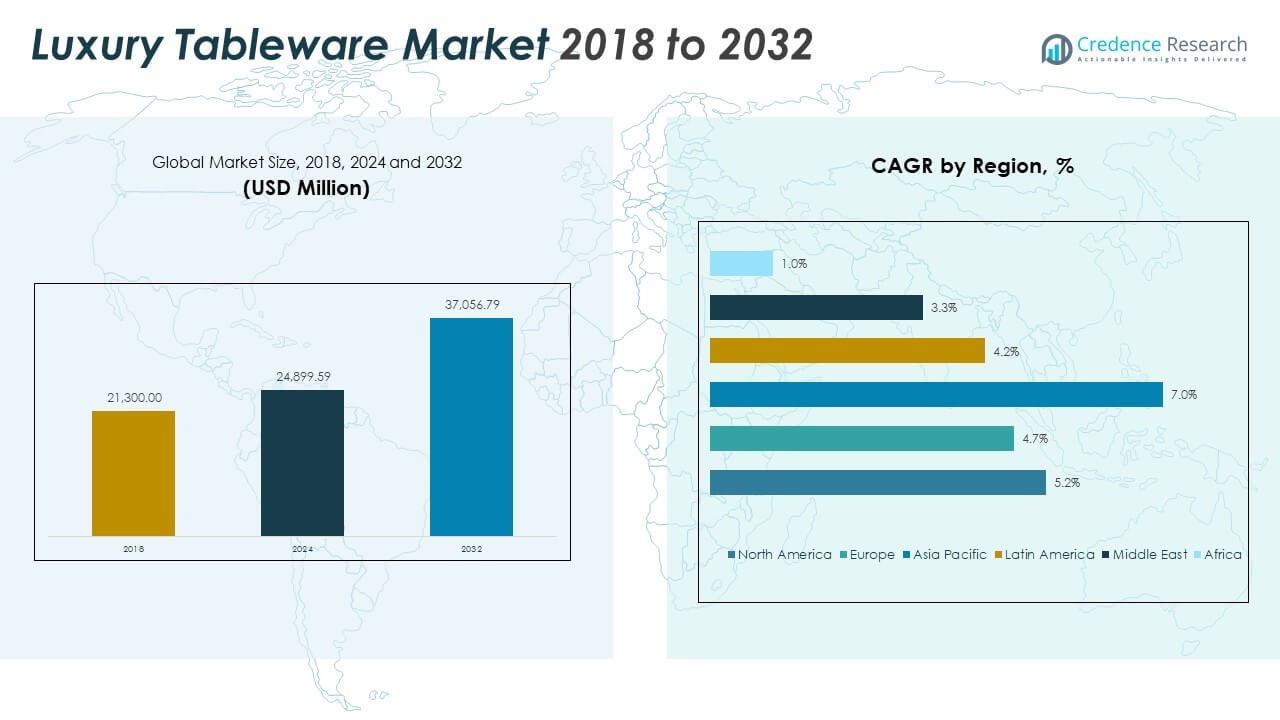
The Luxury Tableware Market size was valued at USD 21,300.00 million in 2018 to USD 24,899.59 million in 2024 and is anticipated to reach USD 37,056.79 million by 2032, at a CAGR of 5.15% during the forecast period.
| REPORT ATTRIBUTE |
DETAILS |
| Historical Period |
2020-2023 |
| Base Year |
2024 |
| Forecast Period |
2025-2032 |
| Luxury Tableware Market Size 2024 |
USD 24,899.59 Million |
| Luxury Tableware Market, CAGR |
5.15% |
| Luxury Tableware Market Size 2032 |
USD 37,056.79 Million |
The market growth is driven by rising demand for premium dining experiences, expanding luxury hospitality sectors, and increasing consumer focus on aesthetics and lifestyle. Consumers are investing in high-quality, durable, and designer tableware to enhance dining spaces. It benefits from growing popularity of fine dining, personalized gifting trends, and sustainable craftsmanship. Leading brands are focusing on material innovation and creative collaborations to strengthen their premium positioning and appeal to global luxury consumers.
Europe dominates the market due to its heritage craftsmanship and strong presence of luxury brands. North America follows with demand supported by premium lifestyle adoption and hospitality growth. The Asia Pacific region is emerging rapidly, driven by rising disposable incomes and urbanization in China, Japan, and India. Latin America and the Middle East show gradual expansion, supported by increasing luxury retail presence and hotel development. Africa remains a smaller yet growing market, influenced by urban lifestyle trends and tourism growth.
Access crucial information at unmatched prices!
Request your sample report today & start making informed decisions powered by Credence Research Inc.!
Download Sample
Market Insights:
- The Luxury Tableware Market size was valued at USD 21,300.00 million in 2018, reached USD 24,899.59 million in 2024, and is projected to hit USD 37,056.79 million by 2032, registering a CAGR of 5.15% during the forecast period.
- Europe leads with 37.4% share due to its heritage brands, fine craftsmanship, and strong luxury consumption culture, followed by North America at 33.9% and Asia Pacific at 21.0%, reflecting mature demand across premium hospitality and household sectors.
- Asia Pacific remains the fastest-growing region, holding 21.0% share, driven by rising disposable incomes, urbanization, and expanding luxury dining trends in China, Japan, and India.
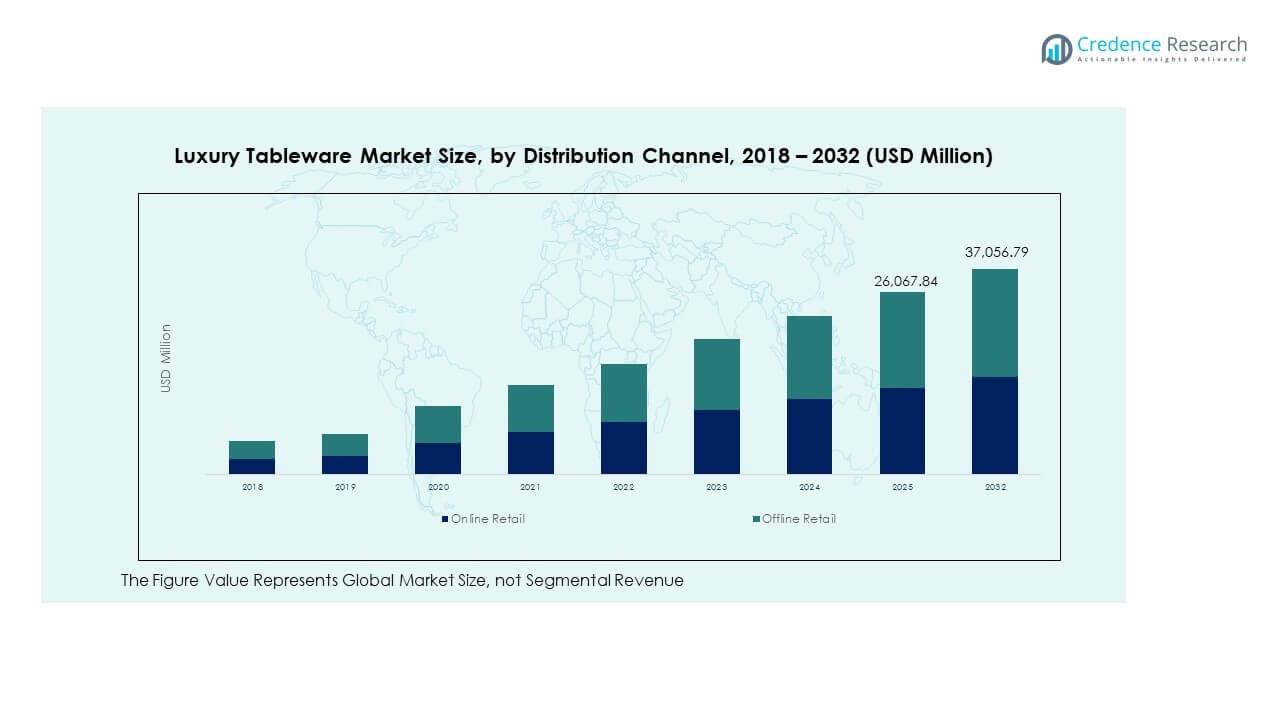
- Offline retail dominates the market with nearly 60% share, supported by brand-exclusive boutiques and personalized in-store experiences catering to affluent buyers.
- Online retail accounts for roughly 40% share, growing rapidly through digital marketplaces, brand websites, and social commerce channels offering convenience and customization.
Market Drivers
Rising Preference for Premium Lifestyle and High-End Dining Experiences
The growing demand for elegant and premium lifestyle products drives the Luxury Tableware Market. Consumers are shifting toward luxury table settings that reflect sophistication and status. High-income households and upscale hospitality brands are investing in designer cutlery, fine china, and crystal glassware. It is gaining momentum in urban and cosmopolitan cities where dining aesthetics influence purchasing decisions. The market benefits from rising exposure to global luxury brands through retail and digital platforms. Customized and exclusive product lines attract niche customers. This trend supports strong brand loyalty among affluent buyers. It also fuels innovation in product design and finish.
Expansion of the Hospitality Sector and Growth of Fine Dining Culture
The expansion of luxury hotels, fine dining restaurants, and high-end resorts accelerates market growth. Hotels are investing in distinctive tableware to elevate guest experiences and brand image. It aligns with growing tourism activities and luxury service standards worldwide. Demand from event catering and banquet facilities further strengthens product adoption. Premium tableware enhances presentation and aligns with the overall dining ambiance. The rising number of Michelin-starred and luxury-themed restaurants drives consistent procurement cycles. Brands offering coordinated and stylish collections appeal strongly to hospitality buyers. The sector remains a consistent contributor to steady revenue streams.
- For instance, Lenox Corporation in late 2024 announced plans to expand its domestic operations with a new West Coast hub and expanded silversmithing and design teams, contributing over 100 new jobs across 14 U.S. states. Their enhanced production capabilities cater to increasing demand for premium tableware in luxury hotels and fine dining environments.
Increasing Focus on Craftsmanship, Quality, and Exclusive Designs
Manufacturers emphasize craftsmanship, durability, and limited-edition designs to gain a competitive edge. High-quality porcelain, fine bone china, silverware, and crystal materials dominate product lines. It appeals to consumers seeking both functional and aesthetic value. Collaborations between luxury brands and designers further amplify market visibility. Attention to detail and heritage craftsmanship strengthen brand reputation. Consumers value pieces that blend artistry with modern utility. High spending on exclusive designs supports brand differentiation. Premium packaging and personalized offerings enhance product appeal in luxury retail spaces.
- For instance, Rosenthal launched the Sixty & Twelve Limited Edition Vase Collection to celebrate 60 years of its studio-line, featuring 60 vases in 12 colors crafted using mass-dyed porcelain techniques. This collection reflects the brand’s dedication to innovation and German artisanal craftsmanship.
Growing Impact of Social Media and Influencer Culture on Consumer Choices
The growing influence of lifestyle influencers and luxury content on social media shapes purchasing behavior. Digital platforms highlight premium dining trends and exclusive product lines. It creates aspirational demand among upper-middle-class consumers and millennials. Influencer-led campaigns increase visibility and consumer engagement for luxury tableware brands. Online channels make premium collections more accessible to global audiences. Customers often replicate fine dining setups showcased online. This visual influence encourages impulsive buying and brand loyalty. Market leaders use social commerce strategies to reach new high-value customers.
Market Trends
Sustainability Integration and Adoption of Eco-Luxury Materials
Sustainability is shaping product innovation across the Luxury Tableware Market. Brands are incorporating eco-luxury materials such as recycled glass, ethically sourced porcelain, and lead-free crystal. It supports the rising preference for responsible luxury among consumers. Sustainable tableware reflects environmental values without compromising aesthetics or quality. Manufacturers invest in advanced eco-production techniques to meet consumer expectations. Heritage brands are introducing collections with transparent sourcing practices. This approach helps retain loyal customers and attract eco-conscious buyers. The trend aligns luxury consumption with environmental responsibility.
- For instance, Villeroy & Boch received the EcoVadis Platinum Medal in September 2025, ranking among the top 1% of over 150,000 companies evaluated worldwide for sustainability performance. The recognition highlights the company’s strong commitment to environmental and social responsibility within the luxury tableware industry.
Digital Commerce Expansion and Omnichannel Retail Strategies
E-commerce is transforming how premium tableware reaches consumers. Luxury brands are building strong online stores and partnering with luxury marketplaces. It allows easy access to exclusive collections for a global customer base. Omnichannel strategies combine immersive in-store experiences with seamless digital transactions. Virtual showrooms and augmented reality tools enhance product presentation. Online platforms enable personalized recommendations and customization options. Consumers appreciate flexible and direct purchasing methods. This shift drives competitive advantage for brands with strong digital presence. It also improves global reach and brand recognition.
Collaboration Between Luxury Brands and Hospitality Chains
Collaborations between luxury tableware manufacturers and hospitality groups are strengthening market positioning. Exclusive partnerships create signature collections for hotels and restaurants. It ensures consistent quality and enhances the guest experience. Hospitality chains seek distinct and elegant designs to maintain their brand identity. Such collaborations lead to bulk purchasing contracts and long-term supplier relationships. Brands benefit from increased visibility in high-traffic venues. These partnerships help reinforce brand exclusivity. They also enable co-branding opportunities in new markets. This approach builds sustained demand within the hospitality sector.
- For instance, Accor Hotels’ 2024 Sustainability and Growth Report confirmed that 36% of its hotels were eco-certified and highlighted ongoing efforts to strengthen sustainability across its global portfolio. The report also emphasized portfolio expansion and enhanced partnerships supporting premium guest experiences in luxury hospitality.
Design Innovation and Cultural Fusion in Product Development
Design innovation is emerging as a central trend across the market. Brands are blending traditional craftsmanship with modern aesthetics to appeal to diverse consumers. It supports evolving lifestyle trends and global cultural influences. Collections showcase minimalist, contemporary, and heritage-inspired patterns. Manufacturers explore new textures, finishes, and color palettes to stay ahead. Cross-cultural influences allow brands to reach varied geographic markets. Creative collaborations with designers and artists increase product uniqueness. This approach strengthens brand identity and drives higher consumer engagement.
Market Challenges Analysis
High Product Cost and Limited Affordability for Wider Consumer Segments
The premium nature of luxury tableware leads to high manufacturing and retail costs. Handcrafted materials, fine finishing, and exclusive branding significantly increase prices. It limits the customer base primarily to high-income groups and luxury buyers. Economic fluctuations influence spending on non-essential premium products. Many consumers choose affordable alternatives despite appreciating the craftsmanship. This cost barrier restricts large-scale market penetration. Retailers face challenges in balancing pricing and brand positioning. It also slows down growth in price-sensitive regions.
Counterfeit Products and Intense Competition Among Luxury Brands
The presence of counterfeit products impacts brand reputation and consumer trust. Fake items mimic premium designs at lower costs, misleading buyers. It creates pricing pressure for authentic luxury brands. Intense competition among global and regional players increases marketing expenses. New entrants often disrupt established pricing structures. Brand differentiation becomes more challenging in saturated segments. Protecting intellectual property remains a priority for premium manufacturers. This challenge affects long-term revenue stability and customer loyalty.
Market Opportunities
Expansion in Emerging Economies with Rising Disposable Incomes
Emerging economies offer promising opportunities for market expansion. Rising income levels in Asia Pacific, Middle East, and Latin America are driving demand for luxury lifestyle products. It benefits from growing consumer awareness of global brands. Expanding retail infrastructure supports stronger brand penetration. Younger affluent consumers are showing interest in premium home décor and fine dining. Brands entering these markets can leverage local collaborations to scale faster. This opportunity allows companies to build new revenue streams. Early market entry strengthens long-term competitive positioning.
Product Personalization and Bespoke Design Services for Premium Consumers
Personalization is becoming a key differentiator for luxury tableware brands. Consumers value unique, handcrafted designs tailored to their preferences. It creates deeper emotional connections and brand loyalty. Bespoke collections for weddings, corporate gifting, and high-profile events are gaining traction. Advanced digital tools enable quick customization without compromising quality. Premium packaging further enhances the gifting appeal. This opportunity helps brands expand customer engagement strategies. It also supports higher pricing margins through exclusivity.
Market Segmentation Analysis:
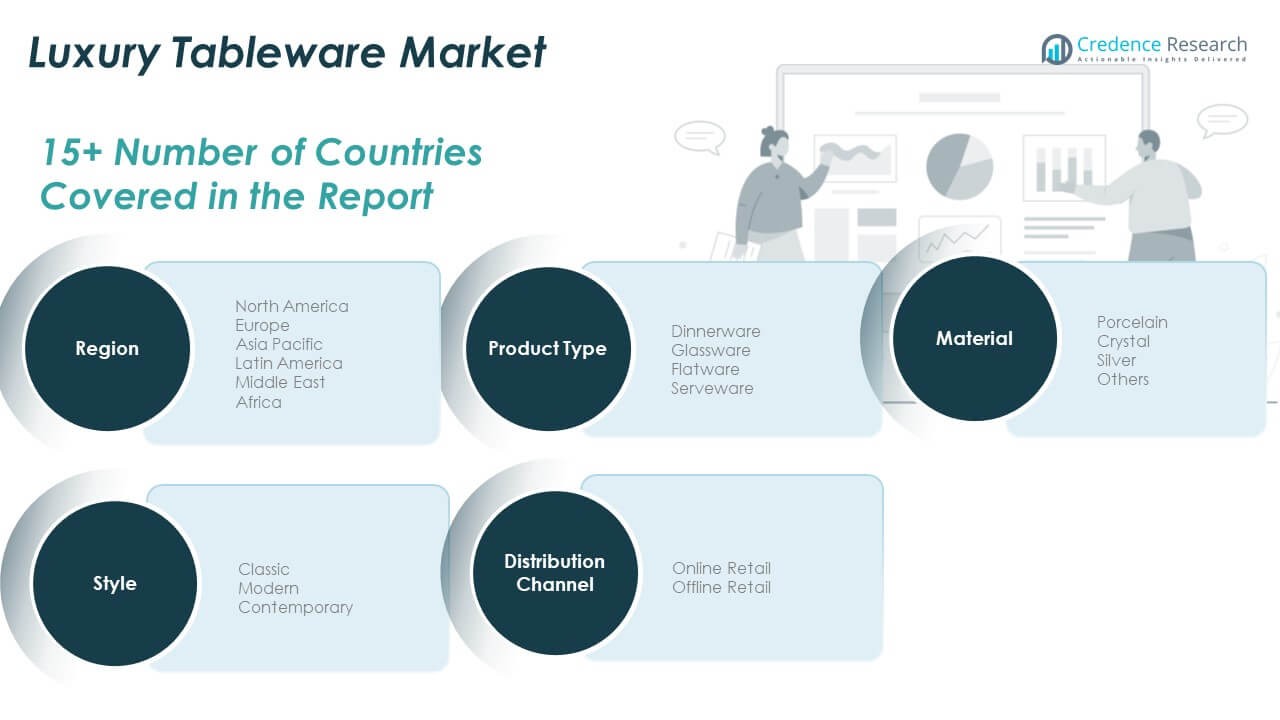
The Luxury Tableware Market is segmented by product type, style, material, and distribution channel.
By product type, dinnerware holds a major share due to strong demand from households, hotels, and restaurants. Glassware and flatware follow, driven by their role in enhancing table aesthetics and functionality. Serveware is gaining traction in premium hospitality and gifting applications, supported by design diversity and brand collaborations. It continues to benefit from growing demand for coordinated luxury dining sets that reflect sophistication and lifestyle appeal.
By style, the market includes classic, modern, and contemporary designs. Classic collections remain popular among consumers valuing tradition and elegance, while modern and contemporary styles appeal to younger demographics seeking minimalist aesthetics.
By material, porcelain leads due to its fine finish and durability, followed by crystal and silver, which symbolize exclusivity and refinement. Other materials such as bone china and premium ceramics are gaining attention for their sustainability and design flexibility.
- For instance, Herend Porcelain Manufactory uses centuries-old handcrafted porcelain techniques combined with modern technology, as detailed in their official manufacturing insights published in 2025, emphasizing multi-step firing processes around 950°C and 1400°C to achieve flawless glaze and durability.
By distribution channel, offline retail dominates due to brand showrooms and luxury department stores offering personalized experiences. Online retail is growing rapidly with the expansion of e-commerce and digital showrooms that offer accessibility to global luxury buyers. It benefits from virtual visualization and customization tools, encouraging direct engagement with premium customers. The segment structure highlights how shifting lifestyle preferences and digital integration are reshaping purchasing behavior within the luxury tableware sector.
- For instance, Waterford is recognized for using advanced digital visualization and design tools to showcase its premium crystal collections online. The brand’s digital showroom experience enhances customer engagement and supports personalized product selection within the luxury crystal segment.
Segmentation:
By Product Type:
- Dinnerware
- Glassware
- Flatware
- Serveware
By Style:
- Classic
- Modern
- Contemporary
By Material:
- Porcelain
- Crystal
- Silver
- Others
By Distribution Channel:
- Online Retail
- Offline Retail
By Region:
- North America (U.S., Canada, Mexico)
- Europe (UK, France, Germany, Italy, Spain, Russia, Rest of Europe)
- Asia Pacific (China, Japan, South Korea, India, Australia, Southeast Asia, Rest of Asia Pacific)
- Latin America (Brazil, Argentina, Rest of Latin America)
- Middle East (GCC Countries, Israel, Turkey, Rest of Middle East)
- Africa (South Africa, Egypt, Rest of Africa)
Regional Analysis:
North America
The North America Luxury Tableware Market size was valued at USD 7,305.90 million in 2018 to USD 8,430.85 million in 2024 and is anticipated to reach USD 12,528.97 million by 2032, at a CAGR of 5.2% during the forecast period. North America accounts for 33.9% of the global market share. The region benefits from high disposable incomes, strong dining culture, and preference for premium lifestyle products. It is driven by luxury dining trends, hotel expansions, and affluent consumer spending. The U.S. dominates due to the presence of established brands, designer collaborations, and growing online retail. Canada and Mexico show steady growth supported by urban lifestyle shifts and rising e-commerce adoption. Premium gifting and event-driven purchases continue to support sales. The region remains a major hub for innovation in design and sustainable production.
Europe
The Europe Luxury Tableware Market size was valued at USD 8,221.80 million in 2018 to USD 9,356.59 million in 2024 and is anticipated to reach USD 13,405.39 million by 2032, at a CAGR of 4.7% during the forecast period. Europe holds 37.4% of the global market share. The region leads the market due to its heritage brands, fine craftsmanship, and long-established luxury culture. It benefits from strong domestic demand and a thriving hospitality industry. Germany, France, and the U.K. represent key markets emphasizing high-end aesthetics and tradition. Italian and French manufacturers dominate global exports, reflecting design excellence and brand equity. Demand for eco-luxury materials and sustainable production techniques is rising. Retail innovation and digital expansion across Europe further enhance brand accessibility and consumer engagement.
Asia Pacific
The Asia Pacific Luxury Tableware Market size was valued at USD 3,578.40 million in 2018 to USD 4,453.19 million in 2024 and is anticipated to reach USD 7,607.79 million by 2032, at a CAGR of 7.0% during the forecast period. Asia Pacific holds 21.0% of the global market share. The region is the fastest-growing due to increasing disposable incomes and urbanization. China, Japan, and India are leading markets driven by changing lifestyles and luxury awareness. It benefits from local craftsmanship blending with global design trends. The hospitality sector in Southeast Asia and Australia also supports demand through hotel and restaurant expansions. E-commerce penetration enables cross-border luxury purchases. The growing preference for premium gifting and modern dining aesthetics enhances long-term market potential across the region.
Latin America
The Latin America Luxury Tableware Market size was valued at USD 1,384.50 million in 2018 to USD 1,603.28 million in 2024 and is anticipated to reach USD 2,218.59 million by 2032, at a CAGR of 4.2% during the forecast period. Latin America contributes 6.0% of the global market share. The region’s growth is supported by a rising middle class and gradual luxury adoption in urban centers. Brazil and Mexico dominate sales through expanding hospitality industries and boutique retail growth. It benefits from increasing international brand presence and growing exposure to luxury dining culture. Demand for fine dining products is growing among younger consumers. Local artisans are also entering the premium tableware space through handcrafted collections. Despite economic fluctuations, consistent investment in retail infrastructure supports future expansion.
Middle East
The Middle East Luxury Tableware Market size was valued at USD 596.40 million in 2018 to USD 637.27 million in 2024 and is anticipated to reach USD 819.16 million by 2032, at a CAGR of 3.3% during the forecast period. The region holds 2.3% of the global market share. It is driven by strong hospitality investments, particularly in the UAE, Saudi Arabia, and Qatar. High-end hotels and luxury dining venues drive procurement of premium tableware. Cultural preference for elegant presentation strengthens market appeal. The luxury retail sector in Dubai and Riyadh supports global brand visibility. Expansion of fine dining and event-driven markets enhances opportunities. Increasing adoption of European luxury brands fuels regional growth. Continuous tourism development projects add further momentum to market demand.
Africa
The Africa Luxury Tableware Market size was valued at USD 213.00 million in 2018 to USD 418.41 million in 2024 and is anticipated to reach USD 476.89 million by 2032, at a CAGR of 1.0% during the forecast period. Africa accounts for 1.4% of the global market share. The region remains in its early growth phase due to limited purchasing power and low luxury penetration. South Africa leads regional demand driven by hospitality and lifestyle segments. It experiences gradual improvement through urban retail development and expanding international brand presence. Local artisanship and handmade products show potential in premium niche segments. Rising tourism in Kenya and Egypt supports hotel-based procurement. Despite infrastructural challenges, increasing exposure to global luxury culture encourages steady long-term development.
Shape Your Report to Specific Countries or Regions & Enjoy 30% Off!
Key Player Analysis:
- Fornasetti
- Gien
- Minton
- Noritake
- Oneida
- Rosenthal
- Gorham
- Juliska
- Kate Spade
- Alessi
- Christofle
- Corelle
- Michael Aram
Competitive Analysis:
The Luxury Tableware Market features a competitive environment driven by brand heritage, design innovation, and craftsmanship. Leading companies such as Fornasetti, Rosenthal, Christofle, Alessi, Noritake, and Minton emphasize artisanal quality and premium aesthetics to strengthen brand identity. It maintains competitiveness through consistent product innovation and limited-edition collections that appeal to affluent consumers. Strategic collaborations between designers and manufacturers enhance exclusivity and brand visibility. Mergers, acquisitions, and product diversification support geographic expansion and market penetration. Sustainability-focused initiatives, including eco-friendly materials and ethical sourcing, are gaining prominence among major players. Online retail and direct-to-consumer channels have intensified competition by broadening access to luxury brands. The market’s success depends on balancing traditional craftsmanship with evolving consumer preferences and digital retail transformation.
Recent Developments:
- In September 2025, Solecasa presented its newest luxury tableware collections at the 138th Canton Fair, showcasing the brand’s fusion of traditional craftsmanship with modern design. This move not only reinforces Solecasa’s commitment to innovation but also enhances its international visibility among upscale buyers looking for exclusivity and quality.
- In June 2025, Gien launched an innovative collaboration with French designer Marine Serre, introducing an upcycled tableware capsule collection that brings together Gien’s heritage craftsmanship and Serre’s signature crescent moon motif. This partnership produced a unique line including dinner plates, dessert plates, coffee cups with saucers, and mugs, all crafted in Gien’s French workshops using locally sourced materials.
Report Coverage:
The research report offers an in-depth analysis based on Product Type, Style, Material and Distribution Channel. It details leading market players, providing an overview of their business, product offerings, investments, revenue streams, and key applications. Additionally, the report includes insights into the competitive environment, SWOT analysis, current market trends, as well as the primary drivers and constraints. Furthermore, it discusses various factors that have driven market expansion in recent years. The report also explores market dynamics, regulatory scenarios, and technological advancements that are shaping the industry. It assesses the impact of external factors and global economic changes on market growth. Lastly, it provides strategic recommendations for new entrants and established companies to navigate the complexities of the market.
Future Outlook:
- The Luxury Tableware Market will expand steadily with rising global demand for premium dining experiences.
- Growth will be driven by the hospitality sector’s emphasis on luxury presentation and brand exclusivity.
- Consumer interest in sustainable, eco-luxury materials will influence future product development.
- Digital retail platforms will enhance accessibility, offering personalized and virtual shopping experiences.
- Collaborations between designers and manufacturers will strengthen innovation and aesthetic diversity.
- Evolving gifting culture and event-based purchases will increase product visibility and seasonal sales.
- Emerging economies will provide new opportunities through rising disposable incomes and urbanization.
- The market will see greater adoption of smart packaging and traceable production practices.
- Heritage brands will leverage technology to preserve craftsmanship while appealing to modern consumers.
- Continuous investment in marketing and experiential retail will reinforce customer loyalty and global brand reach.


