
| REPORT ATTRIBUTE | DETAILS |
|---|---|
| Historical Period | 2019-2022 |
| Base Year | 2023 |
| Forecast Period | 2024-2032 |
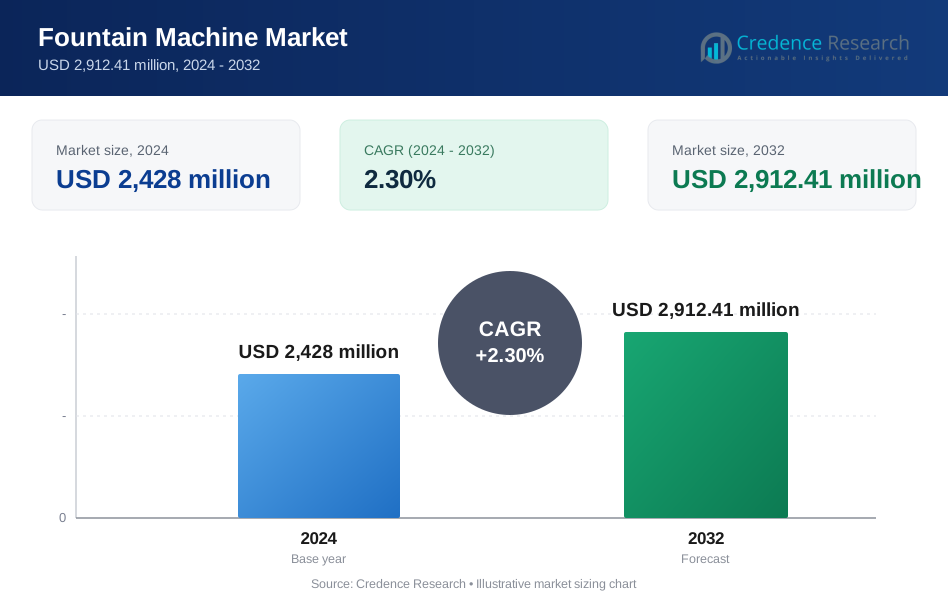
| Fountain Machine Market Size 2024 | USD 2,428 million |
| Fountain Machine Market , CAGR | 2.3% |
| Fountain Machine Market Size 2032 | USD 2,912.41 million |
Market Overview:
The Fountain Machine Market is projected to grow from USD 2,428 million in 2024 to USD 2,912.41 million by 2032, registering a compound annual growth rate (CAGR) of 2.3% over the forecast period. This growth is primarily driven by the increasing demand for convenient and on-the-go beverage options across fast-food chains, cinemas, convenience stores, and restaurants. Fountain machines offer customizable beverage options and cost-effectiveness, appealing to both consumers and businesses. Their ability to deliver a variety of flavors through a single machine enhances operational efficiency and meets diverse customer preferences, contributing to steady market growth.
Market drivers include evolving consumer preferences towards customizable and healthier beverage options, which have led to the adoption of advanced fountain machines with flavor-mixing capabilities and low-calorie alternatives. The growing trend of quick-service restaurants and expanding retail chains globally further boosts demand for fountain machines. Technological advancements, such as touchless and automated dispensing systems, provide improved hygiene, operational efficiency, and a more engaging customer experience. Additionally, increased focus on reducing packaging waste aligns with sustainable initiatives, making fountain machines a preferred choice for businesses looking to minimize single-use plastic consumption.
Regionally, North America dominates the market, accounting for the largest share due to the well-established fast-food and quick-service restaurant industry. High consumer demand for soft drinks and innovative beverage offerings drives market expansion in this region. Europe follows, driven by a strong foodservice sector and increasing consumer demand for healthier, sugar-free, and customizable beverages. The Asia-Pacific region is expected to witness the fastest growth, fueled by rising disposable incomes, urbanization, and the rapid proliferation of quick-service restaurant chains in countries like China and India. Latin America and the Middle East & Africa regions present growth opportunities due to increasing adoption of fountain machines in emerging foodservice markets and growing awareness of beverage customization trends.
Market Drivers:
Sustainability and Environmental Consciousness:
The fountain machine market is experiencing significant growth driven by increasing environmental awareness and sustainability initiatives. According to the National Automatic Merchandising Association, fountain machines can reduce carbon emissions by up to 75 percent compared to traditional beverage dispensing methods. Businesses are increasingly adopting these systems to meet consumer demand for eco-friendly solutions, with Forbes reporting that 88% of consumers want companies to help them be more environmentally responsible. The elimination of single-use plastic bottles and reduced packaging waste are critical factors driving market adoption. For instance, Fountain machines can reduce carbon emissions by up to 75% compared to traditional vending machines. A typical operation serving 100 cups daily can save up to 547.5 pounds of CO2 emissions annually by using reusable cups. Using paper cups instead of plastic can reduce carbon footprint by 328.5 pounds per year.
Consumer Preference and Beverage Customization:
Evolving consumer preferences are transforming the fountain machine market, with a growing demand for diverse and customizable beverage options. Recent industry research indicates a significant shift towards non-carbonated beverages, including juices, teas, and sparkling water. ADM's market analysis reveals that 77% of consumers intend to make more attempts to stay healthy in the future, driving innovation in beverage offerings. For instance, Beverages now account for over 40% of hospitality business revenues, with healthy beverages emerging as the fastest-growing category. The industry offers various non-carbonated options including unsweetened and sweetened tea, lemonade, energy drinks, juices, flavored water, and sports drinks. Restaurants and food service establishments are responding by expanding fountain machine capabilities to include health-conscious options, with less than 2% of consumers considering sugar-free drinks as healthy alternatives. Restaurants and food service establishments are responding by expanding fountain machine capabilities to include health-conscious options like Gatorade, sparkling water, and specialty tea selections, meeting the growing consumer desire for personalized and nutritious drink experiences.
Technological Innovation and Operational Efficiency:
Advanced technological integration is propelling fountain machine market growth, with manufacturers developing sophisticated systems that enhance operational efficiency. Modern fountain machines incorporate touch-screen interfaces, automated cleaning systems, and precise beverage mixing mechanisms. The food service industry has reported that these advanced systems contribute to improved customer engagement, with approximately 33.5% of beverage services now utilizing semi-automated dispensing technologies. Energy-efficient designs are also a key driver, with studies showing potential energy cost savings of up to 30% compared to traditional beverage dispensing methods.
Economic and Operational Benefits:
The fountain machine market is driven by significant economic advantages for businesses across various sectors. Restaurants and food service establishments are recognizing the cost-effectiveness of fountain machines, which offer lower per-serving costs and reduced inventory management challenges. The ability to mix flavors, control serving sizes, and provide diverse beverage options has become a critical factor in operational decision-making. Additionally, the versatility of modern fountain machines extends beyond traditional restaurant settings, with applications emerging in healthcare facilities, educational institutions, and entertainment venues, further expanding market potential.
Market Trends:
Technological Innovation and Customization:
Modern fountain machines are experiencing significant technological advancements that transform beverage experiences. SodaStream's E-Terra electric sparkling water makers demonstrate the industry's shift towards sophisticated, user-friendly technologies. The North American market has seen automated fountain dispensers account for 63.3% of market share in 2022, with advanced features including touch-screen interfaces, automated cleaning systems, and precise beverage mixing mechanisms. For instance, Automated cleaning systems streamline maintenance processes while ensuring proper hygiene standards. These technologies enable seamless integration with point-of-sale systems, inventory management software, and mobile applications, creating an efficient beverage service ecosystem. These technologies enable consumers to customize drink selections, with some machines offering up to 20 different flavor combinations and adjustable carbonation levels.
Sustainability and Environmental Consciousness:
Fountain machines are emerging as an eco-friendly beverage solution, with potential carbon emissions reductions of up to 75 percent compared to traditional dispensing methods. The National Automatic Merchandising Association reports significant environmental benefits, including waste reduction and energy efficiency. Modern machines can save up to 30% in energy costs, incorporating features like LED lighting and low-energy motors. Forbes research indicates that 88% of consumers want companies to help them be more environmentally responsible, driving the adoption of more sustainable beverage dispensing technologies. For instance, using reusable cups in a 100-cup-per-day operation can save up to 547.5 pounds of CO2 emissions annually, while paper cup usage can reduce carbon footprint by up to 328.5 pounds per year. Modern machines incorporate energy-efficient features like LED lighting and low-energy motors, contributing to 30% energy cost savings.
Emerging Market Applications:
The fountain machine market is expanding beyond traditional food service sectors, with applications emerging in diverse environments. Semi-automated fountain dispensers are projected to grow, particularly in fast-food chains, movie theaters, and convenience stores. The COVID-19 pandemic has accelerated home-based beverage solutions, with compact fountain machines becoming increasingly popular in residential settings. Brands like SodaStream and Mr. Butler are developing compact models that offer professional-grade beverage customization for home use, with some models supporting up to 15 different flavor profiles.
Consumer Preference and Health Consciousness:
Beverage companies are responding to evolving consumer preferences by introducing innovative fountain machine capabilities. The market is witnessing a shift towards healthier beverage options, with machines now offering flavored sparkling waters, natural essence-infused drinks, and low-sugar alternatives. Advanced machines can now provide nutritional information, track beverage consumption, and offer personalized drink recommendations. The integration of smart technologies allows for real-time monitoring of beverage preferences, enabling businesses to adapt their offerings to changing consumer tastes and health-conscious trends.
Market Challenges Analysis:
Regulatory Challenges:
The Fountain Machine Market faces stringent regulations imposed by authorities such as the U.S. Food and Drug Administration (FDA) and the European Food Safety Authority (EFSA), which govern food and beverage dispensing equipment. Ensuring compliance with health, hygiene, and food safety standards increases production and operational costs for manufacturers. Adhering to these strict criteria, particularly in maintaining product integrity and preventing contamination, remains critical to market participation.
Declining Demand for Sugary Beverages:
Rising consumer awareness of health and wellness has led to a decline in the consumption of sugary soft drinks, traditionally associated with fountain machines. This shift forces manufacturers to diversify their offerings by developing healthier, low-calorie, and customizable beverage options, which adds complexity and costs to the product development process.
High Initial and Maintenance Costs:
Fountain machines require significant initial investment and ongoing maintenance costs, posing a barrier for smaller foodservice establishments with limited budgets. This financial constraint may deter some businesses from adopting fountain machines, impacting overall market growth.
Competition from Ready-to-Drink Beverages:
The market faces strong competition from ready-to-drink (RTD) beverages, which offer convenience and portability without the need for specialized equipment. This trend may reduce the demand for fountain machines, particularly in on-the-go and convenience-focused segments.
Technological and Cost Pressures:
While advancements in touchless and automated dispensing systems address consumer concerns regarding hygiene, they also require significant investment, increasing the financial burden on businesses. Additionally, supply chain disruptions, fluctuating raw material costs, and evolving consumer preferences create further market uncertainties that must be managed effectively to sustain growth.
Market Segmentation Analysis:
By Type, the market comprises drop-in fountain machines, countertop fountain machines, and freestanding fountain machines. Drop-in machines are integrated into counters and provide a sleek, space-saving design often used in fast-food restaurants and cafes. Countertop machines are compact and suitable for limited-space environments such as convenience stores. Freestanding machines, with higher capacity and versatility, are popular in high-traffic locations like cinemas and large restaurants.
By Technology, the market is categorized into manual and automatic fountain machines. Automatic machines, equipped with advanced features such as touchless dispensing and flavor customization, are increasingly favored for their convenience and enhanced hygiene. Manual machines remain relevant in cost-sensitive markets and smaller establishments due to their affordability and ease of operation.
By End User, the market serves restaurants, fast-food chains, convenience stores, cinemas, and institutional facilities. Fast-food chains and restaurants hold the largest market share, driven by high demand for customizable beverage offerings and rapid service capabilities. Convenience stores and cinemas also play a vital role in market growth, leveraging fountain machines to enhance customer experience and increase beverage sales. Institutional facilities, including hospitals and schools, use fountain machines to provide accessible beverage solutions to a wide audience.
Segmentations:
By Product
- Drop-In FM
- Tower FM
By Application
- Restaurant
- Cinema
- Others (Convenience Stores, Cafeteria, etc.)
Regional
- North America
- U.S.
- Canada
- Mexico
- Europe
- Germany
- France
- U.K.
- Italy
- Spain
- Rest of Europe
- Asia Pacific
- China
- Japan
- India
- South Korea
- South-east Asia
- Rest of Asia Pacific
- Latin America
- Brazil
- Argentina
- Rest of Latin America
- Middle East & Africa
- GCC Countries
- South Africa
- Rest of the Middle East and Africa
Regional Analysis:
North America region holds the largest share of the Fountain Machine Market, accounting for approximately 40% of the global market. This dominance is driven by the well-established foodservice industry, which includes a vast network of fast-food chains, quick-service restaurants, and convenience stores. The United States leads in this region, with strong consumer demand for customizable beverage options and a growing focus on advanced dispensing technologies, including touchless and automated systems. High disposable income and evolving consumer preferences toward healthier, customizable beverage offerings further drive market growth. Canada also contributes significantly due to its expanding quick-service restaurant sector and a rising trend of on-the-go consumption.
Europe represents around 25% of the market share, driven by a robust food and beverage sector and high demand for innovative, health-conscious beverage solutions. The market in this region benefits from the presence of established foodservice operators and a strong focus on sustainability and eco-friendly packaging solutions. Countries like the United Kingdom, Germany, and France lead in terms of adoption, supported by increasing consumer demand for sugar-free and customizable beverage options.
Asia-Pacific region accounts for approximately 20% of the global market and is expected to experience significant growth during the forecast period. The rapid proliferation of quick-service restaurants, increasing disposable incomes, and urbanization contribute to rising demand for fountain machines. Countries such as China, India, and Japan are at the forefront, supported by a growing trend of dining out and the adoption of advanced beverage dispensing technologies. The region's focus on innovation and convenience in the foodservice sector further drives market expansion.
Latin America and the Middle East & Africa together account for the remaining 15% of the market share. In Latin America, countries such as Brazil and Mexico are witnessing growth in the adoption of fountain machines, fueled by an expanding quick-service restaurant industry and a rising middle class with increasing purchasing power. In the MEA region, market growth is driven by improving economic conditions, the expansion of modern retail formats, and increasing consumer demand for convenient beverage solutions. Rising awareness of customized beverage options and growing investments in foodservice infrastructure present additional growth opportunities for market participants in these regions.
Key Player Analysis:
- The Coca-Cola Company
- PepsiCo, Inc.
- Cornelius, Inc.
- Lancer Corporation
- Manitowoc Beverage Systems
- Himalay Soda Fountain
- Planet Soda Machine
- Cool Star
- Softy and Soda
- Zikool
Competitive Analysis:
The Fountain Machine Market is characterized by intense competition among key global and regional players, driven by the demand for advanced beverage dispensing solutions and increasing consumer preference for customizable drink options. Major players such as The Coca-Cola Company, PepsiCo, and Cornelius, Inc. maintain their market leadership through extensive product portfolios, strong brand recognition, and expansive distribution networks. These companies focus on continuous innovation, integrating technologies such as touchless dispensing, flavor customization, and automated systems to meet evolving consumer demands and enhance customer experience. Smaller and regional players, including Lancer Corporation and Cool Star, compete by offering cost-effective and niche solutions tailored to specific market needs. Competitive pressures are heightened by regulatory compliance requirements, sustainability concerns, and the need to improve operational efficiency. Strategic collaborations, product differentiation, and technological advancements remain key strategies for market participants to strengthen their position and capture emerging opportunities.
Recent Developments:
- In 2023 Coca-Cola unveiled the Freestyle 9100, an advanced beverage dispenser featuring a 24-inch touchscreen and Bluetooth connectivity. This innovation allows consumers to customize drinks via a mobile app, enhancing user experience and operational efficiency.
- In 2022 PepsiCo expanded its Spire platform, introducing new models with touchless dispensing capabilities. These machines enable consumers to pour beverages without physical contact, addressing heightened hygiene concerns and adapting to evolving consumer preferences.
- In 2023 Cornelius Inc. introduced IntelliPour, a smart dispensing system equipped with IoT capabilities. This system offers real-time monitoring of inventory levels and maintenance needs, allowing businesses to optimize operations and reduce downtime.
- In 2024 Lancer Corporation developed a line of eco-friendly fountain machines designed to reduce energy consumption and utilize sustainable materials. These models cater to environmentally conscious consumers and support businesses in achieving sustainability goals.
Market Concentration & Characteristics:
The Fountain Machine Market exhibits moderate to high market concentration, with a few major players such as The Coca-Cola Company, PepsiCo, and Cornelius, Inc. dominating the industry. These key players maintain strong market positions through extensive distribution networks, robust brand recognition, and continuous product innovation. The market is characterized by rapid technological advancements, such as touchless and automated dispensing systems, which enhance consumer convenience and hygiene. High barriers to entry, including significant capital investments and stringent regulatory requirements for food safety and hygiene, further solidify the market dominance of established companies. Competitive pressures from smaller regional players, however, drive innovation, especially in niche and cost-effective solutions. The market also emphasizes customization, efficiency, and sustainability, with increasing demand for eco-friendly machines and health-conscious beverage options. Overall, continuous technological advancements and adherence to consumer trends and regulatory standards define the market landscape.
Report Coverage:
The research report offers an in-depth analysis based on Product, Application, and Region. It details leading market players, providing an overview of their business, product offerings, investments, revenue streams, and key applications. Additionally, the report includes insights into the competitive environment, SWOT analysis, current market trends, as well as the primary drivers and constraints. Furthermore, it discusses various factors that have driven market expansion in recent years. The report also explores market dynamics, regulatory scenarios, and technological advancements that are shaping the industry. It assesses the impact of external factors and global economic changes on market growth. Lastly, it provides strategic recommendations for new entrants and established companies to navigate the complexities of the market.
Future Outlook:
- The market will continue to grow as consumer demand for on-the-go and customizable beverage options increases across fast-food chains and convenience stores.
- Advancements in touchless and automated dispensing technologies will drive innovation, improving hygiene and enhancing the overall user experience.
- Rising consumer preferences for healthier, low-calorie, and sugar-free beverages will lead to further diversification of fountain machine offerings.
- Expansion of quick-service and fast-casual restaurant chains in emerging markets will provide significant growth opportunities for fountain machine manufacturers.
- Integration of IoT capabilities and smart technologies will enable real-time monitoring, predictive maintenance, and enhanced operational efficiency for businesses.
- Eco-friendly and energy-efficient models will gain prominence, aligning with sustainability initiatives and consumer demand for environmentally conscious products.
- Increasing regulatory scrutiny on food safety and hygiene standards will drive the development of advanced compliance solutions for fountain machines.
- Strategic partnerships and collaborations among key players will foster innovation and broaden market reach, enabling customized and tailored solutions for diverse markets.
- Intense competition from ready-to-drink (RTD) beverages will require companies to continuously innovate and differentiate their offerings.
- Growth in urbanization and rising disposable incomes in developing regions will accelerate market demand for convenient and flexible beverage dispensing solutions.
Request a Free Sample
Fill in your details and we'll send you a free sample report.
- Sample data tables & charts
- Research methodology
Market Dynamics
Sustainability and Environmental Consciousness
Businesses are increasingly adopting fountain machines to reduce single-use plastic waste and carbon emissions, aligning with consumer demand for eco-friendly beverage solutions and supporting corporate sustainability initiatives.
Consumer Preference for Customization and Healthier Options
The shift towards customizable and healthier beverages, including low-calorie and sugar-free options, is driving foodservice operators to invest in advanced fountain machines with flavor-mixing and health-oriented capabilities.
Technological Innovation and Automation
Integration of touchless dispensing, IoT-enabled monitoring, and automated cleaning systems enhances hygiene, operational efficiency, and customer engagement, making fountain machines more attractive to operators and consumers.
Expansion of Quick-Service and Fast-Casual Chains
The global proliferation of fast-food and quick-service restaurants, especially in emerging markets, is increasing the demand for high-capacity, efficient beverage dispensing solutions like fountain machines.
Economic and Operational Benefits for Businesses
Fountain machines offer lower per-serving costs, reduced inventory complexity, and the ability to serve a wide variety of beverages from a single unit, making them a cost-effective and versatile solution for restaurants, cinemas, and institutional facilities.
Need a Custom Version of This Report?
Tailor the scope, geography, or segments to your exact requirements.
- Custom geography or segment scope
- Direct access to our analyst team
Frequently Asked Questions
What is the current size of the Fountain Machine Market?
What factors are driving the growth of the Fountain Machine Market?
What are some challenges faced by the Fountain Machine Market?
Who are the major players in the Fountain Machine Market?
Which segment is leading the market share?
Table of Content
Chapter 1 Market Segmentation
- 1.1 Segmentation Framework
- 1.1.1 Product and Service Classification
- 1.1.2 Application and End-Use Classification
- 1.1.3 Technology and Solution Classification
- 1.1.4 Customer and Distribution Channel Classification
- 1.1.5 Geographic Segmentation
- 1.1.6 Market Segment Definitions and Boundaries
- 1.2 By Product
- 1.2.1 Drop-In FM
- 1.2.2 Tower FM
- 1.2.3 Countertop FM
- 1.2.4 Freestanding FM
- 1.3 By Technology
- 1.3.1 Manual Fountain Machines
- 1.3.2 Automatic Fountain Machines
- 1.3.3 Semi-Automatic Fountain Machines
- 1.4 By Application
- 1.4.1 Restaurant
- 1.4.2 Cinema
- 1.4.3 Convenience Stores
- 1.4.4 Cafeteria
- 1.4.5 Institutional Facilities
Chapter 2 Introduction
- 2.1 Report Objectives and Scope
- 2.2 Product Definition and Industry Terminology
- 2.3 Market Inclusions and Exclusions
- 2.4 Research Process
- 2.4.1 Primary Research and Expert Interviews
- 2.4.2 Secondary Research and Source Review
- 2.4.3 Top-Down and Bottom-Up Estimation
- 2.4.4 Data Triangulation and Verification
- 2.5 Market Size Measurement Basis
- 2.5.1 2024: USD 2,428 million → 2032: USD 2,912.41 million
- 2.6 Historical and Forecast Reference Periods
- 2.6.1 Base Year: 2024
- 2.6.2 Forecast Period: 2024-2032
- 2.7 Research Assumptions and Limitations
Chapter 3 Executive Summary
- 3.1 Market Snapshot and Key Findings
- 3.2 Base-Year Market Size, 2024
- 3.3 Forecast Market Size, 2032
- 3.4 Revenue and Volume Growth Outlook
- 3.5 Key Demand and Supply Indicators
- 3.6 Leading Market Segments
- 3.7 Fastest-Growing Market Opportunities
- 3.8 Regional Performance Highlights
- 3.9 Technology and Industry Transformation
- 3.10 Competitive Landscape Summary
- 3.11 Analyst View and Strategic Implications
Chapter 4 Global Fountain Machine Market Trends and Developments
- 4.1 Historical Industry Development
- 4.2 Recent Market Trends and Developments
- 4.3 Demand and Customer Behavior Trends
- 4.4 Technology and Product Innovation
- 4.5 Artificial Intelligence, Automation and Digitalization
- 4.6 Local Manufacturing and Supply Chain Realignment
- 4.7 Industry Partnerships, Mergers and Acquisitions
- 4.8 Sustainability and Circular Economy Developments
- 4.9 Government and Private Sector Investment Trends
- 4.10 Emerging Business Models and Commercialization
- 4.11 Industry Developments and Announcements
Chapter 5 Global Fountain Machine Market Production, Supply and Demand Analysis
- 5.1 Demand Trend and Consumption Analysis
- 5.2 Demand Forecast, 2024-2032
- 5.3 Production and Output Trend
- 5.4 Production and Output Forecast, 2024-2032
- 5.5 Installed Capacity and Capacity Utilization
- 5.6 Company-Wise Production Plants and Statistics
- 5.6.1 Installed Production Capacity
- 5.6.2 Actual Production
- 5.6.3 Planned Capacity and Expansion Targets
- 5.7 Supply Chain Structure and Procurement Trends
- 5.8 Supply-Demand Gap and Bottlenecks
- 5.9 Import Dependence and Sourcing Structure
- 5.10 Contract Manufacturing and Outsourcing
- 5.11 Regional Supply and Demand Concentration
Chapter 6 Global Fountain Machine Market Pricing Analysis
- 6.1 Pricing Structure and Measurement
- 6.2 Historical Pricing Trends
- 6.3 Pricing Outlook, 2024-2032
- 6.4 Average Selling Price and Unit Economics
- 6.5 Pricing by Product and Market Segment
- 6.6 Geographic Pricing Differences
- 6.7 Key Input, Energy, Labor and Logistics Costs
- 6.8 Contract Pricing and Purchasing Models
- 6.9 Pricing Sensitivity and Competitive Positioning
- 6.10 Price, Margin and Profitability Implications
Chapter 7 Global Fountain Machine Market Dynamics
- 7.1 Market Growth Drivers
- 7.1.1 Demand-Side Drivers
- 7.1.2 Technology and Innovation Drivers
- 7.1.3 Infrastructure and Investment Drivers
- 7.1.4 Regulatory and Policy Drivers
- 7.2 Market Restraints
- 7.2.1 Cost and Affordability Constraints
- 7.2.2 Technology and Adoption Barriers
- 7.2.3 Supply Chain and Operational Constraints
- 7.3 Market Challenges
- 7.3.1 Competitive Pressure and Margin Erosion
- 7.3.2 Skills, Infrastructure and Implementation Gaps
- 7.4 Emerging Market Opportunities
- 7.5 Market Dynamics Impact and Time-Horizon Assessment
Chapter 8 Global Fountain Machine Value Chain Analysis
- 8.1 Industry Value Chain Overview
- 8.2 Upstream Suppliers and Critical Inputs
- 8.3 Technology and Component Providers
- 8.4 Manufacturing or Service Delivery
- 8.5 Distribution, Channel Partners and Integrators
- 8.6 Downstream Applications and End Users
- 8.7 Value Addition and Profit Pools
- 8.8 Vertical Integration and Outsourcing
- 8.9 Supplier Concentration and Risk
- 8.10 Supply Chain Localization and Resilience
Chapter 9 Global Fountain Machine Market Regulations and Policies
- 9.1 Relevant Laws, Standards and Compliance Frameworks
- 9.2 Product, Service, Safety and Quality Requirements
- 9.3 Government Policies, Incentives and Subsidies
- 9.4 Imports, Exports and Trade Barriers
- 9.5 Public Procurement and Local Content Requirements
- 9.6 Environmental and Sustainability Compliance
- 9.7 Upcoming Policy Changes and Market Implications
Chapter 10 Global Fountain Machine Market Hotspots and Opportunities
- 10.1 Market Opportunity Mapping and Growth Hotspots
- 10.2 High-Growth Applications and Customer Groups
- 10.3 Underserved Markets and White-Space Opportunities
- 10.4 Emerging Technology and Product Opportunities
- 10.5 New Capacity and Investment Hotspots
- 10.6 Market Entry and Expansion Opportunities
- 10.7 Distribution and Partnership Opportunities
- 10.8 Near-Term and Long-Term Commercial Potential
- 10.9 Opportunity Attractiveness and Execution Risks
Chapter 11 Global Fountain Machine Market Outlook, 2024-2032
- 11.1 Market Size and Analysis
- 11.1.1 Revenue (Market Measurement: 2024: USD 2,428 million → 2032: USD 2,912.41 million)
- 11.1.2 Market Volume and Quantity Sold
- 11.1.3 Historical Market Size
- 11.1.4 Base-Year Market Size, 2024
- 11.2 Market Forecast, 2024-2032
- 11.2.1 Revenue Forecast to 2032
- 11.2.2 Volume Forecast to 2032
- 11.2.3 CAGR and Year-on-Year Growth
- 11.2.4 Incremental Revenue Opportunity
- 11.3 Forecast Assumptions and Scenario Analysis
- 11.3.1 Base-Case Forecast
- 11.3.2 Optimistic and Conservative Scenarios
- 11.3.3 Technology, Pricing and Policy Sensitivities
- 11.4 Market Attractiveness and Growth Outlook
Chapter 12 Global Fountain Machine Market Segmentation and Outlook
- 12.1 Segmentation Summary and Market Shares, 2024
- 12.2 Largest and Fastest-Growing Segments
- 12.3 By Product - Market Size and Forecast, 2024-2032
- 12.3.1 Segment Definition and Scope
- 12.3.2 Historical Market Size
- 12.3.3 Revenue Forecast, 2024-2032
- 12.3.4 Volume Forecast, 2024-2032
- 12.3.5 Base-Year Market Share, 2024
- 12.3.6 Segment CAGR and Growth Drivers
- 12.3.7 Subsegment Market Size and Forecast
- 12.3.7.1 Drop-In FM
- 12.3.7.2 Tower FM
- 12.3.7.3 Countertop FM
- 12.3.7.4 Freestanding FM
- 12.3.8 Subsegment Pricing and Adoption Trends
- 12.3.9 Leading Suppliers and Competition
- 12.3.10 Regional Demand and Opportunities
- 12.4 By Technology - Market Size and Forecast, 2024-2032
- 12.4.1 Segment Definition and Scope
- 12.4.2 Historical Market Size
- 12.4.3 Revenue Forecast, 2024-2032
- 12.4.4 Volume Forecast, 2024-2032
- 12.4.5 Base-Year Market Share, 2024
- 12.4.6 Segment CAGR and Growth Drivers
- 12.4.7 Subsegment Market Size and Forecast
- 12.4.7.1 Manual Fountain Machines
- 12.4.7.2 Automatic Fountain Machines
- 12.4.7.3 Semi-Automatic Fountain Machines
- 12.4.8 Subsegment Pricing and Adoption Trends
- 12.4.9 Leading Suppliers and Competition
- 12.4.10 Regional Demand and Opportunities
- 12.5 By Application - Market Size and Forecast, 2024-2032
- 12.5.1 Segment Definition and Scope
- 12.5.2 Historical Market Size
- 12.5.3 Revenue Forecast, 2024-2032
- 12.5.4 Volume Forecast, 2024-2032
- 12.5.5 Base-Year Market Share, 2024
- 12.5.6 Segment CAGR and Growth Drivers
- 12.5.7 Subsegment Market Size and Forecast
- 12.5.7.1 Restaurant
- 12.5.7.2 Cinema
- 12.5.7.3 Convenience Stores
- 12.5.7.4 Cafeteria
- 12.5.7.5 Institutional Facilities
- 12.5.8 Subsegment Pricing and Adoption Trends
- 12.5.9 Leading Suppliers and Competition
- 12.5.10 Regional Demand and Opportunities
- 12.6 Segment Growth Comparison
- 12.7 Segment Attractiveness and Priority Matrix
Chapter 13 Global Fountain Machine End-Use and Application Market Outlook
- 13.1 End-Use Industry and Customer Demand Structure
- 13.2 Leading Applications and Customer Groups
- 13.3 End-Use Market Size, Share and Forecast
- 13.4 Major End-Use Industry Deep Dives
- 13.4.1 Customer Requirements and Use Cases
- 13.4.2 Demand and Replacement Cycles
- 13.4.3 Technical and Regulatory Considerations
- 13.4.4 Purchasing and Procurement Models
- 13.4.5 Leading Vendors and Distribution Channels
- 13.4.6 Forecast and Commercial Opportunities
- 13.5 Emerging Applications and Cross-Segment Demand
- 13.6 End-Use Industry Investment Priorities
Chapter 14 Global Fountain Machine Geographic Market Outlook, 2024-2032
- 14.1 Regional Market Size and Share, 2024
- 14.2 Regional Market Forecast, 2024-2032
- 14.3 Regional Pricing, Production and Demand Differences
- 14.4 North America
- 14.4.1 United States
- 14.4.2 Canada
- 14.4.3 Mexico
- 14.5 Europe
- 14.5.1 Germany
- 14.5.2 France
- 14.5.3 Italy
- 14.5.4 United Kingdom
- 14.5.5 Spain
- 14.5.6 Poland
- 14.5.7 Russia
- 14.5.8 Netherlands
- 14.5.9 Belgium
- 14.5.10 Sweden
- 14.5.11 Denmark
- 14.5.12 Norway
- 14.5.13 Rest of Europe
- 14.6 Asia Pacific
- 14.6.1 China
- 14.6.2 India
- 14.6.3 Japan
- 14.6.4 South Korea
- 14.6.5 Thailand
- 14.6.6 Indonesia
- 14.6.7 Vietnam
- 14.6.8 Malaysia
- 14.6.9 Australia
- 14.6.10 Rest of Asia Pacific
- 14.7 Latin America
- 14.7.1 Brazil
- 14.7.2 Argentina
- 14.7.3 Colombia
- 14.7.4 Chile
- 14.7.5 Rest of Latin America
- 14.8 Middle East
- 14.8.1 Saudi Arabia
- 14.8.2 United Arab Emirates
- 14.8.3 Turkey
- 14.8.4 Israel
- 14.8.5 Iran
- 14.8.6 Rest of the Middle East
- 14.9 Africa
- 14.9.1 South Africa
- 14.9.2 Egypt
- 14.9.3 Nigeria
- 14.9.4 Morocco
- 14.9.5 Rest of Africa
- 14.10 Regional Investment, Policy and Supply Chain Differences
- 14.11 Regional Competitive Landscape
- 14.12 Geographic Growth Hotspots
Chapter 15 Global Fountain Machine Technology, Innovation and Sustainability Outlook
- 15.1 Technology Landscape and Maturity
- 15.2 Product, Process and Service Innovation
- 15.3 AI, Automation and Digital Tools in the Industry
- 15.4 Technology Adoption and Performance Benchmarking
- 15.5 Innovation Pipeline and R&D Investment
- 15.6 Patent and Intellectual Property Trends
- 15.7 Energy Efficiency and Resource Management
- 15.8 Sustainability, Recycling and Circularity
- 15.9 Technology Roadmap, 2024-2032
- 15.10 Risks of Obsolescence and Technology Substitution
Chapter 16 Global Fountain Machine Market Key Strategic Imperatives
- 16.1 Growth and Market Entry Priorities
- 16.2 High-Return Products and Segments
- 16.3 Pricing, Profitability and Cost Optimization
- 16.4 Technology Investment and Product Differentiation
- 16.5 Supply Chain Localization and Resilience
- 16.6 Distribution and Customer Acquisition
- 16.7 Partnership, Acquisition and Capacity Strategy
- 16.8 Regional Expansion Priorities
- 16.9 Short-, Medium- and Long-Term Actions
Chapter 17 Competition Outlook
- 17.1 Industry Competition Characteristics
- 17.2 Market Structure and Concentration
- 17.3 Market Share and Competitive Positioning, 2024
- 17.4 Company-Wise Revenue and Product Benchmarking
- 17.5 Production and Service Capacity Benchmarking
- 17.6 Technology, Pricing and Differentiation
- 17.7 Regional Footprint and Distribution Strength
- 17.8 Mergers, Acquisitions and Strategic Alliances
- 17.9 New Entrants and Competitive Threats
- 17.10 Porter's Five Forces and Industry Attractiveness
- 17.11 Competitive Outlook, 2024-2032
Chapter 18 Company Profiles
- 18.1 Company Coverage and Selection Criteria
- 18.2 The Coca-Cola Company
- 18.2.1 Business Description
- 18.2.2 Company Ownership and Geographic Presence
- 18.2.3 Product and Service Portfolio
- 18.2.4 Manufacturing and Operating Footprint
- 18.2.5 Production Capacity and Expansion Plans
- 18.2.6 Financial Performance and Investment
- 18.2.7 Market Share and Competitive Position
- 18.2.8 Technology and Innovation Capabilities
- 18.2.9 Strategic Alliances or Partnerships
- 18.2.10 Recent Developments
- 18.2.11 Growth Strategy and Outlook
- 18.3 PepsiCo, Inc.
- 18.4 Cornelius, Inc.
- 18.5 Lancer Corporation
- 18.6 Manitowoc Beverage Systems
- 18.7 Himalay Soda Fountain
- 18.8 Planet Soda Machine
- 18.9 Cool Star
- 18.10 Softy and Soda
- 18.11 Zikool
- 18.12 Other Relevant Market Participants
Note: Every listed company is profiled on the structure shown under the first company. The company list is preliminary and may change based on research findings, market developments, data availability and client requirements.
Chapter 19 Disclaimer
- 19.1 Research and Forecast Disclaimer
- 19.2 Data Source and Estimation Limitations
Note: The depth of individual sections depends on data availability for this market. Volume, capacity, trade and other unit-based metrics are included where applicable.

