Market Overview
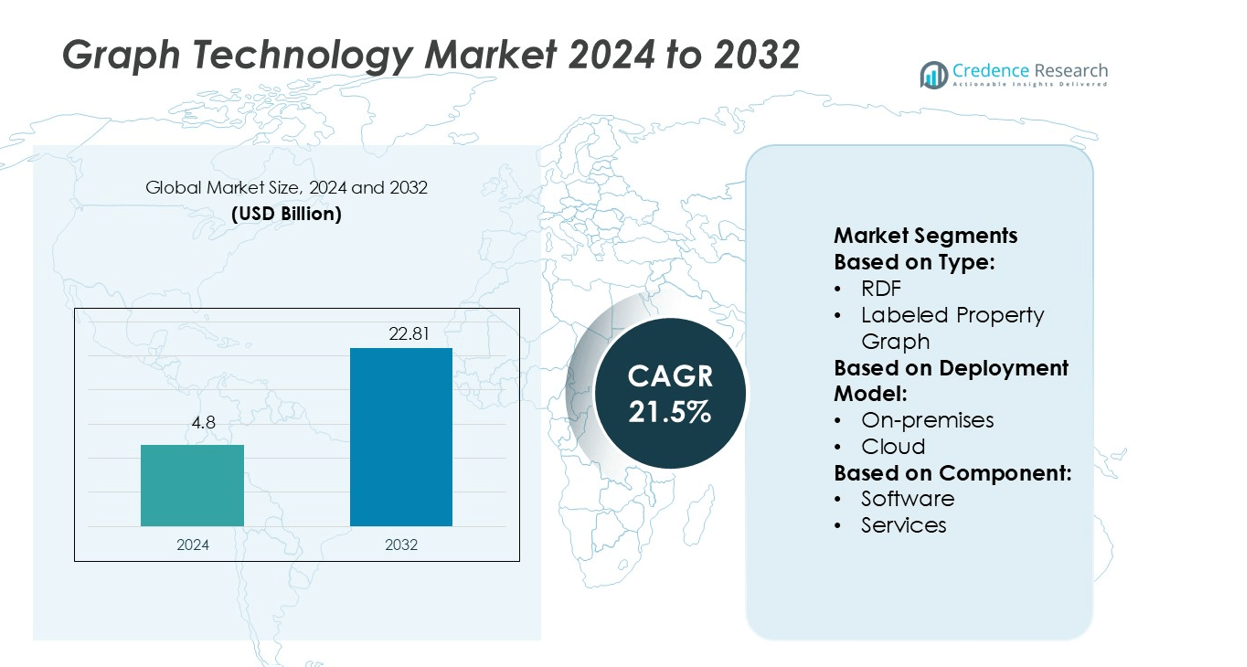
Graph Technology Market size was valued USD 4.8 billion in 2024 and is anticipated to reach USD 22.81 billion by 2032, at a CAGR of 21.5% during the forecast period.
| REPORT ATTRIBUTE |
DETAILS |
| Historical Period |
2020-2023 |
| Base Year |
2024 |
| Forecast Period |
2025-2032 |
| Graph Technology Market Size 2024 |
USD 4.8 billion |
| Graph Technology Market, CAGR |
21.5% |
| Graph Technology Market Size 2032 |
USD 22.81 billion |
The Graph Technology Market is led by major players such as TigerGraph, Oracle Corporation, DataStax, ArangoDB, Inc., Neo4j, Inc., Microsoft, Progress Software Corporation (MarkLogic), Amazon Web Services, Inc., IBM, and Stardog. These companies are advancing graph database technologies through AI integration, scalable cloud solutions, and real-time analytics capabilities. Their strategies focus on enhancing interoperability, improving query speed, and supporting complex relationship mapping across industries. North America leads the global market with a 36.4% share, driven by strong digital infrastructure, early technology adoption, and significant enterprise investments in data analytics. This regional leadership is supported by a mature cloud ecosystem and high demand for knowledge graph applications.
Market Insights
- The Graph Technology Market was valued at USD 4.8 billion in 2024 and is projected to reach USD 22.81 billion by 2032, growing at a CAGR of 21.5%.
- Rising demand for real-time analytics, AI integration, and knowledge graph applications is driving strong market growth across industries.
- Key players focus on cloud scalability, interoperability, and advanced data modeling to strengthen their competitive positions.
- High implementation costs and limited skilled professionals remain major restraints, slowing adoption in smaller enterprises.
- North America leads with a 36.4% regional share, supported by strong infrastructure and early adoption, while cloud deployment holds the dominant segment share due to its flexibility and cost efficiency.
Access crucial information at unmatched prices!
Request your sample report today & start making informed decisions powered by Credence Research Inc.!
Download Sample
Market Segmentation Analysis:
By Type
The labeled property graph segment dominates the Graph Technology Market with a 63.4% share in 2024. Its flexible structure enables developers to handle complex relationships and support advanced analytics. This format allows easier integration with AI and machine learning models, which accelerates adoption in enterprise applications. RDF maintains strong use in academic and semantic web applications but trails in scalability. Rising demand for intuitive query languages and visualization tools strengthens the preference for labeled property graphs in large-scale commercial deployments across finance, telecom, and retail industries.
- For instance, Oracle’s Property Graph engine (PGX) supports over 80 pre-built graph algorithms in recent Oracle AI Database versions, enabling in-memory analytic operations directly on the property graph.
By Deployment Model
The cloud segment holds a dominant 69.7% share of the Graph Technology Market in 2024. Cloud deployment offers faster scalability, reduced infrastructure costs, and easier data integration. Organizations favor managed graph database services for real-time analytics and elastic storage capabilities. On-premises solutions remain relevant in industries with strict data security needs, such as government and defense. However, the increasing adoption of hybrid and multi-cloud architectures continues to accelerate the shift toward cloud-based graph technology platforms across enterprises.
- For instance, ArangoDB offers a native multi-model engine combining graph, document, and key/value models with a single unified query language (AQL). In a benchmark, an ArangoDB cluster with 640 virtual CPUs sustained a write load of 1.1 million JSON documents (1 GB) per second across 80 nodes, demonstrating its high-performance capabilities for enterprise environments.
By Component
The software segment accounts for 72.5% of the Graph Technology Market in 2024, leading over services. This dominance stems from growing investments in graph database platforms, visualization tools, and AI-powered graph analytics engines. Enterprises prefer advanced software solutions to support real-time fraud detection, recommendation engines, and network optimization. Services such as consulting and integration gain traction but remain secondary. The continuous introduction of low-code and cloud-native graph solutions is driving broader software adoption across sectors including finance, healthcare, and manufacturing.
Key Growth Drivers
Rising Demand for Real-Time Data Processing
Organizations are adopting graph technology to handle complex and dynamic datasets. Real-time processing enables faster decision-making, fraud detection, and improved personalization. Sectors like banking, retail, and healthcare benefit from rapid pattern recognition and relationship mapping. The growing use of IoT and AI increases data flow, which demands efficient graph-based data handling. Companies leverage graph databases to reduce query times and improve operational efficiency. This rising demand for speed and accuracy strongly drives the adoption of graph technology solutions.
- For instance, Neo4j announced in October 2023 that its new Parallel Runtime capability enables analytical queries to run up to 100 times faster across CPU cores, bridging transactional and analytical workloads in real time (via change data capture).
Expansion of AI and Machine Learning Applications
AI and machine learning rely on graph structures to uncover hidden patterns in data. Graph technology improves data connectivity and enhances model accuracy. It supports applications like recommendation engines, predictive analytics, and knowledge graphs. Enterprises integrate graph databases to boost AI model performance with structured, relationship-based insights. These capabilities are crucial in sectors like e-commerce, cybersecurity, and social media. As AI adoption grows, the demand for graph-based architectures accelerates, boosting market growth globally.
- For instance, MarkLogic’s documentation claims 4× faster data integration, 10× improved developer productivity, and 100× faster information access through its unified platform.
Growing Adoption in Fraud Detection and Risk Management
Financial institutions increasingly use graph technology to detect fraud and mitigate risks. Graph-based analytics identify suspicious links between transactions, accounts, and devices in real time. This improves fraud detection accuracy and reduces response time. Banks, insurers, and e-commerce platforms rely on relationship-driven insights to detect anomalies quickly. By reducing losses and compliance risks, graph databases become essential for security strategies. This growing need for advanced fraud detection solutions fuels steady market expansion.
Key Trends & Opportunities
Integration with Cloud and Hybrid Deployments
Graph technology is rapidly integrating with cloud and hybrid infrastructures to boost scalability. Cloud deployment simplifies graph database management and lowers operational costs. Enterprises benefit from flexible data access, faster deployments, and better security compliance. Vendors are offering managed graph database services to attract businesses shifting to hybrid IT ecosystems. This trend opens new opportunities for solution providers to deliver secure, agile, and scalable graph platforms.
- For instance, Amazon Neptune (AWS’s managed graph service) supports storage scaling up to 128 TiB per cluster and more than 100,000 graph queries per second in demanding workloads.
Emergence of Knowledge Graphs in Enterprises
Knowledge graphs are gaining popularity for improving data organization and insight generation. Companies use these graphs to build smart search engines, virtual assistants, and data discovery tools. Sectors like healthcare, telecom, and finance leverage knowledge graphs for better context understanding and decision-making. The increasing demand for knowledge-driven applications is creating growth avenues for graph technology vendors.
Increasing Investments in Advanced Analytics
Businesses are investing more in advanced analytics powered by graph structures. Graph databases enable deep relationship mapping, which enhances customer insights, network analysis, and operational intelligence. Companies are using this capability to improve personalization and detect inefficiencies. This trend encourages the development of high-performance graph solutions and strategic partnerships across industries.
- For instance, IBM Research’s “Knowledge Enhanced Accelerated Discovery” project ingested a multimodal knowledge graph of 31,004 nodes and 356,037 edges (from proteins and drug entities) to train downstream ML models.
Key Challenges
High Complexity of Implementation
Implementing graph technology requires specialized skills and complex integration processes. Many organizations face challenges in aligning graph databases with legacy systems. This increases deployment time and cost, limiting adoption in smaller enterprises. The lack of skilled graph database developers adds to the complexity. Companies must invest heavily in training and infrastructure to unlock the full potential of graph technology.
Data Security and Privacy Concerns
Graph databases store highly interconnected and sensitive data. This creates new security risks if access controls are weak or misconfigured. Industries like finance and healthcare face strict compliance requirements that make securing graph structures critical. Any breach could expose multiple connected data points at once. Addressing these security and privacy issues remains a major barrier to wider adoption.
Regional Analysis
North America
North America leads the Graph Technology Market with a 36.4% share. The region benefits from early adoption of advanced analytics, AI integration, and strong cloud infrastructure. Key sectors such as banking, e-commerce, and healthcare leverage graph databases for real-time analytics and fraud detection. Major technology vendors and startups are driving innovation through partnerships and product launches. High investments in AI-powered platforms and the growing demand for knowledge graphs further boost market growth. The strong presence of leading providers and favorable digital transformation initiatives sustain North America’s dominant position.
Europe
Europe holds a 27.8% share of the Graph Technology Market, driven by regulatory support for data security and digital innovation. Enterprises across financial services, telecom, and manufacturing increasingly adopt graph databases to enhance decision-making and compliance management. Countries like Germany, France, and the U.K. lead in enterprise-level deployments. The demand for advanced analytics and knowledge graphs is growing, supported by data governance initiatives like GDPR. European firms emphasize interoperability and cloud-based graph solutions, fueling adoption. Rising investments in AI and strong R&D capabilities reinforce Europe’s position as a major market hub.
Asia Pacific
Asia Pacific accounts for a 23.5% market share and is the fastest-growing regional market. Rapid digital transformation in China, India, and Japan fuels strong demand for graph technology. Enterprises adopt graph databases to support e-commerce, financial services, and smart city projects. The region benefits from expanding 5G infrastructure and increasing AI integration. Local and global vendors are investing in scalable cloud-based graph platforms. Government initiatives promoting digital ecosystems and analytics adoption further accelerate market expansion. The region’s growing developer base and competitive pricing contribute to its rising global influence.
Latin America
Latin America represents an 8.1% share of the Graph Technology Market. Adoption is growing steadily, supported by increased cloud infrastructure investments and digital transformation programs. Brazil and Mexico lead regional demand, driven by banking, retail, and telecom applications. Organizations are embracing graph databases to improve fraud detection, supply chain visibility, and customer engagement. However, skill gaps and high implementation costs slightly slow adoption rates. Partnerships with global vendors and cloud service providers are helping reduce barriers. This rising adoption trend positions Latin America as an emerging growth contributor.
Middle East & Africa
The Middle East & Africa holds a 4.2% share of the Graph Technology Market. The region’s growth is supported by expanding IT modernization projects in the UAE, Saudi Arabia, and South Africa. Government-led smart city initiatives and cybersecurity investments drive adoption in critical sectors. Enterprises use graph databases to manage complex networks and detect threats. However, limited local expertise and lower enterprise adoption rates restrict rapid expansion. Global vendors are forming strategic alliances to offer scalable cloud-based graph solutions. These developments are gradually strengthening the region’s position in the global market.
Market Segmentations:
By Type:
- RDF
- Labeled Property Graph
By Deployment Model:
By Component:
By Geography
- North America
- Europe
- Germany
- France
- U.K.
- Italy
- Spain
- Rest of Europe
- Asia Pacific
- China
- Japan
- India
- South Korea
- South-east Asia
- Rest of Asia Pacific
- Latin America
- Brazil
- Argentina
- Rest of Latin America
- Middle East & Africa
- GCC Countries
- South Africa
- Rest of the Middle East and Africa
Competitive Landscape
The Graph Technology Market is driven by key players including TigerGraph, Oracle Corporation, DataStax, ArangoDB, Inc., Neo4j, Inc., Microsoft, Progress Software Corporation (MarkLogic), Amazon Web Services, Inc., IBM, and Stardog. The Graph Technology Market is characterized by rapid innovation, expanding product portfolios, and rising strategic collaborations. Companies are focusing on enhancing graph database performance to manage complex data relationships in real time. Vendors are prioritizing cloud-based solutions, enabling enterprises to scale operations efficiently and reduce infrastructure costs. Integration with AI, machine learning, and advanced analytics platforms is becoming a core strategy to deliver smarter, faster, and more secure solutions. Many providers are also investing in industry-specific applications to differentiate their offerings. This competitive environment is driving continuous technological advancements and shaping strong market growth.
Shape Your Report to Specific Countries or Regions & Enjoy 30% Off!
Key Player Analysis
- TigerGraph
- Oracle Corporation
- DataStax
- ArangoDB, Inc.
- Neo4j, Inc.
- Microsoft
- Progress Software Corporation (MarkLogic)
- Amazon Web Services, Inc.
- IBM
- Stardog
Recent Developments
- In June 2025, AWS launched Amazon Neptune Analytics, joining graph processing with analytics capabilities, making it easier to develop insights from graph-based data.
- In February 2025, Oracle and Quant announced a collaboration to enhance digital asset invention after the introduction of the Oracle Blockchain Platform Digital Assets Edition (OBP DA). OBP DA is an enterprise-level solution developed to simplify the deployment and development of digital assets applications to generate unified ledgers.
- In September 2024, Neo4j announced a key transformation of its Aura cloud database management system portfolio, making it easier for enterprises to try, accelerate, and deploy graph databases in production for any use case or workload.
- In August 2024, Google launched Spanner Graph, a unified database that integrates graphs, AI, and relational capabilities, aimed at enhancing comprehensive analytics and improving use cases such as recommendation engines and fraud detection
Report Coverage
The research report offers an in-depth analysis based on Type, Deployment Model, Component and Geography. It details leading market players, providing an overview of their business, product offerings, investments, revenue streams, and key applications. Additionally, the report includes insights into the competitive environment, SWOT analysis, current market trends, as well as the primary drivers and constraints. Furthermore, it discusses various factors that have driven market expansion in recent years. The report also explores market dynamics, regulatory scenarios, and technological advancements that are shaping the industry. It assesses the impact of external factors and global economic changes on market growth. Lastly, it provides strategic recommendations for new entrants and established companies to navigate the complexities of the market.
Future Outlook
- Graph technology will see wider adoption across industries due to rising demand for real-time analytics.
- Integration with AI and machine learning will strengthen advanced data modeling capabilities.
- Cloud-based graph databases will dominate as enterprises prioritize scalability and flexibility.
- Knowledge graphs will play a key role in enhancing enterprise intelligence and automation.
- Graph technology will support complex fraud detection and cybersecurity applications.
- Increased investments in R&D will lead to faster, more secure graph processing solutions.
- Low-code and no-code platforms will make graph solutions more accessible to businesses.
- Regional adoption will accelerate in Asia Pacific due to digital transformation initiatives.
- Graph database vendors will focus on interoperability with existing data systems.
- Strategic collaborations and mergers will shape a more consolidated and competitive market.


