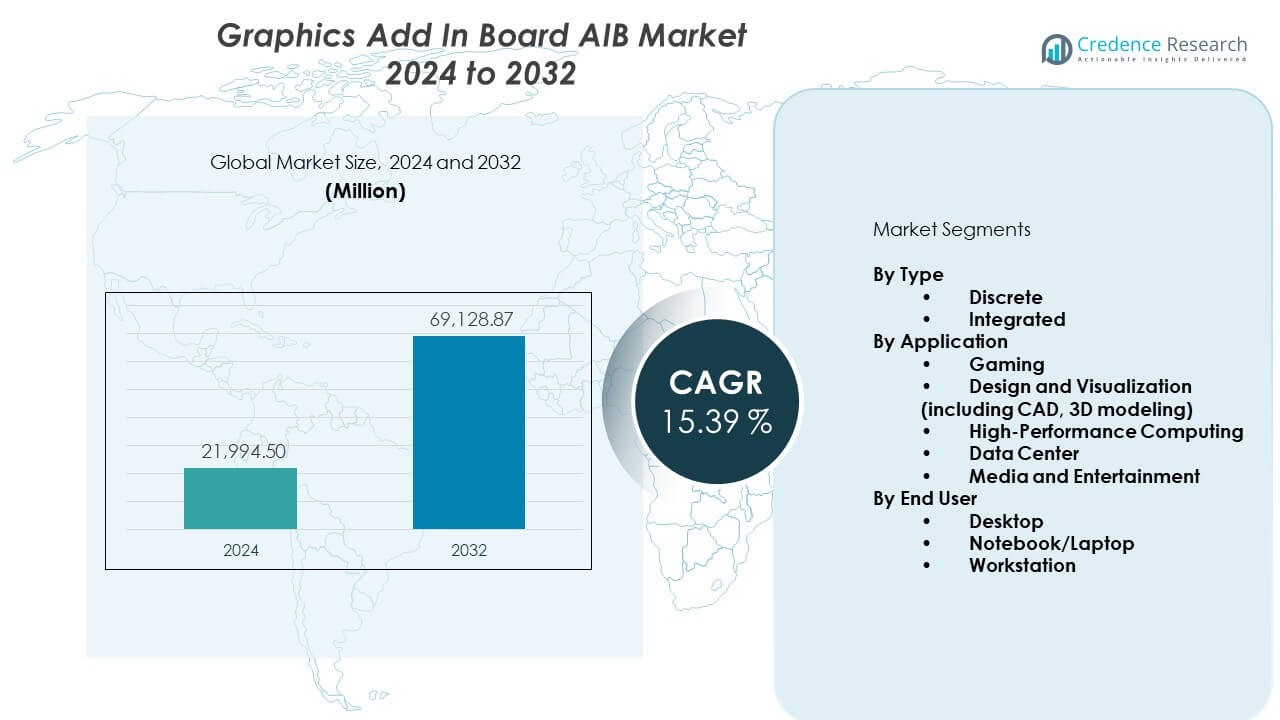
Home » Information and Communications Technology » Graphics Add-in Board (AIB) Market

Graphics Add-in Board (AIB) Market By Application (Gaming, Design and Visualization, High-performance Computing, Data Center, Others) By End-Users (Desktop, Notebooks and Tablets, Workstations, Others)

Price: $4999

Published: | Report ID: 18657 | Report Format : PDF

 Key Highlights of the Report

The global Graphics Add-in Board (AIB) market is segmented by application, end-users, and region. Gaming is the leading segment by application. During the forecast period, the workstations category is expected to have the most significant CAGR. Asia Pacific is driving the growth of the graphics add-in board (AIB) industry.

The rising use of consumer electronics with touchscreens and the rising demand for high-quality graphics are driving market growth. The main challenges to market growth are the shift towards mobile devices and supply chain disruptions.

The Asia Pacific region has a significant and fast-expanding gaming market. Countries with a strong gaming culture and a large population of gamers include China, Japan, South Korea, and India. The Graphics AIB market in Asia Pacific is predicted to develop significantly as demand for high-performance graphics cards for gaming continues to rise.

Design Element 2

Access crucial information at unmatched prices!

Request your free sample report today & start making informed decisions powered by Credence Research!

Download Free Sample
CTA Design Element 3

Market Overview

The global Graphics Add-in Board (AIB) market has steadily risen in recent years and is predicted to develop at a CAGR of 18.50% between 2023 and 2030. In 2022, the market was valued at USD 15.2 billion, and it is predicted to grow to USD 49.87 billion by 2030.

What Are the Primary Drivers of the Global Graphics Add-in Board (AIB) Market?

The rising use of consumer electronics with touchscreens and the rising demand for high-quality graphics are driving market growth.

What Are the Major Challenges Facing the Global Graphics Add-in Board (AIB) Market?

The main challenges to market growth are the shift towards mobile devices and supply chain disruptions.

What Are the Growth Prospects for the Global Graphics Add-in Board (AIB) Market?

Collaboration with Cloud Gaming and Streaming Services, as well as the expansion of the gaming industry, are the market’s significant opportunities.

Executive Summary

Overview of the Global Graphics Add-in Board (AIB) Market

Graphics Add-in Boards (AIBs) improve graphics performance, gaming experiences, accelerated data processing, support for professional applications, immersive VR/AR experiences, multi-monitor setups, energy efficiency and thermal management, and allow customization and upgradability. These advantages make AIBs indispensable components in many sectors where high-quality visuals and processing capability are critical to success.

Market Definition

The Graphics Add-in Board (AIB) market refers to the industry segment that focuses on the production, distribution, and sale of specialized graphics cards that can be installed on the motherboard of a computer system. AIBs are standalone graphics processing units (GPUs) that give advanced graphics capabilities and performance beyond what integrated graphics solutions normally provide.

Market Insights

  • The global market for Graphics Add-in Boards (AIB) was estimated at USD 15.2 billion in 2022 and is predicted to reach USD 49.87 billion in 2030, rising at a CAGR of 18.50% between 2023 and 2030.
  • Gaming is the leading segment by application.
  • During the forecast period, the Workstations category is expected to have the most significant CAGR.
  • Asia Pacific is driving the growth of the Graphics Add-in Board (AIB) industry.
  • North America is the second largest Graphics Add-in Board (AIB) Market region.
  • Europe is expected to be the fastest-growing Graphics Add-in Board (AIB) Market region.
  • The rising use of consumer electronics with touchscreens and rising demand for high-quality graphics are driving market growth.
  • The main challenges to market growth are the shift towards mobile devices and supply chain disruptions.
  • Collaboration with Cloud Gaming and Streaming Services, as well as the expansion of the gaming industry, are the market’s significant opportunities.

Segmentation by Application

  • Gaming is the leading segment by application.
  • The Design and Visualization segment is expected to grow at the fastest rate during the forecast period.
  • Other applications contributing to the demand for Graphics Add-in Boards (AIB) include High-performance Computing, Data Centers, and others.

Segmentation by End-Users

  • During the forecast period, the Workstations category is expected to have the most significant CAGR.
  • Other end-users, such as Desktop, Notebooks and Tablets, and Others, also contribute to the demand for Graphics Add-in Board (AIB).

Segmentation by Region

  • Asia Pacific is driving the growth of the Graphics Add-in Board (AIB) industry due to the enormous consumer base and expanding IT service sector in developing countries.
  • North America is the second largest Graphics Add-in Board (AIB) Market region.
  • Europe is expected to be the fastest-growing Graphics Add-in Board (AIB) Market region.
  • The rest of the world, including Latin America, the Middle East, and Africa, contributes to the rest of the demand for Graphics Add-in Boards (AIB).

The increased demand for Graphics Add-in Boards (AIB) can be ascribed to the growing demand for high-quality graphics. However, the market is hampered by the shift towards mobile devices.

The growing gaming sector, VR/AR usage, AI/ML applications, cryptocurrency mining, professional graphics demand, technical breakthroughs, e-commerce platforms, and rising consumer awareness are all driving growth in the Graphics Add-in Board (AIB) market in the United States. Manufacturers and suppliers who seize these chances will likely gain from the market’s growth potential.

Germany’s gaming and esports business is expanding, with an increasing number of professional gamers, esports competitions, and gaming events. As gamers seek cutting-edge graphics cards to enhance their gaming experiences and compete at the highest levels, the rise of this sector stimulates demand for high-performance AIBs.

Germany is well-known for its advanced manufacturing sector and for embracing Industry 4.0 ideas. As businesses embrace automation, robots, and data analytics, the demand for powerful graphics processing units (GPUs) to support visualizations, simulations, and real-time monitoring grows. AIBs are critical in enabling these digital transformation activities, which drive market growth.

Graphics Add-in Board (AIB) Market

Demand for High-Quality Graphics is growing

The rising need for high-quality graphics is a major driving factor behind the expansion of the Graphics Add-in Board (AIB) market. One of the key drivers of the AIB market is the gaming industry. Today’s gamers demand engaging and realistic graphics in their gaming experiences. The demand for high-performance AIBs grows as game developers construct visually attractive and graphically taxing games. AIBs provide the processing power and graphical capabilities required to create high-quality visuals, allowing players to have a more immersive and visually appealing gaming experience.

High-quality graphics are in high demand in gaming and the content development and media industries. Animation, film production, graphic design, and visual effects professionals require powerful AIBs to accomplish complicated rendering operations and generate high-resolution graphics. AIBs offer faster rendering speeds, smoother processes, and higher visual quality, all of which are critical for content creators aiming to deliver high-quality images.

Rising use of consumer electronics with touchscreens

Touchscreen-based consumer gadgets, such as smartphones, tablets, and interactive displays, necessitate sophisticated graphics processing capabilities to provide aesthetically appealing and responsive user interfaces. While the touchscreen hardware handles touch input, the AIBs handle graphics rendering and processing. AIBs are in charge of rendering high-quality graphics, enabling smooth animations, and enabling rich visual effects, all of which improve the overall user experience on touchscreen devices.

Touchscreen devices are frequently connected to additional screens or docking stations to increase their capabilities. AIBs can be used in these configurations to drive the graphics performance of external displays. This enables users to enjoy high-resolution pictures, multiple monitor configurations, and graphics-intensive operations like video editing or 3D modeling on larger screens.

In conclusion, while touchscreen-based consumer electronics do not directly drive the AIB business, they rely on AIBs to deliver increased graphics capabilities and improve the visual experience. In the context of touchscreen-based consumer electronics, the increasing demand for aesthetically appealing interfaces, gaming on touchscreen devices, and the use of external displays all contribute to the total demand for AIBs.

Shift toward Mobile Devices

Consumer attention and investment have migrated away from traditional PCs and AIBs due to the rapid proliferation of mobile devices such as smartphones and tablets. Mobile devices are getting more portable and competent in terms of graphics capability. This transition to mobile devices and the growing popularity of mobile gaming may influence demand for AIBs, particularly in the consumer category.

Supply Chain Disruptions

Supply chain disruptions can impact the AIB sector, as they do in many other industries. Component shortages, geopolitical difficulties, trade disputes, or natural calamities can all impact AIB production and supply. These disruptions can lead to supply limitations, higher costs, and delayed product releases, all of which have an influence on market growth.

Opportunities

The global Graphics Add-in Board (AIB) market has substantial growth potential. These are some examples:

Collaboration with Cloud Gaming and Streaming Services

The growth of cloud gaming and streaming services creates opportunities for Graphics AIB makers and cloud service providers to collaborate. AIBs can supplement cloud-based gaming platforms by providing local graphics processing capacity to improve streaming, reduce latency, and enable higher-quality visuals. Graphics AIB manufacturers can increase their market reach and capitalize on the growing demand for cloud-based gaming solutions by partnering with cloud gaming and streaming providers.

Growth of the Gaming Industry

The gaming business is still expanding rapidly due to rising global game consumption and the rise of e-sports. High-performance AIBs are in high demand in the gaming industry, as players want more immersive experiences with realistic graphics and smooth gameplay. As the gaming industry grows, the Graphics AIB market will profit from increased demand for powerful graphics solutions.

Professional Graphics and Content Creation

AIBs are used by professionals in industries such as graphic design, animation, film production, and architecture to complete difficult visual jobs. The rising digital content creation business and the requirement for realistic simulations are driving up demand for high-quality graphics and rendering capabilities in these industries. AIB makers may capitalize on these opportunities by offering powerful graphics solutions that are targeted to the needs of professionals in a variety of creative and design-oriented businesses.

Competitive Landscape

Key Players

The global Graphics Add-in Board (AIB) market is extremely competitive, with several prominent companies present. The following are some of the market’s top companies and their market shares:

  • Nvidia Corporation
  • Advanced Micro Devices, Inc.
  • AsusTek Computer Inc.
  • Intel Corporation
  • EVGA Corporation
  • Gigabyte Technology
  • Sapphire Technology
  • Zotac
  • Micro-Star International Co., Ltd
  • INNO3D

To stay competitive, these firms prioritize product innovation, distribution channel expansion, and mergers and acquisitions.

The key competitors in the global Graphics Add-in Board (AIB) market are constantly seeking to stay ahead by developing new products and advancements.

AMD unveiled the Radeon Pro VII, a high-end graphics card for workstations developed on a 7nm technology, in May 2020. This is AMD’s flagship GPU for professional applications, and it includes 16GB of HBM2 memory with ECC support and memory bandwidth of up to 1TB/s.

NVIDIA Corporation introduced the NVIDIA CloudXR 1.0 software development kit in May 2020 to provide significant enhancements to streaming augmented reality, mixed reality, and virtual reality content, commonly known as XR, across 5G, Wi-Fi, and other high-performance networks.

Shape Your Report to Specific Countries or Regions & Enjoy 30% Off!

Summary of Key Findings

  • The rising use of consumer electronics with touchscreens, as well as the rising demand for high-quality graphics, are driving market growth.
  • Market segmented by application, end-users, and region.
  • Gaming is the leading segment by application.
  • During the forecast period, the Workstations category is expected to have the most significant CAGR.
  • Asia Pacific is leading market growth; the market is highly competitive with key players including Nvidia Corporation, Advanced Micro Devices, Inc., AsusTek Computer Inc., and Intel Corporation.

Future Outlook

  • With the growth of the gaming industry, there is a positive outlook for the global Graphics Add-in Board (AIB) market.
  • The rising use of consumer electronics with touchscreens, as well as the rising demand for high-quality graphics, are driving market growth.
  • The main challenges to market growth are the shift towards mobile devices and supply chain disruptions.
  • To stay productive, key players must focus on product innovation, growing market reach, and maintaining competitive pricing.

Segmentation

  • By Application
    • Gaming
    • Design and Visualization
    • High-performance Computing
    • Data Center
    • Others
  • By End-Users
    • Desktop
    • Notebooks and Tablets
    • Workstations
    • Others
  • By Region
  • North America
    • The US.
    • Canada
    • Mexico
  • Europe
    • Germany
    • France
    • The U.K.
    • Italy
    • Spain
    • Rest of Europe
  • Asia Pacific
    • China
    • Japan
    • India
    • South Korea
    • South-east Asia
    • Rest of Asia Pacific
  • Latin America
    • Brazil
    • Argentina
    • Rest of Latin America
  • Middle East & Africa
    • GCC Countries
    • South Africa
    • Rest of the Middle East and Africa

1. Preface
1.1. Report Description
1.1.1. Purpose of the Report
1.1.2. Target Audience
1.1.3. USP and Key Offerings
1.2. Research Scope
1.3. Research Methodology
1.3.1. Phase I – Secondary Research
1.3.2. Phase II – Data Modelling
1.3.2.1. Company Share Analysis Model
1.3.2.2. Revenue Based Modelling
1.3.3. Phase III – Primary Research
1.3.4. Research Limitations
1.3.5. Assumptions
1.4. Market Introduction
1.5. Market Research Scope

2. Executive Summary
2.1. Market Snapshot: Global Graphics Add-in Board (AIB) Market
2.2. Global Graphics Add-in Board (AIB) Market, By Application
2.3. Global Graphics Add-in Board (AIB) Market, By End-Users
2.4. Global Graphics Add-in Board (AIB) Market, By Region

3. Market Dynamics & Factors Analysis
3.1. Introduction
3.1.1. Global Graphics Add-in Board (AIB) Market Value, 2017-2030, (US$ Bn)
3.1.2. Y-o-Y Growth Trend Analysis
3.2. Market Dynamics
3.2.1. Market Drivers
3.2.1.1. Driver 1
3.2.1.2. Driver 2
3.2.1.3. Driver 3
3.2.2. Market Restraints
3.2.2.1. Restraint 1
3.2.2.2. Restraint 2
3.2.3. Market Opportunities
3.2.3.1. Opportunity 1
3.2.3.2. Opportunity 2
3.2.4. Major Industry Challenges
3.2.4.1. Challenge 1
3.2.4.2. Challenge 2
3.3. Growth and Development Patterns
3.4. Investment Feasibility Analysis
3.5. Market Opportunity Analysis
3.5.1. Application
3.5.2. End-Users
3.5.3. Geography

4. Premium Insights
4.1. STAR (Situation, Task, Action, Results) Analysis
4.2. Porter’s Five Forces Analysis
4.2.1. Threat of New Entrants
4.2.2. Bargaining Power of Buyers/Consumers
4.2.3. Bargaining Power of Suppliers
4.2.4. Threat of Substitute Types
4.2.5. Intensity of Competitive Rivalry
4.3. Key Market Trends
4.3.1. Demand Side Trends
4.3.2. Supply Side Trends
4.4. Value Chain Analysis
4.5. Technology Analysis
4.6. Analysis and Recommendations
4.7. Marketing Strategy Analysis
4.7.1. Direct Marketing
4.7.2. Indirect Marketing
4.7.3. Marketing Channel Development Trend

5. Market Positioning of Key Players, 2022
5.1. Company market share of key players, 2022
5.2. Competitive Benchmarking
5.3. Market Positioning of Key Vendors
5.4. Geographical Presence Analysis
5.5. Major Strategies Adopted by Key Players
5.5.1. Key Strategies Analysis
5.5.2. Mergers and Acquisitions
5.5.3. Partnerships
5.5.4. Product Launch
5.5.5. Geographical Expansion
5.5.6. Others

6. Economic Impact Analysis
6.1. Recession Impact
6.1.1. North America
6.1.2. Europe
6.1.3. Asia Pacific
6.1.4. Latin America
6.1.5. Middle East and Africa
6.2. Ukraine-Russia War Impact
6.2.1. North America
6.2.2. Europe
6.2.3. Asia Pacific
6.2.4. Latin America
6.2.5. Middle East and Africa
6.3. COVID-19 Impact Analysis
6.3.1. North America
6.3.2. Europe
6.3.3. Asia Pacific
6.3.4. Latin America
6.3.5. Middle East and Africa

7. Global Graphics Add-in Board (AIB) Market, By Application
7.1. Global Graphics Add-in Board (AIB) Market Overview, by Application
7.1.1. Global Graphics Add-in Board (AIB) Market Revenue Share, By Application, 2022 Vs 2030 (in %)
7.2. Gaming
7.2.1. Global Graphics Add-in Board (AIB) Market, By Region, 2017-2030 (US$ Bn)
7.3. Design and Visualization
7.3.1. Global Graphics Add-in Board (AIB) Market, By Region, 2017-2030 (US$ Bn)
7.4. High-performance Computing
7.4.1. Global Graphics Add-in Board (AIB) Market, By Region, 2017-2030 (US$ Bn)
7.5. Data Center
7.5.1. Global Graphics Add-in Board (AIB) Market, By Region, 2017-2030 (US$ Bn)
7.6. Others
7.6.1. Global Graphics Add-in Board (AIB) Market, By Region, 2017-2030 (US$ Bn)

8. Global Graphics Add-in Board (AIB) Market, By End-Users
8.1. Global Graphics Add-in Board (AIB) Market Overview, by End-Users
8.1.1. Global Graphics Add-in Board (AIB) Market, By End-Users, 2022 vs 2030 (in %)
8.2. Desktop
8.2.1. Global Graphics Add-in Board (AIB) Market, By Region, 2017-2030 (US$ Bn)
8.3. Notebooks and Tablets
8.3.1. Global Graphics Add-in Board (AIB) Market, By Region, 2017-2030 (US$ Bn)
8.4. Workstations
8.4.1. Global Graphics Add-in Board (AIB) Market, By Region, 2017-2030 (US$ Bn)
8.5. Others
8.5.1. Global Graphics Add-in Board (AIB) Market, By Region, 2017-2030 (US$ Bn)

9. Global Graphics Add-in Board (AIB) Market, By Region
9.1. Global Graphics Add-in Board (AIB) Market Overview, by Region
9.1.1. Global Graphics Add-in Board (AIB) Market, By Region, 2022 vs 2030 (in%)
9.2. Application
9.2.1. Global Graphics Add-in Board (AIB) Market, By Application, 2017-2030 (US$ Bn)
9.3. End-Users
9.3.1. Global Graphics Add-in Board (AIB) Market, By End-Users, 2017-2030 (US$ Bn)

10. North America Graphics Add-in Board (AIB) Market Analysis
10.1. North America Graphics Add-in Board (AIB) Market, by Application, 2017-2030(US$ Bn)
10.1.1. Overview
10.1.2. SRC Analysis
10.2. North America Graphics Add-in Board (AIB) Market, by End-Users, 2017-2030(US$ Bn)
10.2.1. Overview
10.2.2. SRC Analysis
10.3. North America Graphics Add-in Board (AIB) Market, by Country, 2017-2030 (US$ Bn)
10.3.1. North America Graphics Add-in Board (AIB) Market, by Country, 2022 Vs 2030 (in%)
10.3.2. U.S.
10.3.2.1. U.S. Graphics Add-in Board (AIB) Market Estimates and Forecast, 2017-2030 (US$ Bn)
10.3.2.2. U.S. Graphics Add-in Board (AIB), By Application, 2017-2030 (US$ Bn)
10.3.2.3. U.S. Graphics Add-in Board (AIB), By End-Users, 2017-2030 (US$ Bn)
10.3.3. Canada
10.3.3.1. Canada Graphics Add-in Board (AIB) Market Estimates and Forecast, 2017-2030 (US$ Bn)
10.3.3.2. Canada Graphics Add-in Board (AIB), By Application, 2017-2030 (US$ Bn)
10.3.3.3. Canada Graphics Add-in Board (AIB), By End-Users, 2017-2030 (US$ Bn)
10.3.4. Mexico
10.3.4.1. Mexico Graphics Add-in Board (AIB) Market Estimates and Forecast, 2017-2030 (US$ Bn)
10.3.4.2. Mexico Graphics Add-in Board (AIB), By Application, 2017-2030 (US$ Bn)
10.3.4.3. Mexico Graphics Add-in Board (AIB), By End-Users, 2017-2030 (US$ Bn)

11. Europe Graphics Add-in Board (AIB) Market Analysis
11.1. Europe Graphics Add-in Board (AIB) Market, by Application, 2017-2030(US$ Bn)
11.1.1. Overview
11.1.2. SRC Analysis
11.2. Europe Graphics Add-in Board (AIB) Market, by End-Users, 2017-2030(US$ Bn)
11.2.1. Overview
11.2.2. SRC Analysis
11.3. Europe Graphics Add-in Board (AIB) Market, by Country, 2017-2030 (US$ Bn)
11.3.1. Europe Graphics Add-in Board (AIB) Market, by Country, 2022 Vs 2030 (in%)
11.3.2. Germany
11.3.2.1. Germany Graphics Add-in Board (AIB) Market Estimates and Forecast, 2017-2030 (US$ Bn)
11.3.2.2. Germany Graphics Add-in Board (AIB), By Application, 2017-2030 (US$ Bn)
11.3.2.3. Germany Graphics Add-in Board (AIB), By End-Users, 2017-2030 (US$ Bn)
11.3.3. France
11.3.3.1. France Graphics Add-in Board (AIB) Market Estimates and Forecast, 2017-2030 (US$ Bn)
11.3.3.2. France Graphics Add-in Board (AIB), By Application, 2017-2030 (US$ Bn)
11.3.3.3. France Graphics Add-in Board (AIB), By End-Users, 2017-2030 (US$ Bn)
11.3.4. UK
11.3.4.1. UK Graphics Add-in Board (AIB) Market Estimates and Forecast, 2017-2030 (US$ Bn)
11.3.4.2. UK Graphics Add-in Board (AIB), By Application, 2017-2030 (US$ Bn)
11.3.4.3. UK Graphics Add-in Board (AIB), By End-Users, 2017-2030 (US$ Bn)
11.3.5. Italy
11.3.5.1. Italy Graphics Add-in Board (AIB) Market Estimates and Forecast, 2017-2030 (US$ Bn)
11.3.5.2. Italy Graphics Add-in Board (AIB), By Application, 2017-2030 (US$ Bn)
11.3.5.3. Italy Graphics Add-in Board (AIB), By End-Users, 2017-2030 (US$ Bn)
11.3.6. Spain
11.3.6.1. Spain Graphics Add-in Board (AIB) Market Estimates and Forecast, 2017-2030 (US$ Bn)
11.3.6.2. Spain Graphics Add-in Board (AIB), By Application, 2017-2030 (US$ Bn)
11.3.6.3. Spain Graphics Add-in Board (AIB), By End-Users, 2017-2030 (US$ Bn)
11.3.7. Rest of Europe
11.3.7.1. Rest of Europe Graphics Add-in Board (AIB) Market Estimates and Forecast, 2017-2030 (US$ Bn)
11.3.7.2. Rest of Europe Graphics Add-in Board (AIB), By Application, 2017-2030 (US$ Bn)
11.3.7.3. Rest of Europe Graphics Add-in Board (AIB), By End-Users, 2017-2030 (US$ Bn)

12. Asia Pacific Graphics Add-in Board (AIB) Market Analysis
12.1. Asia Pacific Graphics Add-in Board (AIB) Market, by Application, 2017-2030(US$ Bn)
12.1.1. Overview
12.1.2. SRC Analysis
12.2. Asia Pacific Graphics Add-in Board (AIB) Market, by End-Users, 2017-2030(US$ Bn)
12.2.1. Overview
12.2.2. SRC Analysis
12.3. Asia Pacific Graphics Add-in Board (AIB) Market, by Country, 2017-2030 (US$ Bn)
12.3.1. Asia Pacific Graphics Add-in Board (AIB) Market, by Country, 2022 Vs 2030 (in%)
12.3.2. China
12.3.2.1. China Graphics Add-in Board (AIB) Market Estimates and Forecast, 2017-2030 (US$ Bn)
12.3.2.2. China Graphics Add-in Board (AIB), By Application, 2017-2030 (US$ Bn)
12.3.2.3. China Graphics Add-in Board (AIB), By End-Users, 2017-2030 (US$ Bn)
12.3.3. Japan
12.3.3.1. Japan Graphics Add-in Board (AIB) Market Estimates and Forecast, 2017-2030 (US$ Bn)
12.3.3.2. Japan Graphics Add-in Board (AIB), By Application, 2017-2030 (US$ Bn)
12.3.3.3. Japan Graphics Add-in Board (AIB), By End-Users, 2017-2030 (US$ Bn)
12.3.4. India
12.3.4.1. India Graphics Add-in Board (AIB) Market Estimates and Forecast, 2017-2030 (US$ Bn)
12.3.4.2. India Graphics Add-in Board (AIB), By Application, 2017-2030 (US$ Bn)
12.3.4.3. India Graphics Add-in Board (AIB), By End-Users, 2017-2030 (US$ Bn)
12.3.5. South Korea
12.3.5.1. South Korea Graphics Add-in Board (AIB) Market Estimates and Forecast, 2017-2030 (US$ Bn)
12.3.5.2. South Korea Graphics Add-in Board (AIB), By Application, 2017-2030 (US$ Bn)
12.3.5.3. South Korea Graphics Add-in Board (AIB), By End-Users, 2017-2030 (US$ Bn)
12.3.6. South-East Asia
12.3.6.1. South-East Asia Graphics Add-in Board (AIB) Market Estimates and Forecast, 2017-2030 (US$ Bn)
12.3.6.2. South-East Asia Graphics Add-in Board (AIB), By Application, 2017-2030 (US$ Bn)
12.3.6.3. South-East Asia Graphics Add-in Board (AIB), By End-Users, 2017-2030 (US$ Bn)
12.3.7. Rest of Asia Pacific
12.3.7.1. Rest of Asia Pacific Graphics Add-in Board (AIB) Market Estimates and Forecast, 2017-2030 (US$ Bn)
12.3.7.2. Rest of Asia Pacific Graphics Add-in Board (AIB), By Application, 2017-2030 (US$ Bn)
12.3.7.3. Rest of Asia Pacific Graphics Add-in Board (AIB), By End-Users, 2017-2030 (US$ Bn)

13. Latin America Graphics Add-in Board (AIB) Market Analysis
13.1. Latin America Graphics Add-in Board (AIB) Market, by Application, 2017-2030(US$ Bn)
13.1.1. Overview
13.1.2. SRC Analysis
13.2. Latin America Graphics Add-in Board (AIB) Market, by End-Users, 2017-2030(US$ Bn)
13.2.1. Overview
13.2.2. SRC Analysis
13.3. Latin America Graphics Add-in Board (AIB) Market, by Country, 2017-2030 (US$ Bn)
13.3.1. Latin America Graphics Add-in Board (AIB) Market, by Country, 2022 Vs 2030 (in%)
13.3.2. Brazil
13.3.2.1. Brazil Graphics Add-in Board (AIB) Market Estimates and Forecast, 2017-2030 (US$ Bn)
13.3.2.2. Brazil Graphics Add-in Board (AIB), By Application, 2017-2030 (US$ Bn)
13.3.2.3. Brazil Graphics Add-in Board (AIB), By End-Users, 2017-2030 (US$ Bn)
13.3.3. Argentina
13.3.3.1. Argentina Graphics Add-in Board (AIB) Market Estimates and Forecast, 2017-2030 (US$ Bn)
13.3.3.2. Argentina Graphics Add-in Board (AIB), By Application, 2017-2030 (US$ Bn)
13.3.3.3. Argentina Graphics Add-in Board (AIB), By End-Users, 2017-2030 (US$ Bn)
13.3.4. Rest of Latin America
13.3.4.1. Rest of Latin America Graphics Add-in Board (AIB) Market Estimates and Forecast, 2017-2030 (US$ Bn)
13.3.4.2. Rest of Latin America Graphics Add-in Board (AIB), By Application, 2017-2030 (US$ Bn)
13.3.4.3. Rest of Latin America Graphics Add-in Board (AIB), By End-Users, 2017-2030 (US$ Bn)

14. Middle East and Africa Graphics Add-in Board (AIB) Market Analysis
14.1. Middle East and Africa Graphics Add-in Board (AIB) Market, by Application, 2017-2030(US$ Bn)
14.1.1. Overview
14.1.2. SRC Analysis
14.2. Middle East and Africa Graphics Add-in Board (AIB) Market, by End-Users, 2017-2030(US$ Bn)
14.2.1. Overview
14.2.2. SRC Analysis
14.3. Middle East and Africa Graphics Add-in Board (AIB) Market, by Country, 2017-2030 (US$ Bn)
14.3.1. Middle East and Africa Graphics Add-in Board (AIB) Market, by Country, 2022 Vs 2030 (in%)
14.3.2. GCC Countries
14.3.2.1. GCC Countries Graphics Add-in Board (AIB) Market Estimates and Forecast, 2017-2030 (US$ Bn)
14.3.2.2. GCC Countries Graphics Add-in Board (AIB), By Application, 2017-2030 (US$ Bn)
14.3.2.3. GCC Countries Graphics Add-in Board (AIB), By End-Users, 2017-2030 (US$ Bn)
14.3.3. South Africa
14.3.3.1. South Africa Graphics Add-in Board (AIB) Market Estimates and Forecast, 2017-2030 (US$ Bn)
14.3.3.2. South Africa Graphics Add-in Board (AIB), By Application, 2017-2030 (US$ Bn)
14.3.3.3. South Africa Graphics Add-in Board (AIB), By End-Users, 2017-2030 (US$ Bn)
14.3.4. Rest of Middle East and Africa
14.3.4.1. Rest of Middle East and Africa Graphics Add-in Board (AIB) Market Estimates and Forecast, 2017-2030 (US$ Bn)
14.3.4.2. Rest of Middle East and Africa Graphics Add-in Board (AIB), By Application, 2017-2030 (US$ Bn)
14.3.4.3. Rest of Middle East and Africa Graphics Add-in Board (AIB), By End-Users, 2017-2030 (US$ Bn)

15. Company Profiles
15.1. Nvidia Corporation
15.1.1. Company Overview
15.1.2. Applications/Services Portfolio
15.1.3. Geographical Presence
15.1.4. Financial Summary
15.1.4.1. Market Revenue and Net Profit (2019-2022)
15.1.4.2. Business Segment Revenue Analysis
15.1.4.3. Geographical Revenue Analysis
15.2. Advanced Micro Devices, Inc.
15.3. AsusTek Computer Inc.
15.4. Intel Corporation
15.5. EVGA Corporation
15.6. Gigabyte Technology
15.7. Sapphire Technology
15.8. Zotac
15.9. Micro-Star International Co., Ltd
15.10. INNO3D

List of Figures
FIG. 1 Global Graphics Add-in Board (AIB) Market: Research Methodology
FIG. 2 Market Size Estimation – Top Down & Bottom up Approach
FIG. 3 Global Graphics Add-in Board (AIB) Market Segmentation
FIG. 4 Global Graphics Add-in Board (AIB) Market, by Application, 2022 (US$ Bn)
FIG. 5 Global Graphics Add-in Board (AIB) Market, by End-Users, 2022 (US$ Bn)
FIG. 6 Global Graphics Add-in Board (AIB) Market, by Geography, 2022 (US$ Bn)
FIG. 7 Attractive Investment Proposition, by Application, 2022
FIG. 8 Attractive Investment Proposition, by End-Users, 2022
FIG. 9 Attractive Investment Proposition, by Geography, 2022
FIG. 10 Global Market Share Analysis of Key Graphics Add-in Board (AIB) Market Manufacturers, 2022
FIG. 11 Global Market Positioning of Key Graphics Add-in Board (AIB) Market Manufacturers, 2022
FIG. 12 Global Graphics Add-in Board (AIB) Market Value Contribution, By Application, 2022 & 2030 (Value %)
FIG. 13 Global Graphics Add-in Board (AIB) Market, by Gaming, Value, 2017-2030 (US$ Bn)
FIG. 14 Global Graphics Add-in Board (AIB) Market, by Design and Visualization, Value, 2017-2030 (US$ Bn)
FIG. 15 Global Graphics Add-in Board (AIB) Market, by High-performance Computing, Value, 2017-2030 (US$ Bn)
FIG. 16 Global Graphics Add-in Board (AIB) Market, by Data Center, Value, 2017-2030 (US$ Bn)
FIG. 17 Global Graphics Add-in Board (AIB) Market, by Others, Value, 2017-2030 (US$ Bn)
FIG. 18 Global Graphics Add-in Board (AIB) Market Value Contribution, By End-Users, 2022 & 2030 (Value %)
FIG. 19 Global Graphics Add-in Board (AIB) Market, by Desktop, Value, 2017-2030 (US$ Bn)
FIG. 20 Global Graphics Add-in Board (AIB) Market, by Notebooks and Tablets, 2017-2030 (US$ Bn)
FIG. 21 Global Graphics Add-in Board (AIB) Market, by Workstations, 2017-2030 (US$ Bn)
FIG. 22 Global Graphics Add-in Board (AIB) Market, by Others, 2017-2030 (US$ Bn)
FIG. 23 North America Graphics Add-in Board (AIB) Market, 2017-2030 (US$ Bn)
FIG. 24 U.S. Graphics Add-in Board (AIB) Market, 2017-2030 (US$ Bn)
FIG. 25 Canada Graphics Add-in Board (AIB) Market, 2017-2030 (US$ Bn)
FIG. 26 Europe Graphics Add-in Board (AIB) Market, 2017-2030 (US$ Bn)
FIG. 27 Germany Graphics Add-in Board (AIB) Market, 2017-2030 (US$ Bn)
FIG. 28 France Graphics Add-in Board (AIB) Market, 2017-2030 (US$ Bn)
FIG. 29 U.K. Graphics Add-in Board (AIB) Market, 2017-2030 (US$ Bn)
FIG. 30 Italy Graphics Add-in Board (AIB) Market, 2017-2030 (US$ Bn)
FIG. 31 Spain Graphics Add-in Board (AIB) Market, 2017-2030 (US$ Bn)
FIG. 32 Rest of Europe Graphics Add-in Board (AIB) Market, 2017-2030 (US$ Bn)
FIG. 33 Asia Pacific Graphics Add-in Board (AIB) Market, 2017-2030 (US$ Bn)
FIG. 34 China Graphics Add-in Board (AIB) Market, 2017-2030 (US$ Bn)
FIG. 35 Japan Graphics Add-in Board (AIB) Market, 2017-2030 (US$ Bn)
FIG. 36 India Graphics Add-in Board (AIB) Market, 2017-2030 (US$ Bn)
FIG. 37 South Korea Graphics Add-in Board (AIB) Market, 2017-2030 (US$ Bn)
FIG. 38 South-East Asia Graphics Add-in Board (AIB) Market, 2017-2030 (US$ Bn)
FIG. 39 Rest of Asia Pacific Graphics Add-in Board (AIB) Market, 2017-2030 (US$ Bn)
FIG. 40 Latin America Graphics Add-in Board (AIB) Market, 2017-2030 (US$ Bn)
FIG. 41 Brazil Graphics Add-in Board (AIB) Market, 2017-2030 (US$ Bn)
FIG. 42 Mexico Graphics Add-in Board (AIB) Market, 2017-2030 (US$ Bn)
FIG. 43 Rest of Latin America Graphics Add-in Board (AIB) Market, 2017-2030 (US$ Bn)
FIG. 44 Middle East & Africa Graphics Add-in Board (AIB) Market, 2017-2030 (US$ Bn)
FIG. 45 GCC Countries Graphics Add-in Board (AIB) Market, 2017-2030 (US$ Bn)
FIG. 46 South Africa Graphics Add-in Board (AIB) Market, 2017-2030 (US$ Bn)
FIG. 47 Rest of Middle East and Africa Graphics Add-in Board (AIB) Market, 2017-2030 (US$ Bn)

List of Tables
TABLE 1 Market Snapshot: Global Graphics Add-in Board (AIB) Market
TABLE 2 Global Graphics Add-in Board (AIB) Market: Market Drivers Impact Analysis
TABLE 3 Global Graphics Add-in Board (AIB) Market: Market Restraints Impact Analysis
TABLE 4 Global Graphics Add-in Board (AIB) Market, by Competitive Benchmarking, 2022
TABLE 5 Global Graphics Add-in Board (AIB) Market, by Geographical Presence Analysis, 2022
TABLE 6 Global Graphics Add-in Board (AIB) Market, by Key Strategies Analysis, 2022
TABLE 7 Global Graphics Add-in Board (AIB) Market, by Gaming, By Region, 2017-2022 (US$ Bn)
TABLE 8 Global Graphics Add-in Board (AIB) Market, by Gaming, By Region, 2023-2030 (US$ Bn)
TABLE 9 Global Graphics Add-in Board (AIB) Market, by Design and Visualization, By Region, 2017-2022 (US$ Bn)
TABLE 10 Global Graphics Add-in Board (AIB) Market, by Design and Visualization, By Region, 2023-2030 (US$ Bn)
TABLE 11 Global Graphics Add-in Board (AIB) Market, by High-performance Computing, By Region, 2017-2022 (US$ Bn)
TABLE 12 Global Graphics Add-in Board (AIB) Market, by High-performance Computing, By Region, 2023-2030 (US$ Bn)
TABLE 13 Global Graphics Add-in Board (AIB) Market, by Data Center, By Region, 2017-2022 (US$ Bn)
TABLE 14 Global Graphics Add-in Board (AIB) Market, by Data Center, By Region, 2023-2030 (US$ Bn)
TABLE 15 Global Graphics Add-in Board (AIB) Market, by Others, By Region, 2017-2022 (US$ Bn)
TABLE 16 Global Graphics Add-in Board (AIB) Market, by Others, By Region, 2023-2030 (US$ Bn)
TABLE 17 Global Graphics Add-in Board (AIB) Market, by Desktop, By Region, 2017-2022 (US$ Bn)
TABLE 18 Global Graphics Add-in Board (AIB) Market, by Desktop, By Region, 2023-2030 (US$ Bn)
TABLE 19 Global Graphics Add-in Board (AIB) Market, by Notebooks and Tablets, By Region, 2017-2022 (US$ Bn)
TABLE 20 Global Graphics Add-in Board (AIB) Market, by Notebooks and Tablets, By Region, 2023-2030 (US$ Bn)
TABLE 21 Global Graphics Add-in Board (AIB) Market, by Workstations, By Region, 2017-2022 (US$ Bn)
TABLE 22 Global Graphics Add-in Board (AIB) Market, by Workstations, By Region, 2023-2030 (US$ Bn)
TABLE 23 Global Graphics Add-in Board (AIB) Market, by Others, By Region, 2017-2022 (US$ Bn)
TABLE 24 Global Graphics Add-in Board (AIB) Market, by Others, By Region, 2023-2030 (US$ Bn)
TABLE 25 Global Graphics Add-in Board (AIB) Market, by Application, 2017-2022 (US$ Bn)
TABLE 26 Global Graphics Add-in Board (AIB) Market, by Application, 2023-2030 (US$ Bn)
TABLE 27 Global Graphics Add-in Board (AIB) Market, by End-Users, 2017-2022 (US$ Bn)
TABLE 28 Global Graphics Add-in Board (AIB) Market, by End-Users, 2023-2030 (US$ Bn)
TABLE 29 Global Graphics Add-in Board (AIB) Market, by Region, 2017-2022 (US$ Bn)
TABLE 30 Global Graphics Add-in Board (AIB) Market, by Region, 2023-2030 (US$ Bn)
TABLE 31 North America Graphics Add-in Board (AIB) Market, by Application, 2017-2022 (US$ Bn)
TABLE 32 North America Graphics Add-in Board (AIB) Market, by Application, 2023-2030 (US$ Bn)
TABLE 33 North America Graphics Add-in Board (AIB) Market, by End-Users, 2017-2022 (US$ Bn)
TABLE 34 North America Graphics Add-in Board (AIB) Market, by End-Users, 2023-2030 (US$ Bn)
TABLE 35 North America Graphics Add-in Board (AIB) Market, by Country, 2017-2022 (US$ Bn)
TABLE 36 North America Graphics Add-in Board (AIB) Market, by Country, 2023-2030 (US$ Bn)
TABLE 37 United States Graphics Add-in Board (AIB) Market, by Application, 2017-2022 (US$ Bn)
TABLE 38 United States Graphics Add-in Board (AIB) Market, by Application, 2023-2030 (US$ Bn)
TABLE 39 United States Graphics Add-in Board (AIB) Market, by End-Users, 2017-2022 (US$ Bn)
TABLE 40 United States Graphics Add-in Board (AIB) Market, by End-Users, 2023-2030 (US$ Bn)
TABLE 41 Canada Graphics Add-in Board (AIB) Market, by Application, 2017-2022 (US$ Bn)
TABLE 42 Canada Graphics Add-in Board (AIB) Market, by Application, 2023-2030 (US$ Bn)
TABLE 43 Canada Graphics Add-in Board (AIB) Market, by End-Users, 2017-2022 (US$ Bn)
TABLE 44 Canada Graphics Add-in Board (AIB) Market, by End-Users, 2023-2030 (US$ Bn)
TABLE 45 Mexico Graphics Add-in Board (AIB) Market, by Application, 2017-2022 (US$ Bn)
TABLE 46 Mexico Graphics Add-in Board (AIB) Market, by Application, 2023-2030 (US$ Bn)
TABLE 47 Mexico Graphics Add-in Board (AIB) Market, by End-Users, 2017-2022 (US$ Bn)
TABLE 48 Mexico Graphics Add-in Board (AIB) Market, by End-Users, 2023-2030 (US$ Bn)
TABLE 49 Europe Graphics Add-in Board (AIB) Market, by Application, 2017-2022 (US$ Bn)
TABLE 50 Europe Graphics Add-in Board (AIB) Market, by Application, 2023-2030 (US$ Bn)
TABLE 51 Europe Graphics Add-in Board (AIB) Market, by End-Users, 2017-2022 (US$ Bn)
TABLE 52 Europe Graphics Add-in Board (AIB) Market, by End-Users, 2023-2030 (US$ Bn)
TABLE 53 Europe Graphics Add-in Board (AIB) Market, by Country, 2017-2022 (US$ Bn)
TABLE 54 Europe Graphics Add-in Board (AIB) Market, by Country, 2023-2030 (US$ Bn)
TABLE 55 Germany Graphics Add-in Board (AIB) Market, by Application, 2017-2022 (US$ Bn)
TABLE 56 Germany Graphics Add-in Board (AIB) Market, by Application, 2023-2030 (US$ Bn)
TABLE 57 Germany Graphics Add-in Board (AIB) Market, by End-Users, 2017-2022 (US$ Bn)
TABLE 58 Germany Graphics Add-in Board (AIB) Market, by End-Users, 2023-2030 (US$ Bn)
TABLE 59 France Graphics Add-in Board (AIB) Market, by Application, 2017-2022 (US$ Bn)
TABLE 60 France Graphics Add-in Board (AIB) Market, by Application, 2023-2030 (US$ Bn)
TABLE 61 France Graphics Add-in Board (AIB) Market, by End-Users, 2017-2022 (US$ Bn)
TABLE 62 France Graphics Add-in Board (AIB) Market, by End-Users, 2023-2030 (US$ Bn)
TABLE 63 United Kingdom Graphics Add-in Board (AIB) Market, by Application, 2017-2022 (US$ Bn)
TABLE 64 United Kingdom Graphics Add-in Board (AIB) Market, by Application, 2023-2030 (US$ Bn)
TABLE 65 United Kingdom Graphics Add-in Board (AIB) Market, by End-Users, 2017-2022 (US$ Bn)
TABLE 66 United Kingdom Graphics Add-in Board (AIB) Market, by End-Users, 2023-2030 (US$ Bn)
TABLE 67 Italy Graphics Add-in Board (AIB) Market, by Application, 2017-2022 (US$ Bn)
TABLE 68 Italy Graphics Add-in Board (AIB) Market, by Application, 2023-2030 (US$ Bn)
TABLE 69 Italy Graphics Add-in Board (AIB) Market, by End-Users, 2017-2022 (US$ Bn)
TABLE 70 Italy Graphics Add-in Board (AIB) Market, by End-Users, 2023-2030 (US$ Bn)
TABLE 71 Spain Graphics Add-in Board (AIB) Market, by Application, 2017-2022 (US$ Bn)
TABLE 72 Spain Graphics Add-in Board (AIB) Market, by Application, 2023-2030 (US$ Bn)
TABLE 73 Spain Graphics Add-in Board (AIB) Market, by End-Users, 2017-2022 (US$ Bn)
TABLE 74 Spain Graphics Add-in Board (AIB) Market, by End-Users, 2023-2030 (US$ Bn)
TABLE 75 Rest of Europe Graphics Add-in Board (AIB) Market, by Application, 2017-2022 (US$ Bn)
TABLE 76 Rest of Europe Graphics Add-in Board (AIB) Market, by Application, 2023-2030 (US$ Bn)
TABLE 77 Rest of Europe Graphics Add-in Board (AIB) Market, by End-Users, 2017-2022 (US$ Bn)
TABLE 78 Rest of Europe Graphics Add-in Board (AIB) Market, by End-Users, 2023-2030 (US$ Bn)
TABLE 79 Asia Pacific Graphics Add-in Board (AIB) Market, by Application, 2017-2022 (US$ Bn)
TABLE 80 Asia Pacific Graphics Add-in Board (AIB) Market, by Application, 2023-2030 (US$ Bn)
TABLE 81 Asia Pacific Graphics Add-in Board (AIB) Market, by End-Users, 2017-2022 (US$ Bn)
TABLE 82 Asia Pacific Graphics Add-in Board (AIB) Market, by End-Users, 2023-2030 (US$ Bn)
TABLE 83 China Graphics Add-in Board (AIB) Market, by Application, 2017-2022 (US$ Bn)
TABLE 84 China Graphics Add-in Board (AIB) Market, by Application, 2023-2030 (US$ Bn)
TABLE 85 China Graphics Add-in Board (AIB) Market, by End-Users, 2017-2022 (US$ Bn)
TABLE 86 China Graphics Add-in Board (AIB) Market, by End-Users, 2023-2030 (US$ Bn)
TABLE 87 Japan Graphics Add-in Board (AIB) Market, by Application, 2017-2022 (US$ Bn)
TABLE 88 Japan Graphics Add-in Board (AIB) Market, by Application, 2023-2030 (US$ Bn)
TABLE 89 Japan Graphics Add-in Board (AIB) Market, by End-Users, 2017-2022 (US$ Bn)
TABLE 90 Japan Graphics Add-in Board (AIB) Market, by End-Users, 2023-2030 (US$ Bn)
TABLE 91 India Graphics Add-in Board (AIB) Market, by Application, 2017-2022 (US$ Bn)
TABLE 92 India Graphics Add-in Board (AIB) Market, by Application, 2023-2030 (US$ Bn)
TABLE 93 India Graphics Add-in Board (AIB) Market, by End-Users, 2017-2022 (US$ Bn)
TABLE 94 India Graphics Add-in Board (AIB) Market, by End-Users, 2023-2030 (US$ Bn)
TABLE 95 South Korea Graphics Add-in Board (AIB) Market, by Application, 2017-2022 (US$ Bn)
TABLE 96 South Korea Graphics Add-in Board (AIB) Market, by Application, 2023-2030 (US$ Bn)
TABLE 97 South Korea Graphics Add-in Board (AIB) Market, by End-Users, 2017-2022 (US$ Bn)
TABLE 98 South Korea Graphics Add-in Board (AIB) Market, by End-Users, 2023-2030 (US$ Bn)
TABLE 99 South-East Asia Graphics Add-in Board (AIB) Market, by Application, 2017-2022 (US$ Bn)
TABLE 100 South-East Asia Graphics Add-in Board (AIB) Market, by Application, 2023-2030 (US$ Bn)
TABLE 101 South-East Asia Graphics Add-in Board (AIB) Market, by End-Users, 2017-2022 (US$ Bn)
TABLE 102 South-East Asia Graphics Add-in Board (AIB) Market, by End-Users, 2023-2030 (US$ Bn)
TABLE 103 Rest of Asia Pacific Graphics Add-in Board (AIB) Market, by Application, 2017-2022 (US$ Bn)
TABLE 104 Rest of Asia Pacific Graphics Add-in Board (AIB) Market, by Application, 2023-2030 (US$ Bn)
TABLE 105 Rest of Asia Pacific Graphics Add-in Board (AIB) Market, by End-Users, 2017-2022 (US$ Bn)
TABLE 106 Rest of Asia Pacific Graphics Add-in Board (AIB) Market, by End-Users, 2023-2030 (US$ Bn)
TABLE 107 Latin America Graphics Add-in Board (AIB) Market, by Application, 2017-2022 (US$ Bn)
TABLE 108 Latin America Graphics Add-in Board (AIB) Market, by Application, 2023-2030 (US$ Bn)
TABLE 109 Latin America Graphics Add-in Board (AIB) Market, by End-Users, 2017-2022 (US$ Bn)
TABLE 110 Latin America Graphics Add-in Board (AIB) Market, by End-Users, 2023-2030 (US$ Bn)
TABLE 111 Brazil Graphics Add-in Board (AIB) Market, by Application, 2017-2022 (US$ Bn)
TABLE 112 Brazil Graphics Add-in Board (AIB) Market, by Application, 2023-2030 (US$ Bn)
TABLE 113 Brazil Graphics Add-in Board (AIB) Market, by End-Users, 2017-2022 (US$ Bn)
TABLE 114 Brazil Graphics Add-in Board (AIB) Market, by End-Users, 2023-2030 (US$ Bn)
TABLE 115 Argentina Graphics Add-in Board (AIB) Market, by Application, 2017-2022 (US$ Bn)
TABLE 116 Argentina Graphics Add-in Board (AIB) Market, by Application, 2023-2030 (US$ Bn)
TABLE 117 Argentina Graphics Add-in Board (AIB) Market, by End-Users, 2017-2022 (US$ Bn)
TABLE 118 Argentina Graphics Add-in Board (AIB) Market, by End-Users, 2023-2030 (US$ Bn)
TABLE 119 Rest of Latin America Graphics Add-in Board (AIB) Market, by Application, 2017-2022 (US$ Bn)
TABLE 120 Rest of Latin America Graphics Add-in Board (AIB) Market, by Application, 2023-2030 (US$ Bn)
TABLE 121 Rest of Latin America Graphics Add-in Board (AIB) Market, by End-Users, 2017-2022 (US$ Bn)
TABLE 122 Rest of Latin America Graphics Add-in Board (AIB) Market, by End-Users, 2023-2030 (US$ Bn)
TABLE 123 Middle East and Africa Graphics Add-in Board (AIB) Market, by Application, 2017-2022 (US$ Bn)
TABLE 124 Middle East and Africa Graphics Add-in Board (AIB) Market, by Application, 2023-2030 (US$ Bn)
TABLE 125 Middle East and Africa Graphics Add-in Board (AIB) Market, by End-Users, 2017-2022 (US$ Bn)
TABLE 126 Middle East and Africa Graphics Add-in Board (AIB) Market, by End-Users, 2023-2030 (US$ Bn)
TABLE 127 GCC Countries Graphics Add-in Board (AIB) Market, by Application, 2017-2022 (US$ Bn)
TABLE 128 GCC Countries Graphics Add-in Board (AIB) Market, by Application, 2023-2030 (US$ Bn)
TABLE 129 GCC Countries Graphics Add-in Board (AIB) Market, by End-Users, 2017-2022 (US$ Bn)
TABLE 130 GCC Countries Graphics Add-in Board (AIB) Market, by End-Users, 2023-2030 (US$ Bn)
TABLE 131 South Africa Graphics Add-in Board (AIB) Market, by Application, 2017-2022 (US$ Bn)
TABLE 132 South Africa Graphics Add-in Board (AIB) Market, by Application, 2023-2030 (US$ Bn)
TABLE 133 South Africa Graphics Add-in Board (AIB) Market, by End-Users, 2017-2022 (US$ Bn)
TABLE 134 South Africa Graphics Add-in Board (AIB) Market, by End-Users, 2023-2030 (US$ Bn)
TABLE 135 Rest of Middle East and Africa Graphics Add-in Board (AIB) Market, by Application, 2017-2022 (US$ Bn)
TABLE 136 Rest of Middle East and Africa Graphics Add-in Board (AIB) Market, by Application, 2023-2030 (US$ Bn)
TABLE 137 Rest of Middle East and Africa Graphics Add-in Board (AIB) Market, by End-Users, 2017-2022 (US$ Bn)
TABLE 138 Rest of Middle East and Africa Graphics Add-in Board (AIB) Market, by End-Users, 2023-2030 (US$ Bn)

Frequently Asked Questions

How big is the global Graphics Add-in Board (AIB) market right now?

In 2022, the global Graphics Add-in Board (AIB) market was estimated to be worth USD 15.2 billion.

What is the predicted growth rate of the Graphics Add-in Board (AIB) market between 2023 and 2030?

The Graphics Add-in Board (AIB) market is estimated to enhance at a CAGR of 18.50% between 2023 and 2030, reaching USD 49.87 billion in 2030.

Which segment is leading the market in terms of application?

Gaming is the leading segment by application.

Which segment is predicted to have the highest CAGR during the forecast period?

During the forecast period, the Workstations category is expected to have the most significant CAGR.

Which segments are covered in the global Graphics Add-in Board (AIB) Market report?

The global Graphics Add-in Board (AIB) market research report is divided into the following categories: By Application, By End-Users

What region is driving the expansion of the Graphics Add-in Board (AIB) industry?

Asia Pacific is driving the growth of the Graphics Add-in Board (AIB) industry.

Who are the top market participants in the global Graphics Add-in Board (AIB) industry?

The top players include Nvidia Corporation, Advanced Micro Devices, Inc., AsusTek Computer Inc., and Intel Corporation. Other major players include EVGA Corporation, Gigabyte Technology, Sapphire Technology, and Zotac.

What are the primary market drivers in the Graphics Add-in Board (AIB) industry?

The rising use of consumer electronics with touchscreens, as well as the rising demand for high-quality graphics, are driving market growth.

What are the most significant market restrictions in the Graphics Add-in Board (AIB) industry?

The main challenges to market growth are the shift towards mobile devices and supply chain disruptions.

What are the most important market opportunities in the Graphics Add-in Board (AIB) industry?

Collaboration with Cloud Gaming and Streaming Services, as well as the expansion of the gaming industry, are the market’s significant opportunities.

Supervisory Control and Data Acquisition (SCADA) Market

Published:
Report ID: 10131

India CCTV Camera Market

Published:
Report ID: 37170

Asia Pacific Microprocessor and GPU Market

Published:
Report ID: 37122

EDiscovery Market

Published:
Report ID: 4744

Simulation Software Market

Published:
Report ID: 36908

Bioinformatics Market

Published:
Report ID: 14530

Fish Hook Sensor Market

Published:
Report ID: 36774

Big Data Services Market

Published:
Report ID: 3020

Enterprise Asset Management Market

Published:
Report ID: 5338

South Korea Wifi Chipset Market

Published:
Report ID: 36535

Saudi Arabia Managed Security Services Market

Published:
Report ID: 36393

Purchase Options

$2999
Delivery Format: Excel.
$4999
Designed for the individual purchaser.
$6999
Users located at a single corporate site or regional office.
$7999
Allowed for unlimited sharing globally within one company.
Smallform of Sample request

Have a question?

User Profile

Don’t settle for less – trust Mitul to help you find the best solution.

Report delivery within 24 to 48 hours

– Other Info –

What people say?-

User Review

I am very impressed with the information in this report. The author clearly did their research when they came up with this product and it has already given me a lot of ideas.

Jana Schmidt
CEDAR CX Technologies

– Connect with us –

Phone

+91 6232 49 3207


support

24/7 Research Support


sales@credenceresearch.com

– Research Methodology –

Going beyond the basics: advanced techniques in research methodology

– Trusted By –

Pepshi, LG, Nestle
Motorola, Honeywell, Johnson and johnson
LG Chem, SIEMENS, Pfizer
Unilever, Samsonite, QIAGEN