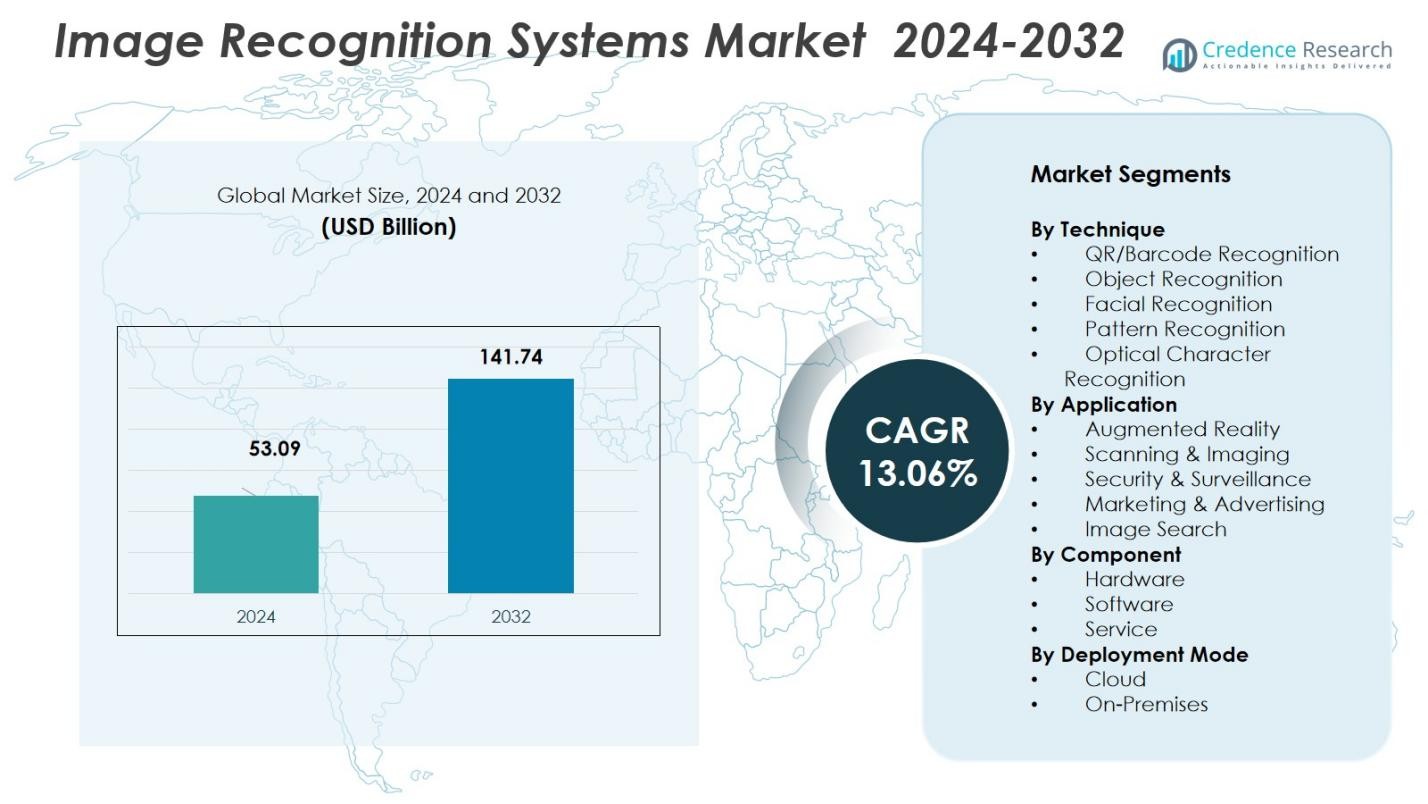
Home » Information and Communications Technology » Technology & Media » Image Recognition Systems Market

Image Recognition Systems Market By Image Processor Technology (Multiple Instruction Multiple Data (MIMD), Single Instruction Multiple Data (SIMD)) By End-Use (Camera Device, AR/VR Devices, Mobile Phones, Smart Phones, Tablets ,Others ) Growth, Future Prospects & Competitive Analysis, 2016 – 2030

Price: $4999

Published: | Report ID: 6072 | Report Format : PDF

About this report

The global image recognition systems market report explores the critical analysis of the image recognition systems industry using key parameters. The report consists of investment strategies, the need for investments in the image recognition systems industry, and the multiple benefits for investors. Importantly, this report sets out major changes in the global technical regulations for the image recognition systems industry and how economic and non-economic barriers are helping the image recognition systems market growth. Moreover, the report analyses the global, regional, and country-level historic and forecasted market size. The report provides a comprehensive analysis of key investment propositions, demand and supply gap, competitors positioning, STAR analysis, SRC analysis, and Tornado analysis. Key technological developments and other analyses such as porter’s five forces analysis, PESTEL analysis, value chain analysis, etc.

Key Highlights of the report

How are the major segments performing in the image recognition systems market?

  • In 2021, the digital segment accounted for the market’s highest share because using a digital computer to process digital images through an algorithm and digital image processing has several advantages over analog image processing.
  • In 2021, the three-dimensional segment was anticipated to have a significant share of the global image recognition systems market because it can be used for a wide range of applications – analyzing, measuring, and positioning parts are among the most important.
  • In 2021, the single instructions multi-data segments were anticipated to have a significant share of the global image recognition systems market because it is a method of computing that processes several data values, usually a power of two, with a single instruction.
  • In 2021, the AR/VR devices segment was anticipated to have a significant share of the global image recognition systems market because cutting-edge technologies like AV/VR are developing quickly and have a bright future.
  • In 2021, the medical segment was anticipated to have a significant share of the global image recognition systems market because these techniques save time and cost, create new diagnoses, and provide different treatment opportunities.

What is the market size of image recognition systems regarding value?

The global image recognition systems market is estimated to grow at a significant CAGR of 18.50% in the upcoming years. The global image recognition systems industry was estimated to be worth USD 28.1 million in 2021 and was expected to be worth USD 77.8 million by 2028.

Design Element 2

Access crucial information at unmatched prices!

Request your free sample report today & start making informed decisions powered by Credence Research!

Download Free Sample
CTA Design Element 3

Which region dominated the image recognition systems market?

In 2021, the North American region was expected to have the highest share of the global market over the forecast year due to the presence of a large number of key market players. The early adoption of computer vision technologies strengthens the region’s leading position in the global market. Additionally, increased adoption of software-driven business process automation using cognitive technologies such as natural language processing, text recognition, and image detection & recognition is also supporting the regional market growth.

How is the U.S. market performing in the image recognition systems market?

In 2021, the United States region was anticipated to hold a significant global image recognition systems market share. The growing adoption of facial technology in the U.S. emphasizes the image recognition market in this region. According to the Department of Homeland Security, image recognition systems are expected to cover 97 percent of airline passengers in the coming years.

What is the competitive environment of the image recognition systems market?

The key market players are investing in developing innovative image identification technologies. To enhance the accuracy of systems, cutting-edge technologies such as augmented reality, artificial intelligence, and machine learning algorithms are being used by the key players. Tech giants such as Amazon Web Services (AWS), Microsoft Corporation, Google LLC., and IBM Corporation are investing heavily to advance their image recognition offerings.

Executive Summary

How has the rising popularity of AI-driven technologies boosted the market?

An image recognition system uses a machine learning (ML) or deep learning method to a set of photographs to extract features, which are then used to gain insightful knowledge. Artificial intelligence and machine learning growth are sparking industry and business model changes. Numerous applications, such as computer vision, pattern recognition, machine vision, and many others, are being driven by A.I. The top revenue-generating applications of A.I. across industries are anticipated to include static image detection, recognition, classification, and tagging. The demand for image recognition systems is also being stimulated by AI-driven autonomous machine vision vehicles. Additionally, this market is becoming more valuable due to several AI-based healthcare applications like chronic diagnosis and contemporary radiological interpretation. Thus, the demand for the product is increasing as artificial intelligence-based applications are developed.

Which are the key investments by the Image recognition systems Market players?

Companies that lack financial resources do not opt for image recognition offerings even if they are interested in such solutions to increase productivity. Well-known vendor solutions in the market, such as Microsoft Computer Vision API, Microsoft Emotion API, Amazon Rekognition, Google Cloud Vision API, and IBM Watson Visual Recognition, are highly priced, making it difficult for small companies to deploy them.

Some major players in the image recognition systems market are IBM, Google, Qualcomm Technologies, Inc., Microsoft, Amazon Web Services, Inc., Trax Image Recognition, NEC Corporation, Partium.io, LTU Tech, and Huawei Technologies Co., Ltd.

What are the major factors driving the image recognition systems market?

The adoption of artificial intelligence technology for image recognition is continuously rising. The latest smartphones commonly used are in-built with an AI-based camera for facial recognition of the user. The integration of artificial intelligence is providing with standard features. Moreover, governments are also looking towards enhancing A.I. capabilities in healthcare, transport, etc. Integrating big data analytics offers advanced image analysis and recognition technology. The deployment of machine learning also emphasizes pattern recognition technology for classifying the data based on knowledge. Additionally, the rising use of social media is enhancing big data analytics and machine learning in image recognition technology. Using big data analytics in social sites will automate image recognition and allow linking and tagging of the individual. Thus, the growing influence of using the latest technologies, including augmented and virtual reality, will drive the image recognition market shortly.

What are the significant risks for the image recognition systems market?

The images analyzed using image recognition are aligned in different directions in the real world. This alignment leads the system or the camera to record inaccurate values. Further, it fails to understand the changing alignment of the image, which creates a considerable challenge for image recognition technology. Moreover, the low-resolution size of the image also sometimes affects the classification of the object and leads to the deformation of the picture. These common factors will lead to hindering the growth of the image recognition market.

Which is the key application in the image recognition systems market?

Medical image recognition system plays a significant role in different clinical applications, such as medical procedures used for early detection, monitoring, diagnosis, and treatment evaluation of various medical conditions.

How is the image recognition systems market performing in regions?

North America s expected to account for a significant revenue share of the global market due to the rising number of smartphone users and electronic gadgets integrated with image recognition systems applications in the region. Increasing integration of A.I. and mobile computing platforms in the field of digital shopping and e-commerce is contributing to the growth of the image recognition systems market. Furthermore, U.S. government organizations’ rising use of image recognition technologies drives the region’s market revenue growth.

Furthermore, due to the increasing adoption of cognitive applications across the region’s rapidly expanding I.T. industry, Asia Pacific is predicted to experience the highest CAGR during the forecast period. Additionally, the rapidification of chronic disease diagnosis thanks to A.I. in healthcare and image detection and recognition technology is boosting the local market.

What is the regulatory landscape for the image recognition systems market?

Government bans on facial recognition systems for security and surveillance have majorly slowed down image identification technology adoption. The pandemic has slowed production and logistic processes, reducing demand for advanced technologies.

Shape Your Report to Specific Countries or Regions & Enjoy 30% Off!

What are the major players planning for the future of the image recognition systems market?

The major market participants make investments in the creation of cutting-edge, novel picture identification technology. The major firms are also utilizing cutting-edge technology like augmented reality, artificial intelligence, and machine learning algorithms to improve the accuracy of their systems. Tech giants such as Amazon Web Services (AWS), Microsoft Corporation, Google LLC., and IBM Corporation are investing heavily to advance their image recognition offerings. Enhancements to the product portfolios are helping key players maintain their competitive edge. These companies also engage in strategic partnerships, acquisitions, and collaborations to expand their businesses and distribution networks to maintain their market lead. Technology launches, acquisitions, and R&D activities are key strategies players adopt in the image recognition systems market.

REPORT ATTRIBUTE DETAILS
Image Recognition Systems Market by Volume Yes
Image Recognition Systems Market by Value Yes
Image Recognition Systems Market, Tornado Analysis Yes
Image Recognition Systems Market, STAR Analysis Yes
Image Recognition Systems Market, SRC Analysis Yes
Image Recognition Systems Market Pricing Analysis Yes (On Demand)
Image Recognition Systems Market Segment Analysis By Processing Method (Analog, Digital),

By Image Type (One Dimensional, Two Dimensional, Three Dimensional)

By Image Processor Technology (Multiple Instruction Multiple Data (Mmid), Single Instruction Multiple Data (Smid))

By End-Use (Camera Device, Ar/Vr Devices, Mobile Phones, Smart Phones, Tablets, Others)

By Application (Medical, Industrial, Military, Others)

Image Recognition Systems Market, Regional Analysis North America (the U.S. and Canada)

Europe (Germany, UK, France, Italy, Spain, and the Rest of Europe)

Asia Pacific (China, India, Japan, South Korea, Southeast Asia, and the Rest of Asia Pacific)

Latin America (Brazil, Mexico, and the Rest of Latin America)

The Middle East and Africa (GCC Countries, South Africa, and the Rest of the Middle East and Africa)

Image Recognition Systems Market Key Companies IBM, Google, Qualcomm Technologies, Inc., Microsoft, Amazon Web Services, Inc., Trax Image Recognition, NEC Corporation, Partium.io, LTU Tech, and Huawei Technologies Co., Ltd.
Image Recognition Systems Market Competitive Landscape Market Share Analysis

Competitive Benchmarking

Key Players Market Positioning

Geographical Presence Analysis

Major Strategies Adopted

Segmentation of the Global Image Recognition Systems Market-

Global Image Recognition Systems Market – By Processing Method

  • Analog
  • Digital

Global Image Recognition Systems Market – By Image Type

  • One Dimensional
  • Two Dimensional
  • Three Dimensional

Global Image Recognition Systems Market – By Image Processor Technology

  • Multiple Instruction Multiple Data (MIMD)
  • Single Instruction Multiple Data (SIMD)

Global Image Recognition Systems Market – By End-Use

  • Camera Device
  • AR/VR Devices
  • Mobile Phones
  • Smart Phones
  • Tablets
  • Others

Global Image Recognition Systems Market – By Application

  • Medical
  • Industrial
  • Military
  • Others

Global Image Recognition Systems Market – By Region

  • North America
    • US
    • Canada
  • Europe
    • Germany
    • France
    • The U.K.
    • Italy
    • Spain
    • Rest of Europe
  • Asia Pacific
    • China
    • Japan
    • India
    • South Korea
    • South-east Asia
    • Rest of Asia Pacific
  • Latin America
    • Brazil
    • Mexico
    • Rest of Latin America
  • Middle East & Africa
    • GCC Countries
    • South Africa
    • Rest of the Middle East and Africa

1. Preface
1.1. Report Description
1.1.1. Purpose of the Report
1.1.2. Target Audience
1.1.3. USP and Key Offerings
1.2. Research Scope
1.3. Research Methodology
1.3.1. Phase I – Secondary Research
1.3.2. Phase II – Primary Research
1.3.3. Phase III – Expert Panel Review
1.3.4. Approach Adopted
1.3.4.1. Top-Down Approach
1.3.4.2. Bottom-Up Approach
1.3.5. Assumptions
1.4. Market Segmentation

2. Executive Summary
2.1. Market Snapshot: Global Image Recognition Systems Market
2.2. Global Image Recognition Systems Market, By Processing Method
2.3. Global Image Recognition Systems Market, By Image Type
2.4. Global Image Recognition Systems Market, By Image Processor Technology
2.5. Global Image Recognition Systems Market, By End-Use
2.6. Global Image Recognition Systems Market, By Application
2.7. Global Image Recognition Systems Market, By Region

3. Market Dynamics & Factors Analysis
3.1. Introduction
3.1.1. Global Image Recognition Systems Market Value, 2016-2028, (US$ Bn)
3.2. Market Dynamics
3.2.1. Key Growth Trends
3.2.2. Market Drivers
3.2.3. Market Restraints
3.2.4. Market Opportunities
3.2.5. Major Industry Challenges
3.3. Attractive Investment Proposition,2021
3.3.1. Processing Method
3.3.2. Image Type
3.3.3. Image Processor Technology
3.3.4. End-Use
3.3.5. Application
3.3.6. Geography

4. Premium Insights
4.1. STAR (Situation, Task, Action, Results) Analysis
4.2. Porter’s Five Forces Analysis
4.2.1. Threat of New Entrants
4.2.2. Bargaining Power of Buyers/Consumers
4.2.3. Bargaining Power of Suppliers
4.2.4. Threat of Substitute Types
4.2.5. Intensity of Competitive Rivalry
4.3. Value Chain Analysis
4.4. Technology Analysis
4.5. Marketing Strategy Analysis
4.5.1. Direct Marketing
4.5.2. Indirect Marketing
4.5.3. Marketing Channel Development Trend

5. Market Positioning of Key Players, 2021
5.1. Company market share of key players, 2021
5.2. Competitive Benchmarking
5.3. Market Positioning of Key Vendors
5.4. Geographical Presence Analysis
5.5. Major Strategies Adopted by Key Players
5.5.1. Key Strategies Analysis
5.5.2. Mergers and Acquisitions
5.5.3. Partnerships
5.5.4. Product Launch
5.5.5. Geographical Expansion
5.5.6. Others

6. COVID 19 Impact Analysis
6.1. Global Image Recognition Systems Market Pre Vs Post COVID 19, 2019 – 2028
6.2. Impact on Import & Export
6.3. Impact on Demand & Supply

7. Global Image Recognition Systems Market
7.1. Global Image Recognition Systems Market, by Processing Method, 2016-2028(US$ Bn)
7.1.1. Overview
7.1.2. Global Image Recognition Systems Market, By Processing Method, 2021 vs 2028 (in%)
7.1.3. Global Image Recognition Systems Market, By Analog, 2016-2028 (US$ Bn)
7.1.4. Global Image Recognition Systems Market, Digital, 2016-2028 (US$ Bn)
7.2. Global Image Recognition Systems Market, by Image Type, 2016-2028(US$ Bn)
7.2.1. Overview
7.2.2. Global Image Recognition Systems Market, By Image Type, 2021 vs 2028 (in%)
7.2.3. Global Image Recognition Systems Market, By One Dimensional, 2016-2028 (US$ Bn)
7.2.4. Global Image Recognition Systems Market, By Two Dimensional, 2016-2028 (US$ Bn)
7.2.5. Global Image Recognition Systems Market, By Three Dimensional, 2016-2028 (US$ Bn)
7.3. Global Image Recognition Systems Market, by Image Processor Technology, 2016-2028(US$ Bn)
7.3.1. Overview
7.3.2. Global Image Recognition Systems Market, By Image Processor Technology, 2021 vs 2028 (in%)
7.3.3. Global Image Recognition Systems Market, By Multiple Instruction Multiple Data (Mmid), 2016-2028 (US$ Bn)
7.3.4. Global Image Recognition Systems Market, By Single Instruction Multiple Data (Smid), 2016-2028 (US$ Bn)
7.4. Global Image Recognition Systems Market, By End-Use, 2016-2028(US$ Bn)
7.4.1. Overview
7.4.2. Global Image Recognition Systems Market, By End-Use, 2021 vs 2028 (in%)
7.4.3. Global Image Recognition Systems Market, By Camera Device, 2016-2028 (US$ Bn)
7.4.4. Global Image Recognition Systems Market, By Ar/Vr Devices, 2016-2028 (US$ Bn)
7.4.5. Global Image Recognition Systems Market, By Mobile Phones, 2016-2028 (US$ Bn)
7.4.6. Global Image Recognition Systems Market, By Smart Phones, 2016-2028 (US$ Bn)
7.4.7. Global Image Recognition Systems Market, By Tablets, 2016-2028 (US$ Bn)
7.4.8. Global Image Recognition Systems Market, By Others, 2016-2028 (US$ Bn)
7.5. Global Image Recognition Systems Market, by Application, 2016-2028(US$ Bn)
7.5.1. Overview
7.5.2. Global Image Recognition Systems Market, By Application, 2021 vs 2028 (in%)
7.5.3. Global Image Recognition Systems Market, By Medical, 2016-2028 (US$ Bn)
7.5.4. Global Image Recognition Systems Market, By Industrial, 2016-2028 (US$ Bn)
7.5.5. Global Image Recognition Systems Market, By Military, 2016-2028 (US$ Bn)
7.5.6. Global Image Recognition Systems Market, By Others, 2016-2028 (US$ Bn)

8. North America Image Recognition Systems Market Analysis
8.1. North America Image Recognition Systems Market, by Processing Method, 2016-2028(US$ Bn)
8.1.1. Overview
8.1.2. SRC Analysis
8.2. North America Image Recognition Systems Market, by Image Type, 2016-2028(US$ Bn)
8.2.1. Overview
8.2.2. SRC Analysis
8.3. North America Image Recognition Systems Market, by Image Processor Technology, 2016-2028(US$ Bn)
8.3.1. Overview
8.3.2. SRC Analysis
8.4. North America Image Recognition Systems Market, By End-Use, 2016-2028(US$ Bn)
8.4.1. Overview
8.4.2. SRC Analysis
8.5. North America Image Recognition Systems Market, by Application, 2016-2028(US$ Bn)
8.5.1. Overview
8.5.2. SRC Analysis
8.6. North America Image Recognition Systems Market, by Country, 2016-2028 (US$ Bn)
8.6.1. U.S.
8.6.1.1. U.S. Image Recognition Systems Market Estimates and Forecast, 2016-2028 (US$ Bn)
8.6.1.2. U.S. Image Recognition Systems, By Processing Method, 2016-2028 (US$ Bn)
8.6.1.3. U.S. Image Recognition Systems, By Image Type, 2016-2028 (US$ Bn)
8.6.1.4. U.S. Image Recognition Systems, By Image Processor Technology, 2016-2028 (US$ Bn)
8.6.1.5. U.S. Image Recognition Systems, By End-Use, 2016-2028 (US$ Bn)
8.6.1.6. U.S. Image Recognition Systems, By Application, 2016-2028 (US$ Bn)
8.6.2. Canada
8.6.2.1. Canada Image Recognition Systems Market Estimates and Forecast, 2016-2028 (US$ Bn)
8.6.2.2. Canada Image Recognition Systems, By Processing Method, 2016-2028 (US$ Bn)
8.6.2.3. Canada Image Recognition Systems, By Image Type, 2016-2028 (US$ Bn)
8.6.2.4. Canada Image Recognition Systems, By Image Processor Technology, 2016-2028 (US$ Bn)
8.6.2.5. Canada Image Recognition Systems, By End-Use, 2016-2028 (US$ Bn)
8.6.2.6. Canada Image Recognition Systems, By Application, 2016-2028 (US$ Bn)

9. Europe Image Recognition Systems Market Analysis
9.1. Europe Image Recognition Systems Market, by Processing Method, 2016-2028(US$ Bn)
9.1.1. Overview
9.1.2. SRC Analysis
9.2. Europe Image Recognition Systems Market, by Image Type, 2016-2028(US$ Bn)
9.2.1. Overview
9.2.2. SRC Analysis
9.3. Europe Image Recognition Systems Market, by Image Processor Technology, 2016-2028(US$ Bn)
9.3.1. Overview
9.3.2. SRC Analysis
9.4. Europe Image Recognition Systems Market, By End-Use, 2016-2028(US$ Bn)
9.4.1. Overview
9.4.2. SRC Analysis
9.5. Europe Image Recognition Systems Market, by Application, 2016-2028(US$ Bn)
9.5.1. Overview
9.5.2. SRC Analysis
9.6. Europe Image Recognition Systems Market, by Country, 2016-2028 (US$ Bn)
9.6.1. Germany
9.6.1.1. Germany Image Recognition Systems Market Estimates and Forecast, 2016-2028 (US$ Bn)
9.6.1.2. Germany Image Recognition Systems, By Processing Method, 2016-2028 (US$ Bn)
9.6.1.3. Germany Image Recognition Systems, By Image Type, 2016-2028 (US$ Bn)
9.6.1.4. Germany Image Recognition Systems, By Image Processor Technology, 2016-2028 (US$ Bn)
9.6.1.5. Germany Image Recognition Systems, By End-Use, 2016-2028 (US$ Bn)
9.6.1.6. Germany Image Recognition Systems, By Application, 2016-2028 (US$ Bn)
9.6.2. France
9.6.2.1. France Image Recognition Systems Market Estimates and Forecast, 2016-2028 (US$ Bn)
9.6.2.2. France Image Recognition Systems, By Processing Method, 2016-2028 (US$ Bn)
9.6.2.3. France Image Recognition Systems, By Image Type, 2016-2028 (US$ Bn)
9.6.2.4. France Image Recognition Systems, By Image Processor Technology, 2016-2028 (US$ Bn)
9.6.2.5. France Image Recognition Systems, By End-Use, 2016-2028 (US$ Bn)
9.6.2.6. France Image Recognition Systems, By Application, 2016-2028 (US$ Bn)
9.6.3. UK
9.6.3.1. UK Image Recognition Systems Market Estimates and Forecast, 2016-2028 (US$ Bn)
9.6.3.2. UK Image Recognition Systems, By Processing Method, 2016-2028 (US$ Bn)
9.6.3.3. UK Image Recognition Systems, By Image Type, 2016-2028 (US$ Bn)
9.6.3.4. UK Image Recognition Systems, By Image Processor Technology, 2016-2028 (US$ Bn)
9.6.3.5. UK Image Recognition Systems, By End-Use, 2016-2028 (US$ Bn)
9.6.3.6. UK Image Recognition Systems, By Application, 2016-2028 (US$ Bn)
9.6.4. Italy
9.6.4.1. Italy Image Recognition Systems Market Estimates and Forecast, 2016-2028 (US$ Bn)
9.6.4.2. Italy Image Recognition Systems, By Processing Method, 2016-2028 (US$ Bn)
9.6.4.3. Italy Image Recognition Systems, By Image Type, 2016-2028 (US$ Bn)
9.6.4.4. Italy Image Recognition Systems, By Image Processor Technology, 2016-2028 (US$ Bn)
9.6.4.5. Italy Image Recognition Systems, By End-Use, 2016-2028 (US$ Bn)
9.6.4.6. Italy Image Recognition Systems, By Application, 2016-2028 (US$ Bn)
9.6.5. Spain
9.6.5.1. Spain Image Recognition Systems Market Estimates and Forecast, 2016-2028 (US$ Bn)
9.6.5.2. Spain Image Recognition Systems, By Processing Method, 2016-2028 (US$ Bn)
9.6.5.3. Spain Image Recognition Systems, By Image Type, 2016-2028 (US$ Bn)
9.6.5.4. Spain Image Recognition Systems, By Image Processor Technology, 2016-2028 (US$ Bn)
9.6.5.5. Spain Image Recognition Systems, By End-Use, 2016-2028 (US$ Bn)
9.6.5.6. Spain Image Recognition Systems, By Application, 2016-2028 (US$ Bn)
9.6.6. Rest of Europe
9.6.6.1. Rest of Europe Image Recognition Systems Market Estimates and Forecast, 2016-2028 (US$ Bn)
9.6.6.2. Rest of Europe Image Recognition Systems, By Processing Method, 2016-2028 (US$ Bn)
9.6.6.3. Rest of Europe Image Recognition Systems, By Image Type, 2016-2028 (US$ Bn)
9.6.6.4. Rest of Europe Image Recognition Systems, By Image Processor Technology, 2016-2028 (US$ Bn)
9.6.6.5. Rest of Europe Image Recognition Systems, By End-Use, 2016-2028 (US$ Bn)
9.6.6.6. Rest of Europe Image Recognition Systems, By Application, 2016-2028 (US$ Bn)

10. Asia Pacific Image Recognition Systems Market Analysis
10.1. Asia Pacific Image Recognition Systems Market, by Processing Method, 2016-2028(US$ Bn)
10.1.1. Overview
10.1.2. SRC Analysis
10.2. Asia Pacific Image Recognition Systems Market, by Image Type, 2016-2028(US$ Bn)
10.2.1. Overview
10.2.2. SRC Analysis
10.3. Asia Pacific Image Recognition Systems Market, by Image Processor Technology, 2016-2028(US$ Bn)
10.3.1. Overview
10.3.2. SRC Analysis
10.4. Asia Pacific Image Recognition Systems Market, By End-Use, 2016-2028(US$ Bn)
10.4.1. Overview
10.4.2. SRC Analysis
10.5. Asia Pacific Image Recognition Systems Market, by Application, 2016-2028(US$ Bn)
10.5.1. Overview
10.5.2. SRC Analysis
10.6. Asia Pacific Image Recognition Systems Market, by Country, 2016-2028 (US$ Bn)
10.6.1. China
10.6.1.1. China Image Recognition Systems Market Estimates and Forecast, 2016-2028 (US$ Bn)
10.6.1.2. China Image Recognition Systems, By Processing Method, 2016-2028 (US$ Bn)
10.6.1.3. China Image Recognition Systems, By Image Type, 2016-2028 (US$ Bn)
10.6.1.4. China Image Recognition Systems, By Image Processor Technology, 2016-2028 (US$ Bn)
10.6.1.5. China Image Recognition Systems, By End-Use, 2016-2028 (US$ Bn)
10.6.1.6. China Image Recognition Systems, By Application, 2016-2028 (US$ Bn)
10.6.2. Japan
10.6.2.1. Japan Image Recognition Systems Market Estimates and Forecast, 2016-2028 (US$ Bn)
10.6.2.2. Japan Image Recognition Systems, By Processing Method, 2016-2028 (US$ Bn)
10.6.2.3. Japan Image Recognition Systems, By Image Type, 2016-2028 (US$ Bn)
10.6.2.4. Japan Image Recognition Systems, By Image Processor Technology, 2016-2028 (US$ Bn)
10.6.2.5. Japan Image Recognition Systems, By End-Use, 2016-2028 (US$ Bn)
10.6.2.6. Japan Image Recognition Systems, By Application, 2016-2028 (US$ Bn)
10.6.3. India
10.6.3.1. India Image Recognition Systems Market Estimates and Forecast, 2016-2028 (US$ Bn)
10.6.3.2. India Image Recognition Systems, By Processing Method, 2016-2028 (US$ Bn)
10.6.3.3. India Image Recognition Systems, By Image Type, 2016-2028 (US$ Bn)
10.6.3.4. India Image Recognition Systems, By Image Processor Technology, 2016-2028 (US$ Bn)
10.6.3.5. India Image Recognition Systems, By End-Use, 2016-2028 (US$ Bn)
10.6.3.6. India Image Recognition Systems, By Application, 2016-2028 (US$ Bn)
10.6.4. South Korea
10.6.4.1. South Korea Image Recognition Systems Market Estimates and Forecast, 2016-2028 (US$ Bn)
10.6.4.2. South Korea Image Recognition Systems, By Processing Method, 2016-2028 (US$ Bn)
10.6.4.3. South Korea Image Recognition Systems, By Image Type, 2016-2028 (US$ Bn)
10.6.4.4. South Korea Image Recognition Systems, By Image Processor Technology, 2016-2028 (US$ Bn)
10.6.4.5. South Korea Image Recognition Systems, By End-Use, 2016-2028 (US$ Bn)
10.6.4.6. South Korea Image Recognition Systems, By Application, 2016-2028 (US$ Bn)
10.6.5. South-East Asia
10.6.5.1. South-East Asia Image Recognition Systems Market Estimates and Forecast, 2016-2028 (US$ Bn)
10.6.5.2. South-East Asia Image Recognition Systems, By Processing Method, 2016-2028 (US$ Bn)
10.6.5.3. South-East Asia Image Recognition Systems, By Image Type, 2016-2028 (US$ Bn)
10.6.5.4. South-East Asia Image Recognition Systems, By Image Processor Technology, 2016-2028 (US$ Bn)
10.6.5.5. South-East Asia Image Recognition Systems, By End-Use, 2016-2028 (US$ Bn)
10.6.5.6. South-East Asia Image Recognition Systems, By Application, 2016-2028 (US$ Bn)
10.6.6. Rest of Asia Pacific
10.6.6.1. Rest of Asia Pacific Image Recognition Systems Market Estimates and Forecast, 2016-2028 (US$ Bn)
10.6.6.2. Rest of Asia Pacific Image Recognition Systems, By Processing Method, 2016-2028 (US$ Bn)
10.6.6.3. Rest of Asia Pacific Image Recognition Systems, By Image Type, 2016-2028 (US$ Bn)
10.6.6.4. Rest of Asia Pacific Image Recognition Systems, By Image Processor Technology, 2016-2028 (US$ Bn)
10.6.6.5. Rest of Asia Pacific Image Recognition Systems, By End-Use, 2016-2028 (US$ Bn)
10.6.6.6. Rest of Asia Pacific Image Recognition Systems, By Application, 2016-2028 (US$ Bn)

11. Latin America Image Recognition Systems Market Analysis
11.1. Latin America Image Recognition Systems Market, by Processing Method, 2016-2028(US$ Bn)
11.1.1. Overview
11.1.2. SRC Analysis
11.2. Latin America Image Recognition Systems Market, by Image Type, 2016-2028(US$ Bn)
11.2.1. Overview
11.2.2. SRC Analysis
11.3. Latin America Image Recognition Systems Market, by Image Processor Technology, 2016-2028(US$ Bn)
11.3.1. Overview
11.3.2. SRC Analysis
11.4. Latin America Image Recognition Systems Market, By End-Use, 2016-2028(US$ Bn)
11.4.1. Overview
11.4.2. SRC Analysis
11.5. Latin America Image Recognition Systems Market, by Application, 2016-2028(US$ Bn)
11.5.1. Overview
11.5.2. SRC Analysis
11.6. Latin America Image Recognition Systems Market, by Country, 2016-2028 (US$ Bn)
11.6.1. Brazil
11.6.1.1. Brazil Image Recognition Systems Market Estimates and Forecast, 2016-2028 (US$ Bn)
11.6.1.2. Brazil Image Recognition Systems, By Processing Method, 2016-2028 (US$ Bn)
11.6.1.3. Brazil Image Recognition Systems, By Image Type, 2016-2028 (US$ Bn)
11.6.1.4. Brazil Image Recognition Systems, By Image Processor Technology, 2016-2028 (US$ Bn)
11.6.1.5. Brazil Image Recognition Systems, By End-Use, 2016-2028 (US$ Bn)
11.6.1.6. Brazil Image Recognition Systems, By Application, 2016-2028 (US$ Bn)
11.6.2. Mexico
11.6.2.1. Mexico Image Recognition Systems Market Estimates and Forecast, 2016-2028 (US$ Bn)
11.6.2.2. Mexico Image Recognition Systems, By Processing Method, 2016-2028 (US$ Bn)
11.6.2.3. Mexico Image Recognition Systems, By Image Type, 2016-2028 (US$ Bn)
11.6.2.4. Mexico Image Recognition Systems, By Image Processor Technology, 2016-2028 (US$ Bn)
11.6.2.5. Mexico Image Recognition Systems, By End-Use, 2016-2028 (US$ Bn)
11.6.2.6. Mexico Image Recognition Systems, By Application, 2016-2028 (US$ Bn)
11.6.3. Rest of Latin America
11.6.3.1. Rest of Latin America Image Recognition Systems Market Estimates and Forecast, 2016-2028 (US$ Bn)
11.6.3.2. Rest of Latin America Image Recognition Systems, By Processing Method, 2016-2028 (US$ Bn)
11.6.3.3. Rest of Latin America Image Recognition Systems, By Image Type, 2016-2028 (US$ Bn)
11.6.3.4. Rest of Latin America Image Recognition Systems, By Image Processor Technology, 2016-2028 (US$ Bn)
11.6.3.5. Rest of Latin America Image Recognition Systems, By End-Use, 2016-2028 (US$ Bn)
11.6.3.6. Rest of Latin America Image Recognition Systems, By Application, 2016-2028 (US$ Bn)

12. Middle East and Africa Image Recognition Systems Market Analysis
12.1. Middle East and Africa Image Recognition Systems Market, by Processing Method, 2016-2028(US$ Bn)
12.1.1. Overview
12.1.2. SRC Analysis
12.2. Middle East and Africa Image Recognition Systems Market, by Image Type, 2016-2028(US$ Bn)
12.2.1. Overview
12.2.2. SRC Analysis
12.3. Middle East and Africa Image Recognition Systems Market, by Image Processor Technology, 2016-2028(US$ Bn)
12.3.1. Overview
12.3.2. SRC Analysis
12.4. Middle East and Africa Image Recognition Systems Market, By End-Use, 2016-2028(US$ Bn)
12.4.1. Overview
12.4.2. SRC Analysis
12.5. Middle East and Africa Image Recognition Systems Market, by Application, 2016-2028(US$ Bn)
12.5.1. Overview
12.5.2. SRC Analysis
12.6. Middle East and Africa Image Recognition Systems Market, by Country, 2016-2028 (US$ Bn)
12.6.1. GCC Countries
12.6.1.1. GCC Countries Image Recognition Systems Market Estimates and Forecast, 2016-2028 (US$ Bn)
12.6.1.2. GCC Countries Image Recognition Systems, By Processing Method, 2016-2028 (US$ Bn)
12.6.1.3. GCC Countries Image Recognition Systems, By Image Type, 2016-2028 (US$ Bn)
12.6.1.4. GCC Countries Image Recognition Systems, By Image Processor Technology, 2016-2028 (US$ Bn)
12.6.1.5. GCC Countries Image Recognition Systems, By End-Use, 2016-2028 (US$ Bn)
12.6.1.6. GCC Countries Image Recognition Systems, By Application, 2016-2028 (US$ Bn)
12.6.2. South Africa
12.6.2.1. South Africa Image Recognition Systems Market Estimates and Forecast, 2016-2028 (US$ Bn)
12.6.2.2. South Africa Image Recognition Systems, By Processing Method, 2016-2028 (US$ Bn)
12.6.2.3. South Africa Image Recognition Systems, By Image Type, 2016-2028 (US$ Bn)
12.6.2.4. sz(US$ Bn)
12.6.2.5. South Africa Image Recognition Systems, By End-Use, 2016-2028 (US$ Bn)
12.6.2.6. South Africa Image Recognition Systems, By Application, 2016-2028 (US$ Bn)
12.6.3. Rest of Middle East and Africa
12.6.3.1. Rest of Middle East and Africa Image Recognition Systems Market Estimates and Forecast, 2016-2028 (US$ Bn)
12.6.3.2. Rest of Middle East and Africa Image Recognition Systems, By Processing Method, 2016-2028 (US$ Bn)
12.6.3.3. Rest of Middle East and Africa Image Recognition Systems, By Image Type, 2016-2028 (US$ Bn)
12.6.3.4. Rest of Middle East and Africa Image Recognition Systems, By Image Processor Technology, 2016-2028 (US$ Bn)
12.6.3.5. Rest of Middle East and Africa Image Recognition Systems, By End-Use, 2016-2028 (US$ Bn)
12.6.3.6. Rest of Middle East and Africa Image Recognition Systems, By Application, 2016-2028 (US$ Bn)

13. Company Profiles
13.1. IBM
13.1.1. Company Overview
13.1.2. Products/Image Processor Technologys Portfolio
13.1.3. Geographical Presence
13.1.4. Financial Summary
13.1.4.1. Market Revenue and Net Profit (2019-2021)
13.1.4.2. Business Segment Revenue Analysis
13.1.4.3. Geographical Revenue Analysis
13.2. Google
13.3. Qualcomm Technologies Inc.
13.4. Microsoft
13.5. Amazon Web Image Processor Technologys Inc.
13.6. Trax Image Recognition
13.7. NEC Corporation
13.8. Partium.io
13.9. LTU Tech
13.10. Huawei Technologies Co. Ltd.

List of Figures
FIG. 1 Global Image Recognition Systems Market: Research Methodology
FIG. 2 Market Size Estimation – Top Down & Bottom up Approach
FIG. 3 Global Image Recognition Systems Market Segmentation
FIG. 4 Global Image Recognition Systems Market, by Processing Method, 2021 (US$ Bn)
FIG. 5 Global Image Recognition Systems Market, by Image Type, 2021 (US$ Bn)
FIG. 6 Global Image Recognition Systems Market, by Image Processor Technology Type, 2021 (US$ Bn)
FIG. 7 Global Image Recognition Systems Market, By End-Use, 2021 (US$ Bn)
FIG. 8 Global Image Recognition Systems Market, by Application, 2021 (US$ Bn)
FIG. 9 Global Image Recognition Systems Market, by Geography, 2021 (US$ Bn)
FIG. 10 Attractive Investment Proposition, by Processing Method, 2021
FIG. 11 Attractive Investment Proposition, by Image Type, 2021
FIG. 12 Attractive Investment Proposition, by Image Processor Technology Type, 2021
FIG. 13 Attractive Investment Proposition, By End-Use, 2021
FIG. 14 Attractive Investment Proposition, by Application, 2021
FIG. 15 Attractive Investment Proposition, by Geography, 2021
FIG. 16 Global Market Share Analysis of Key Image Recognition Systems Market Manufacturers, 2021
FIG. 17 Global Market Positioning of Key Image Recognition Systems Market Manufacturers, 2021
FIG. 18 Global Image Recognition Systems Market Value Contribution, By Processing Method, 2021 & 2028 (Value %)
FIG. 19 Global Image Recognition Systems Market, by Processing Method, Value, 2016-2028 (US$ Bn)
FIG. 20 Global Image Recognition Systems Market, by Analog, Value, 2016-2028 (US$ Bn)
FIG. 21 Global Image Recognition Systems Market, Digital, Value, 2016-2028 (US$ Bn)
FIG. 22 Global Image Recognition Systems Market Value Contribution, By Image Type, 2021 & 2028 (Value %)
FIG. 23 Global Image Recognition Systems Market, by One Dimensional, Value, 2016-2028 (US$ Bn)
FIG. 24 Global Image Recognition Systems Market, by Two Dimensional, Value, 2016-2028 (US$ Bn)
FIG. 25 Global Image Recognition Systems Market, by Three Dimensional, Value, 2016-2028 (US$ Bn)
FIG. 26 Global Image Recognition Systems Market Value Contribution, By Image Processor Technology, 2021 & 2028 (Value %)
FIG. 27 Global Image Recognition Systems Market, by Multiple Instruction Multiple Data (Mmid), Value, 2016-2028 (US$ Bn)
FIG. 28 Global Image Recognition Systems Market, by Single Instruction Multiple Data (Smid), Value, 2016-2028 (US$ Bn)
FIG. 29 Global Image Recognition Systems Market Value Contribution, By End-Use, 2021 & 2028 (Value %)
FIG. 30 Global Image Recognition Systems Market, by Camera Device, Value, 2016-2028 (US$ Bn)
FIG. 31 Global Image Recognition Systems Market, by Ar/Vr Devices, Value, 2016-2028 (US$ Bn)
FIG. 32 Global Image Recognition Systems Market, by Mobile Phones, Value, 2016-2028 (US$ Bn)
FIG. 33 Global Image Recognition Systems Market, by Smart Phones, Value, 2016-2028 (US$ Bn)
FIG. 34 Global Image Recognition Systems Market, by Tablets, Value, 2016-2028 (US$ Bn)
FIG. 35 Global Image Recognition Systems Market Value Contribution, By Application, 2021 & 2028 (Value %)
FIG. 36 Global Image Recognition Systems Market, by Medical, Value, 2016-2028 (US$ Bn)
FIG. 37 Global Image Recognition Systems Market, by Industrial, Value, 2016-2028 (US$ Bn)
FIG. 38 Global Image Recognition Systems Market, by Military, Value, 2016-2028 (US$ Bn)
FIG. 39 U.S. Image Recognition Systems Market, 2016-2028 (US$ Bn)
FIG. 40 Canada Image Recognition Systems Market, 2016-2028 (US$ Bn)
FIG. 41 Germany Image Recognition Systems Market, 2016-2028 (US$ Bn)
FIG. 42 France Image Recognition Systems Market, 2016-2028 (US$ Bn)
FIG. 43 U.K. Image Recognition Systems Market, 2016-2028 (US$ Bn)
FIG. 44 Italy Image Recognition Systems Market, 2016-2028 (US$ Bn)
FIG. 45 Spain Image Recognition Systems Market, 2016-2028 (US$ Bn)
FIG. 46 Rest of Europe Image Recognition Systems Market, 2016-2028 (US$ Bn)
FIG. 47 China Image Recognition Systems Market, 2016-2028 (US$ Bn)
FIG. 48 Japan Image Recognition Systems Market, 2016-2028 (US$ Bn)
FIG. 49 India Image Recognition Systems Market, 2016-2028 (US$ Bn)
FIG. 50 South Korea Image Recognition Systems Market, 2016-2028 (US$ Bn)
FIG. 51 Southeast Asia Image Recognition Systems Market, 2016-2028 (US$ Bn)
FIG. 52 Rest of Asia Pacific Image Recognition Systems Market, 2016-2028 (US$ Bn)
FIG. 53 Latin America Image Recognition Systems Market, 2016-2028 (US$ Bn)
FIG. 54 Brazil Image Recognition Systems Market, 2016-2028 (US$ Bn)
FIG. 55 Mexico Image Recognition Systems Market, 2016-2028 (US$ Bn)
FIG. 56 Rest of Latin America Image Recognition Systems Market, 2016-2028 (US$ Bn)
FIG. 57 Middle East & Africa Image Recognition Systems Market, 2016-2028 (US$ Bn)
FIG. 58 GCC Countries Image Recognition Systems Market, 2016-2028 (US$ Bn)
FIG. 59 South Africa Image Recognition Systems Market, 2016-2028 (US$ Bn)
FIG. 60 Rest of Middle East and Africa Image Recognition Systems Market, 2016-2028 (US$ Bn)

List of Tables
TABLE 1 Market Snapshot: Global Image Recognition Systems Market
TABLE 2 Global Image Recognition Systems Market, by Competitive Benchmarking, 2021
TABLE 3 Global Image Recognition Systems Market, by Geographical Presence Analysis, 2021
TABLE 4 Global Image Recognition Systems Market, by Key Strategies Analysis, 2021
TABLE 5 Global Image Recognition Systems Market, by Processing Method, 2016-2028 (US$ Bn)
TABLE 6 Global Image Recognition Systems Market, by Image Type, 2016-2028 (US$ Bn)
TABLE 7 Global Image Recognition Systems Market, by Image Processor Technology, 2016-2028 (US$ Bn)
TABLE 8 Global Image Recognition Systems Market, By End-Use, 2016-2028 (US$ Bn)
TABLE 9 Global Image Recognition Systems Market, by Application, 2016-2028 (US$ Bn)
TABLE 10 Global Image Recognition Systems Market, by Geography, 2016-2028 (US$ Bn)
TABLE 11 North America Image Recognition Systems Market, by Processing Method, 2016-2028 (US$ Bn)
TABLE 12 North America Image Recognition Systems Market, by Image Type, 2016-2028 (US$ Bn)
TABLE 13 North America Image Recognition Systems Market, by Image Processor Technology, 2016-2028 (US$ Bn)
TABLE 14 North America Image Recognition Systems Market, By End-Use, 2016-2028 (US$ Bn)
TABLE 15 North America Image Recognition Systems Market, by Application, 2016-2028 (US$ Bn)
TABLE 16 North America Image Recognition Systems Market, by Country, 2016-2028 (US$ Bn)
TABLE 17 US Image Recognition Systems Market, by Processing Method, 2016-2028 (US$ Bn)
TABLE 18 US Image Recognition Systems Market, by Image Type, 2016-2028 (US$ Bn)
TABLE 19 US Image Recognition Systems Market, by Image Processor Technology, 2016-2028 (US$ Bn)
TABLE 20 US Image Recognition Systems Market, By End-Use, 2016-2028 (US$ Bn)
TABLE 21 US Image Recognition Systems Market, by Application, 2016-2028 (US$ Bn)
TABLE 22 Canada Image Recognition Systems Market, by Processing Method, 2016-2028 (US$ Bn)
TABLE 23 Canada Image Recognition Systems Market, by Image Type, 2016-2028 (US$ Bn)
TABLE 24 Canada Image Recognition Systems Market, by Image Processor Technology, 2016-2028 (US$ Bn)
TABLE 25 Canada Image Recognition Systems Market, By End-Use, 2016-2028 (US$ Bn)
TABLE 26 Canada Image Recognition Systems Market, by Application, 2016-2028 (US$ Bn)
TABLE 27 Europe Image Recognition Systems Market, by Processing Method, 2016-2028 (US$ Bn)
TABLE 28 Europe Image Recognition Systems Market, by Image Type, 2016-2028 (US$ Bn)
TABLE 29 Europe Image Recognition Systems Market, by Image Processor Technology, 2016-2028 (US$ Bn)
TABLE 30 Europe Image Recognition Systems Market, By End-Use, 2016-2028 (US$ Bn)
TABLE 31 Europe Image Recognition Systems Market, by Application, 2016-2028 (US$ Bn)
TABLE 32 Europe Image Recognition Systems Market, by Country, 2016-2028 (US$ Bn)
TABLE 33 Germany Image Recognition Systems Market, by Processing Method, 2016-2028 (US$ Bn)
TABLE 34 Germany Image Recognition Systems Market, by Image Type, 2016-2028 (US$ Bn)
TABLE 35 Germany Image Recognition Systems Market, by Image Processor Technology, 2016-2028 (US$ Bn)
TABLE 36 Germany Image Recognition Systems Market, By End-Use, 2016-2028 (US$ Bn)
TABLE 37 Germany Image Recognition Systems Market, by Application, 2016-2028 (US$ Bn)
TABLE 38 France Image Recognition Systems Market, by Processing Method, 2016-2028 (US$ Bn)
TABLE 39 France Image Recognition Systems Market, by Image Type, 2016-2028 (US$ Bn)
TABLE 40 France Image Recognition Systems Market, by Image Processor Technology, 2016-2028 (US$ Bn)
TABLE 41 France Image Recognition Systems Market, By End-Use, 2016-2028 (US$ Bn)
TABLE 42 France Image Recognition Systems Market, by Application, 2016-2028 (US$ Bn)
TABLE 43 UK Image Recognition Systems Market, by Processing Method, 2016-2028 (US$ Bn)
TABLE 44 UK Image Recognition Systems Market, by Image Type, 2016-2028 (US$ Bn)
TABLE 45 UK Image Recognition Systems Market, by Image Processor Technology, 2016-2028 (US$ Bn)
TABLE 46 UK Image Recognition Systems Market, By End-Use, 2016-2028 (US$ Bn)
TABLE 47 UK Image Recognition Systems Market, by Application, 2016-2028 (US$ Bn)
TABLE 48 Italy Image Recognition Systems Market, by Processing Method, 2016-2028 (US$ Bn)
TABLE 49 Italy Image Recognition Systems Market, by Image Type, 2016-2028 (US$ Bn)
TABLE 50 Italy Image Recognition Systems Market, by Image Processor Technology, 2016-2028 (US$ Bn)
TABLE 51 Italy Image Recognition Systems Market, By End-Use, 2016-2028 (US$ Bn)
TABLE 52 Italy Image Recognition Systems Market, by Application, 2016-2028 (US$ Bn)
TABLE 53 Spain Image Recognition Systems Market, by Processing Method, 2016-2028 (US$ Bn)
TABLE 54 Spain Image Recognition Systems Market, by Image Type, 2016-2028 (US$ Bn)
TABLE 55 Spain Image Recognition Systems Market, by Image Processor Technology, 2016-2028 (US$ Bn)
TABLE 56 Spain Image Recognition Systems Market, By End-Use, 2016-2028 (US$ Bn)
TABLE 57 Spain Image Recognition Systems Market, by Application, 2016-2028 (US$ Bn)
TABLE 58 Rest of Europe Image Recognition Systems Market, by Processing Method, 2016-2028 (US$ Bn)
TABLE 59 Rest of Europe Image Recognition Systems Market, by Image Type, 2016-2028 (US$ Bn)
TABLE 60 Rest of Europe Image Recognition Systems Market, by Image Processor Technology, 2016-2028 (US$ Bn)
TABLE 61 Rest of Europe Image Recognition Systems Market, By End-Use, 2016-2028 (US$ Bn)
TABLE 62 Rest of Europe Image Recognition Systems Market, by Application, 2016-2028 (US$ Bn)
TABLE 63 Asia Pacific Image Recognition Systems Market, by Processing Method, 2016-2028 (US$ Bn)
TABLE 64 Asia Pacific Image Recognition Systems Market, by Image Type, 2016-2028 (US$ Bn)
TABLE 65 Asia Pacific Image Recognition Systems Market, by Image Processor Technology, 2016-2028 (US$ Bn)
TABLE 66 Asia Pacific Image Recognition Systems Market, By End-Use, 2016-2028 (US$ Bn)
TABLE 67 Asia Pacific Image Recognition Systems Market, by Application, 2016-2028 (US$ Bn)
TABLE 68 Asia Pacific Image Recognition Systems Market, by Country, 2016-2028 (US$ Bn)
TABLE 69 China Image Recognition Systems Market, by Processing Method, 2016-2028 (US$ Bn)
TABLE 70 China Image Recognition Systems Market, by Image Type, 2016-2028 (US$ Bn)
TABLE 71 China Image Recognition Systems Market, by Image Processor Technology, 2016-2028 (US$ Bn)
TABLE 72 China Image Recognition Systems Market, By End-Use, 2016-2028 (US$ Bn)
TABLE 73 China Image Recognition Systems Market, by Application, 2016-2028 (US$ Bn)
TABLE 74 Japan Image Recognition Systems Market, by Processing Method, 2016-2028 (US$ Bn)
TABLE 75 Japan Image Recognition Systems Market, by Image Type, 2016-2028 (US$ Bn)
TABLE 76 Japan Image Recognition Systems Market, by Image Processor Technology, 2016-2028 (US$ Bn)
TABLE 77 Japan Image Recognition Systems Market, By End-Use, 2016-2028 (US$ Bn)
TABLE 78 Japan Image Recognition Systems Market, by Application, 2016-2028 (US$ Bn)
TABLE 79 India Image Recognition Systems Market, by Processing Method, 2016-2028 (US$ Bn)
TABLE 80 India Image Recognition Systems Market, by Image Type, 2016-2028 (US$ Bn)
TABLE 81 India Image Recognition Systems Market, by Image Processor Technology, 2016-2028 (US$ Bn)
TABLE 82 India Image Recognition Systems Market, By End-Use, 2016-2028 (US$ Bn)
TABLE 83 India Image Recognition Systems Market, by Application, 2016-2028 (US$ Bn)
TABLE 84 South Korea Image Recognition Systems Market, by Processing Method, 2016-2028 (US$ Bn)
TABLE 85 South Korea Image Recognition Systems Market, by Image Type, 2016-2028 (US$ Bn)
TABLE 86 South Korea Image Recognition Systems Market, by Image Processor Technology, 2016-2028 (US$ Bn)
TABLE 87 South Korea Image Recognition Systems Market, By End-Use, 2016-2028 (US$ Bn)
TABLE 88 South Korea Image Recognition Systems Market, by Application, 2016-2028 (US$ Bn)
TABLE 89 South East Asia Image Recognition Systems Market, by Processing Method, 2016-2028 (US$ Bn)
TABLE 90 South East Asia Image Recognition Systems Market, by Image Type, 2016-2028 (US$ Bn)
TABLE 91 South East Asia Image Recognition Systems Market, by Image Processor Technology, 2016-2028 (US$ Bn)
TABLE 92 South East Asia Image Recognition Systems Market, By End-Use, 2016-2028 (US$ Bn)
TABLE 93 South East Asia Image Recognition Systems Market, by Application, 2016-2028 (US$ Bn)
TABLE 94 Rest of Asia Pacific Image Recognition Systems Market, by Processing Method, 2016-2028 (US$ Bn)
TABLE 95 Rest of Asia Pacific Image Recognition Systems Market, by Image Type, 2016-2028 (US$ Bn)
TABLE 96 Rest of Asia Pacific Image Recognition Systems Market, by Image Processor Technology, 2016-2028 (US$ Bn)
TABLE 97 Rest of Asia Pacific Image Recognition Systems Market, By End-Use, 2016-2028 (US$ Bn)
TABLE 98 Rest of Asia Pacific Image Recognition Systems Market, by Application, 2016-2028 (US$ Bn)
TABLE 99 Latin America Image Recognition Systems Market, by Processing Method, 2016-2028 (US$ Bn)
TABLE 100 Latin America Image Recognition Systems Market, by Image Type, 2016-2028 (US$ Bn)
TABLE 101 Latin America Image Recognition Systems Market, by Image Processor Technology, 2016-2028 (US$ Bn)
TABLE 102 Latin America Image Recognition Systems Market, By End-Use, 2016-2028 (US$ Bn)
TABLE 103 Latin America Image Recognition Systems Market, by Application, 2016-2028 (US$ Bn)
TABLE 104 Latin America Image Recognition Systems Market, by Country, 2016-2028 (US$ Bn)
TABLE 105 Brazil Image Recognition Systems Market, by Processing Method, 2016-2028 (US$ Bn)
TABLE 106 Brazil Image Recognition Systems Market, by Image Type, 2016-2028 (US$ Bn)
TABLE 107 Brazil Image Recognition Systems Market, by Image Processor Technology, 2016-2028 (US$ Bn)
TABLE 108 Brazil Image Recognition Systems Market, By End-Use, 2016-2028 (US$ Bn)
TABLE 109 Brazil Image Recognition Systems Market, by Application, 2016-2028 (US$ Bn)
TABLE 110 Mexico Image Recognition Systems Market, by Processing Method, 2016-2028 (US$ Bn)
TABLE 111 Mexico Image Recognition Systems Market, by Image Type, 2016-2028 (US$ Bn)
TABLE 112 Mexico Image Recognition Systems Market, by Image Processor Technology, 2016-2028 (US$ Bn)
TABLE 113 Mexico Image Recognition Systems Market, By End-Use, 2016-2028 (US$ Bn)
TABLE 114 Mexico Image Recognition Systems Market, by Application, 2016-2028 (US$ Bn)
TABLE 115 Rest of Latin America Image Recognition Systems Market, by Processing Method, 2016-2028 (US$ Bn)
TABLE 116 Rest of Latin America Image Recognition Systems Market, by Image Type, 2016-2028 (US$ Bn)
TABLE 117 Rest of Latin America Image Recognition Systems Market, by Image Processor Technology, 2016-2028 (US$ Bn)
TABLE 118 Rest of Latin America Image Recognition Systems Market, By End-Use, 2016-2028 (US$ Bn)
TABLE 119 Rest of Latin America Image Recognition Systems Market, by Application, 2016-2028 (US$ Bn)
TABLE 120 Middle East and Africa Image Recognition Systems Market, by Processing Method, 2016-2028 (US$ Bn)
TABLE 121 Middle East and Africa Image Recognition Systems Market, by Image Type, 2016-2028 (US$ Bn)
TABLE 122 Middle East and Africa Image Recognition Systems Market, by Image Processor Technology, 2016-2028 (US$ Bn)
TABLE 123 Middle East and Africa Image Recognition Systems Market, By End-Use, 2016-2028 (US$ Bn)
TABLE 124 Middle East and Africa Image Recognition Systems Market, by Application, 2016-2028 (US$ Bn)
TABLE 125 Middle East and Africa Image Recognition Systems Market, by Country, 2016-2028 (US$ Bn)
TABLE 126 GCC Countries Image Recognition Systems Market, by Processing Method, 2016-2028 (US$ Bn)
TABLE 127 GCC Countries Image Recognition Systems Market, by Image Type, 2016-2028 (US$ Bn)
TABLE 128 GCC Countries Image Recognition Systems Market, by Image Processor Technology, 2016-2028 (US$ Bn)
TABLE 129 GCC Countries Image Recognition Systems Market, By End-Use, 2016-2028 (US$ Bn)
TABLE 130 GCC Countries Image Recognition Systems Market, by Application, 2016-2028 (US$ Bn)
TABLE 131 South Africa Image Recognition Systems Market, by Processing Method, 2016-2028 (US$ Bn)
TABLE 132 South Africa Image Recognition Systems Market, by Image Type, 2016-2028 (US$ Bn)
TABLE 133 South Africa Image Recognition Systems Market, by Image Processor Technology, 2016-2028 (US$ Bn)
TABLE 134 South Africa Image Recognition Systems Market, By End-Use, 2016-2028 (US$ Bn)
TABLE 135 South Africa Image Recognition Systems Market, by Application, 2016-2028 (US$ Bn)
TABLE 136 Rest of Middle East and Africa Image Recognition Systems Market, by Processing Method, 2016-2028 (US$ Bn)
TABLE 137 Rest of Middle East and Africa Image Recognition Systems Market, by Image Type, 2016-2028 (US$ Bn)
TABLE 138 Rest of Middle East and Africa Image Recognition Systems Market, by Image Processor Technology, 2016-2028 (US$ Bn)
TABLE 139 Rest of Middle East and Africa Image Recognition Systems Market, By End-Use, 2016-2028 (US$ Bn)
TABLE 140 Rest of Middle East and Africa Image Recognition Systems Market, by Application, 2016-2028 (US$ Bn)

Frequently Asked Questions

How does COVID-19 impact the global Image recognition systems Market?

COVID-19 had a significant impact on the market during the first wave, with countries across the globe implementing lockdowns and restricting the movement of goods and people.

Which is the leading region of the image recognition systems market?

The increased adoption of advanced technologies, the development of the retail & e-commerce sector, and the presence of leading market players drive north America’s market revenue growth.

What are the drivers for the growth of the image recognition systems market?

Key factors are expected to fuel the image recognition systems market growth in the forecast period because of the increasing need for image recognition systems in several applications.

Which is the major segment in the image recognition systems market by processing method?

The digital segment had a significant global market share in 2021.

Which is the major segment in the image recognition systems market by image type?

The three-dimensional segment had a significant share in the global market.

LiDAR Market

Published:
Report ID: 12346

Digital Intraoral Sensor and Consumable Market

Published:
Report ID: 35017

Digital Photo Frame Market

Published:
Report ID: 34914

Gift Cards Market

Published:
Report ID: 6518

Cooling Towers Market

Published:
Report ID: 4381

Virtual Reality (VR) Market

Published:
Report ID: 11345

Identity And Access Management (IAM) Market

Published:
Report ID: 6005

Smart Grid Managed Services Market

Published:
Report ID: 10208

Picture Archiving and Communication Systems (PACS) Market

Published:
Report ID: 9676

Chatbots Market

Published:
Report ID: 3733

Over-the-Top (OTT) Market

Published:
Report ID: 8377

Enterprise Video Market

Published:
Report ID: 5414

Purchase Options

$2999
Delivery Format: Excel.
$4999
Designed for the individual purchaser.
$6999
Users located at a single corporate site or regional office.
$7999
Allowed for unlimited sharing globally within one company.
Smallform of Sample request

Have a question?

User Profile

Don’t settle for less – trust Mitul to help you find the best solution.

Report delivery within 24 to 48 hours

– Other Info –

What people say?-

User Review

I am very impressed with the information in this report. The author clearly did their research when they came up with this product and it has already given me a lot of ideas.

Jana Schmidt
CEDAR CX Technologies

– Connect with us –

Phone

+91 6232 49 3207


support

24/7 Research Support


sales@credenceresearch.com

– Research Methodology –

Going beyond the basics: advanced techniques in research methodology

– Trusted By –

Pepshi, LG, Nestle
Motorola, Honeywell, Johnson and johnson
LG Chem, SIEMENS, Pfizer
Unilever, Samsonite, QIAGEN