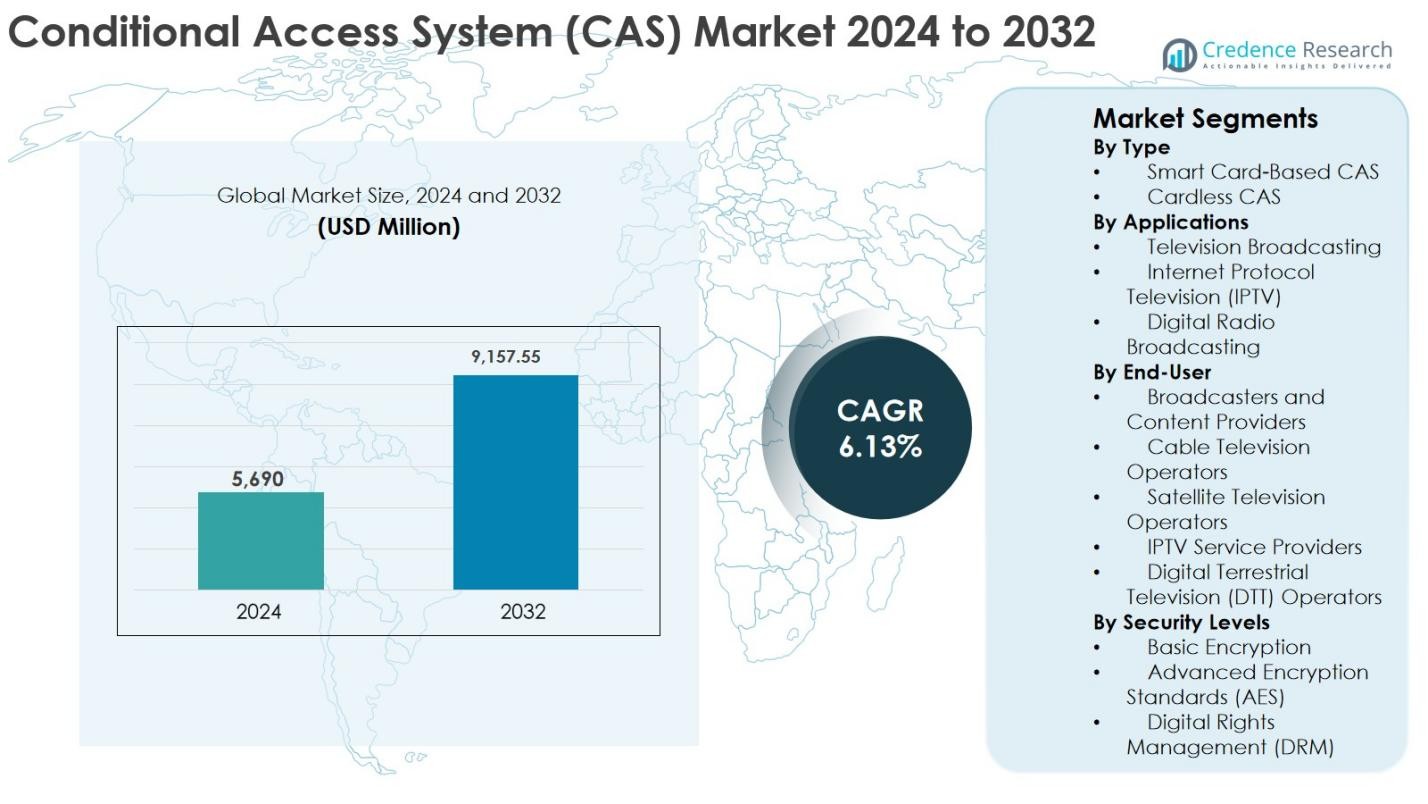
Home » Information and Communications Technology » Technology & Media » Conditional Access System (CAS) Market

Conditional Access System (CAS) Market By Type (Smart Card-Based CAS, Cardless CAS); By Application (Television Broadcasting, Internet Protocol Television (IPTV), Digital Radio Broadcasting); By End-User (Broadcasters and Content Providers, Cable Television Operators, Satellite Television Operators, IPTV Service Providers, Digital Terrestrial Television (DTT) Operators); By Security Level (Basic Encryption, Advanced Encryption Standards (AES), Digital Rights Management (DRM)); By Delivery Model (Hardware-Based CAS, Software-Based CAS); By Integration Level (Integrated CAS, Middleware Integration); By Emerging Technology (Cloud-Based CAS, Advanced Analytics and Reporting); By Region – Growth, Share, Opportunities & Competitive Analysis, 2024 – 2032

Price: $4999

Published: | Report ID: 4145 | Report Format : PDF
REPORT ATTRIBUTE DETAILS
Historical Period  2019-2022
Base Year  2023
Forecast Period  2024-2032
Conditional Access System (CAS) Market Size 2023  USD 4,845.80 Million
Conditional Access System (CAS) Market, CAGR  12.50%
Conditional Access System (CAS) Market Size 2032  USD 13,987.43 Million

Market Insights

  • The global demand for Conditional Access Systems was valued at USD 4,845.80 Million in 2023 and is expected to reach USD 13,987.43 Million in 2032, growing at a CAGR of 12.50% between 2024 and 2032.
  • The Smart Card-Based CAS sector is the market leader by interface type, accounting for more than 55% of total value in 2023, while the Cardless CAS segment is expected to grow rapidly throughout the forecast period.
  • The Internet Protocol Television (IPTV) dominates the global need for Conditional Access Systems, accounting for more than 50% in 2023 and Digital Radio Broadcasting is predicted to expand at a high CAGR.
  • The Satellite Television Operators sector is predicted to grow fastest over the projection period, while the Broadcasters and Content Providers segment will have a market share of more than 25% in 2023.
  • The Advanced Encryption Standards (AES) category is expected to expand quickly over the forecast period, while the Basic Encryption segment will have the greatest market share in 2023.
  • The Hardware-Based CAS category dominated the market with 55% of the total revenue share by delivery models segment. In contrast, the Software-Based CAS category will expand fastest throughout the projected period.
  • With a significant market share of over 45% in 2023 and projections of high CAGR growth, the Integrated CAS category will likely continue to dominate the need for Conditional Access Systems globally.
  • North America is fueling the growth of the Conditional Access Systems industry with over one-third share in 2023, while Asia Pacific and Europe collectively account for just under 55% share in 2023. Europe held over 20% share in 2023.
  • Due to the growing demand for digital content services, including streaming platforms, video-on-demand, and pay-TV services, contributing to the need for secure access systems.
  • The market’s primary possibilities include the significant growth potential in North America, increased adoption of smart devices such as smart TVs, smartphones, and tablets fuels the growth of CAS.

Conditional Access Systems Market

Design Element 2

Access crucial information at unmatched prices!

Request your free sample report today & start making informed decisions powered by Credence Research!

Download Free Sample
CTA Design Element 3

Executive Summary

Market Definition

Conditional Access Systems (CAS) are security technologies designed to control and manage access to digital content, ensuring that only authorized users can access specific services or channels. These systems play a crucial role in protecting digital content, such as television programs, movies, and streaming services, from unauthorized viewing or distribution. CAS uses encryption and authentication methods to safeguard content and prevent piracy or unauthorized access. It is commonly employed in pay-TV services, video-on-demand platforms, and other digital media environments, providing a secure framework for content providers to deliver and monetize their offerings while maintaining control over who can access the content.

Market Overview 

The global Conditional Access Systems market has witnessed steady growth in recent years and is expected to grow at a CAGR of 12.50% between 2024 and 2032. The market was valued at USD 4,845.80 million in 2023 and is expected to reach USD 13,987.43 million in 2032.

The key driver boosting the growth rate of the Conditional Access Systems market due to the increasing popularity of digital content services. People now love watching videos on streaming platforms, using video-on-demand services, and subscribing to pay-TV offerings. This growing interest in digital content has created a need for secure access systems like CAS to make sure that only authorized users can enjoy these services without any worries.

Furthermore, this rise in the use of smart devices such as smart TVs, smartphones, and tablets is also playing a big role in the growth of CAS. Smart devices are everywhere, and they often need strong security measures to keep the content safe from unauthorized access. Additionally, the demand for clearer and more immersive content experiences, including High-Definition (HD) and Ultra High-Definition (UHD) content, is contributing to the need for advanced CAS. As people want better quality pictures and more engaging videos, CAS ensures that the delivery and access to such high-quality multimedia content remain secure. All of these factors are shaping the global CAS market and making it an essential part of our digital content experiences.

Segmentation by Type of Conditional Access Systems

  • Smart Card-Based CAS is the leading segment by interface type and held over 55% share in value in 2023, attributable to the rapid urbanization and increasing digitization fosters the adoption of CAS, particularly in urban areas.
  • The Cardless CAS segment will likely exhibit a significant CAGR during the forecast period. The integration of CAS in smart city initiatives and the broader Internet of Things (IoT) ecosystems promotes secure access to digital content within interconnected urban environments.

Segmentation by Applications

  • The Internet Protocol Television (IPTV) segment governs the demand for Conditional Access Systems in the world, holding a massive share of over 50% in 2023, and Digital Radio Broadcasting is also expected to grow at a rapid CAGR because Collaborative efforts and partnerships within the media industry, including content creators, broadcasters, and service providers, drive the adoption of CAS to establish secure and mutually beneficial content distribution networks.
  • The television broadcasting segment contributes to the demand for Conditional Access Systems.

Segmentation by End-User

  • The Satellite Television Operators segment is expected to post the highest CAGR during the forecast period. This is primarily due to the rising global demand for premium and exclusive content, including original productions and live events
  • The Broadcasters and Content Providers segment is leading the market share with over 25% share in 2023.

Segmentation by Security Levels

  • The Advanced Encryption Standards (AES) segment is anticipated to register the highest CAGR during the projection period.
  • With a market share of nearly 40% in 2023, the Basic Encryption category is currently in the lead.

Segmentation by Delivery Models

  • The Hardware-Based CAS dominate the global need for Conditional Access Systems, accounting for more than 50% in 2023 and Software-Based CAS are predicted to expand at a high CAGR.
  • The adoption of smart devices such as smart TVs, smartphones, and tablets fuels the growth of CAS, as these devices often require secure access mechanisms to protect content from unauthorized use.

Segmentation by Integration Levels

  • In terms of value, the Integrated CAS category is the leading integration levels, with a 55% share in 2023. The implementation of stringent regulations and content protection standards by governments and industry bodies drives the adoption of advanced CAS.
  • During the forecast period, the Middleware Integration segment is expected to grow at the fastest rate.

Segmentation by Emerging Technologies

  • The Cloud-Based CAS category, expected to grow at a high CAGR and account for more than 50% of the global demand for Conditional Access Systems in 2023, currently dominates this market. The development of advanced video compression technologies necessitates updated CAS solutions to secure efficient content delivery and transmission over various networks.
  • The Advanced Analytics and Reporting segment accounts for the remaining need for Conditional Access Systems.

Segmentation by Region

  • North America is fueling the growth of the Conditional Access Systems industry with over one-third share in 2023 due to the region’s expanding consumer electronics industries and increased disposable income.
  • Asia Pacific and Europe collectively account for just under 55% share in 2023, with Europe holding over 20% share in the same year.
  • The rest of the world, including Latin America, the Middle East, and Africa, supplies the remaining demand for Conditional Access Systems.

Conditional Access Systems Market Research

The market for Conditional Access Systems is driven by rising smartphone usage and greater adoption of Conditional Access Systems connectivity due to Bluetooth and Wi-Fi’s restricted data streaming and transferring capacities.

In North America, the Conditional Access Systems (CAS) market is robust and growing steadily. According to government statistics, the region has witnessed a substantial increase in digital content consumption, with a notable rise in streaming services and pay-TV subscriptions. In the United States, for example, recent data shows a significant uptick in the adoption of smart devices, such as smart TVs and smartphones. This surge in smart device usage aligns with the increased demand for secure access mechanisms, propelling the CAS market forward. Additionally, stringent content protection regulations imposed by the government have further fueled the adoption of advanced CAS technologies to ensure compliance and protect intellectual property. With the expansion of High-Definition (HD) and Ultra High-Definition (UHD) content, the North American CAS market is positioned for continued growth, meeting the evolving needs of digital content consumers.

The Asia Pacific region is expected to grow with the highest CAGR in the Conditional Access Systems (CAS) market during the forecast period, driven by the increasing availability and adoption of high-speed internet and broadband services. Government statistical data from countries including China and India highlight a significant rise in internet penetration, indicating a growing demand for digital content services. As governments in the region focus on expanding digital infrastructure, CAS plays a crucial role in ensuring secure access control for the seamless delivery of digital content. The rising adoption of smart devices, particularly in densely populated countries, further contributes to the market’s growth. Stringent content protection regulations implemented by some governments in the Asia Pacific region underscore the importance of secure content access, driving the adoption of advanced CAS technologies. With the region’s diverse and expanding digital landscape, the CAS market in Asia Pacific is poised for sustained growth, offering secure and efficient access to the growth of digital content consumers.

The primary factor driving the Conditional Access Systems market’s growth rate is the growing demand for digital content services, including streaming platforms, video-on-demand, and pay-TV services, contributing to the need for secure access systems.

Key Highlights of the Report

The global Conditional Access Systems market is segmented by Type of Conditional Access Systems, application, end user, security levels, delivery models, integration levels, emerging technologies, and region. Smart Card-based Conditional Access Systems are the most popular, while Cardless CAS are the primary segments. In addition, Internet Protocol Television (IPTV) and Television Broadcasting cables are the most common applications. However, Advanced Encryption Standards (AES) and Hardware-Based CAS dominate the market, with North America leading the market growth.

The main factors propelling the global market for Conditional Access Systems is The shift towards higher resolution content and immersive viewing experiences accelerates the demand for advanced CAS, ensuring secure delivery and access to high-quality multimedia content. The growth of CAS is supported by the increasing availability and adoption of high-speed internet and broadband services, enabling the seamless delivery of digital content and requiring robust access control.

Moreover, North America is anticipated to have the greatest share of the global Conditional Access Systems market due to the adoption of smart devices, such as smart TVs and smartphones. Furthermore, the market is anticipated to expand at the highest rate in the Asia-Pacific (APAC) region due to the stringent content protection regulations implemented by some governments in the Asia Pacific region underscore the importance of secure content access, driving the adoption of advanced CAS technologies.

What Are The Main Drivers Of The Global Conditional Access Systems Market?

The global Conditional Access Systems market is primarily driven by the increasing demand for secure content and the growing need for advanced digital TV services. As more people seek ways to protect their digital content and enhance their television viewing experiences, the market for Conditional Access Systems sees a rise. These systems play a crucial role in ensuring that only authorized users can access digital content, which is a key factor contributing to their widespread adoption. Additionally, the constant evolution of technology and the desire for more sophisticated TV services further propel the market forward.

What Are The Major Challenges Faced By The Global Conditional Access Systems Market?

The market faces significant challenges, with piracy and unauthorized access ranking among the major issues. The prevalence of individuals attempting to obtain digital content without proper authorization poses a threat to the industry. Additionally, the rapid pace of technological changes presents a considerable challenge for companies operating in the Conditional Access Systems market. Staying abreast of the latest advancements and adapting their systems to these changes is crucial for the sustained success of businesses in this industry.

What Are The Growth Opportunities In The Global Conditional Access Systems Market?

Growth opportunities in the global Conditional Access Systems market. The increasing demand for secure content and advanced digital TV services creates avenues for innovation and expansion. Companies that can develop effective solutions to counter piracy and adapt swiftly to technological shifts stand to capitalize on these growth opportunities. As the market continues to evolve, there is potential for new technologies and strategies to further enhance the security and capabilities of Conditional Access Systems, opening doors for continued expansion and development within the industry.

Market Drivers

The global Conditional Access Systems market is driven by several factors. The following are the key drivers of the global Conditional Access Systems market:

Increasing Demand for Secure Content

The main drivers for the global Conditional Access Systems market is the increasing demand for secure content. As the digital landscape expands, individuals and businesses alike are more concerned about protecting their digital assets. This rising need for security drives the adoption of Conditional Access Systems, which play a crucial role in ensuring that only authorized users have access to sensitive and valuable digital content. The demand for secure content is a significant force propelling the growth of the market.

Market Restraints

The global Conditional Access Systems market faces some challenges that may hinder its growth. These include the following:

Piracy and Unauthorized Access Ranking

A major challenge faced by the global Conditional Access Systems market is the prevalence of piracy and unauthorized access. Unauthorized users attempting to access digital content without proper authorization pose a serious threat to the industry. This challenge acts as a restraint on the market’s growth, requiring continuous efforts and advancements in technology to combat piracy effectively. The need to develop robust solutions to counter unauthorized access is crucial for the sustained success of companies operating in this market.

Opportunities

The global Conditional Access Systems market offers significant growth opportunities. These include the following:

Rising Need for Advanced Digital TV Services

The rising need for advanced digital TV services presents a notable growth opportunity for the Conditional Access Systems market. As technology advances, consumers increasingly seek enhanced features and capabilities in their television experiences. Conditional Access Systems play a pivotal role in meeting this demand by ensuring secure access to premium digital TV services. Companies in the market have the opportunity to innovate and develop solutions that align with the evolving expectations of consumers, thereby capitalizing on the growing market for advanced digital TV services.

Competitive Landscape

Conditional Access Systems Market Report

Shape Your Report to Specific Countries or Regions & Enjoy 30% Off!

Key Players

The global Conditional Access Systems market is highly competitive, with several key players. Some of the major players in the market and their market share are as follows:

  • Alticast Corporation
  • Cisco Systems, Inc.
  • ARRIS Group, Inc.
  • Nagravision SA (Kudelski Group)
  • China Digital TV Holding Co., Ltd.
  • Coretrust, Inc.
  • Latens Systems Ltd.
  • Austrian Broadcasting Services GmbH & Co. KG (ORS Group)
  • Irdeto, Inc.
  • Others

These organizations prioritize product innovation, distribution channel expansion, and mergers and acquisitions to stay competitive.

The global Conditional Access Systems market’s key players continually seek to stay ahead by offering new products and developments.

In August 2023, Rogers Communications Inc. has introduced 5G wireless service for its customers in key areas of Toronto’s downtown subway network amid an ongoing dispute with other major carriers regarding access terms for all transit riders. The telecommunications company, headquartered in Toronto, has additionally enhanced the cellular network to offer more dependable access to 911 service for all subway riders within these specific areas.

In July 2023, Azure IAM has unveiled its consulting service for conditional access systems, catering to organizations such as universities aiming to enhance the robust security of users and assets in the cloud. This service provides comprehensive assistance and guidance to ensure a strong and effective implementation of conditional access measures, addressing the specific security needs of diverse entities operating in the cloud environment.

Summary of Key Findings

  • The demand for Smart Card-Based CAS is rising due to the growing demand for digital content services, including streaming platforms, video-on-demand, and pay-TV services, contributing to the need for secure access systems, which is boosting the growth of the Conditional Access Systems market.
  • Market segmented by type of conditional access systems, application, end user, security levels, delivery models, integration levels, emerging technologies, and region.
  • Internet Protocol Television (IPTV)-based Conditional Access Systems are the most popular, with consumer electronics and IT and telecom sectors as primary user segments.
  • Broadcasters and content providers, and cable television operators are most commonly used for devices.
  • North America is leading market growth; the market is highly competitive with key players including Alticast Corporation, Cisco Systems, Inc., ARRIS Group, Inc., Nagravision SA (Kudelski Group), China Digital TV Holding Co., Ltd., Coretrust, Inc., Latens Systems Ltd., Austrian Broadcasting Services GmbH & Co. KG (ORS Group), Irdeto, Inc., and Others.

Future Outlook

  • Positive outlook for the global Conditional Access Systems market with significant growth potential in the North American region
  • One of the main factors promoting the market’s expansion is the expansion of high-definition (HD) and ultra high-definition (UHD) content.
  • During the forecast period, concerns regarding privacy and content piracy is a significant factor projected to restrain the growth of the Conditional Access Systems market.
  • Key firms must focus on product innovation, growing market reach, and maintaining competitive pricing to keep ahead of the competition.

How CXOs Can Benefit from the Credence Research Conditional Access Systems Market Report

The Credence Research Conditional Access Systems Market Report provides CXOs with a comprehensive overview of the market, including:

  • Market size and growth forecast:The report provides detailed estimates of the global Conditional Access Systems market size, segmented by type of conditional access systems, application, end user, security levels, delivery models, integration levels, emerging technologies, and region. It also includes forecasts for the market through 2032, based on key trends and drivers.
  • Market segmentation:The report segments the Conditional Access Systems market by type of conditional access systems, application, end user, security levels, delivery models, integration levels, emerging technologies, and region. This segmentation provides CXOs with a granular understanding of the market and the opportunities in each segment.
  • Competitive landscape:The report profiles the key players in the Conditional Access Systems market and provides insights into their strategies, product offerings, and financial performance. This information can help CXOs to identify and assess their competition.
  • Key trends and drivers:The report identifies and analyzes the key trends and drivers that are shaping the Conditional Access Systems This information can help CXOs to make informed decisions about their investments and strategies.

CXOs can use the insights from the Credence Research Conditional Access Systems Market Report to:

  • Identify growth opportunities: The report can help CXOs to identify new growth opportunities in the Conditional Access Systems For example, the report identifies the growing demand for Conditional Access Systems from cloud service providers and telecom companies as a key opportunity.
  • Make informed investment decisions: The report can help CXOs to make informed investment decisions about Conditional Access Systems. For example, the report provides insights into the key factors to consider when evaluating Conditional Access Systems providers and selecting Conditional Access Systems
  • Develop competitive strategies: The report can help CXOs to develop competitive strategies for their Conditional Access Systems For example, the report identifies the key strategies that Conditional Access Systems providers are using to differentiate themselves from their competitors.
  • Track market developments: The report can help CXOs to track market developments and stay ahead of the curve. For example, the report provides insights into the latest trends and innovations in the Conditional Access Systems

Overall, the Credence Research Conditional Access Systems Market Report is a valuable resource for CXOs who are looking to gain a deeper understanding of the market and identify opportunities for growth.

Segmentation

By Type of Conditional Access Systems

  • Smart Card-Based CAS
  • Cardless CAS

By Applications

  • Television Broadcasting
  • Internet Protocol Television (IPTV)
  • Digital Radio Broadcasting

By End-User

  • Broadcasters and Content Providers
  • Cable Television Operators
  • Satellite Television Operators
  • IPTV Service Providers
  • Digital Terrestrial Television (DTT) Operators

By Security Levels

  • Basic Encryption
  • Advanced Encryption Standards (AES)
  • Digital Rights Management (DRM)

By Delivery Models

  • Hardware-Based CAS
  • Software-Based CAS

By Integration Levels

  • Integrated CAS
  • Middleware Integration

By Emerging Technologies

  • Cloud-Based CAS
  • Advanced Analytics and Reporting

By Region

  • North America
    • The U.S.
    • Canada
    • Mexico
  • Europe
    • Germany
    • France
    • The U.K.
    • Italy
    • Spain
    • Rest of Europe
  • Asia Pacific
    • China
    • Japan
    • India
    • South Korea
    • South-east Asia
    • Rest of Asia Pacific
  • Latin America
    • Brazil
    • Argentina
    • Rest of Latin America
  • Middle East & Africa
    • GCC Countries
    • South Africa
    • Rest of Middle East and Africa

Table of Content
1. Preface
1.1. Report Description
1.1.1. Purpose of the Report
1.1.2. Target Audience
1.1.3. USP and Key Offerings
1.2. Research Scope
1.3. Market Introduction
2. Executive Summary
2.1. Market Snapshot: Global Conditional Access Systems Market
2.1.1. Global Conditional Access Systems Market, By Type of Conditional Access Systems
2.1.2. Global Conditional Access Systems Market, By Applications
2.1.3. Global Conditional Access Systems Market, By End-User
2.1.4. Global Conditional Access Systems Market, By Security Levels
2.1.5. Global Conditional Access Systems Market, By Delivery Models
2.1.6. Global Conditional Access Systems Market, By Integration Levels
2.1.7. Global Conditional Access Systems Market, By Emerging Technologies
2.1.8. Global Conditional Access Systems Market, By Region
2.2. Insights from Primary Respondents
3. Market Dynamics & Factors Analysis
3.1. Introduction
3.1.1. Global Conditional Access Systems Market Value, 2019-2032, (US$ Mn)
3.1.2. Y-o-Y Growth Trend Analysis
3.2. Market Dynamics
3.2.1. Conditional Access Systems Market Drivers
3.2.2. Conditional Access Systems Market Restraints
3.2.3. Conditional Access Systems Market Opportunities
3.2.4. Major Conditional Access Systems Industry Challenges
3.3. Growth and Development Patterns
3.4. Investment Feasibility Analysis
3.5. Market Opportunity Analysis
3.5.1. Type of Conditional Access Systems
3.5.2. Applications
3.5.3. End-User
3.5.4. Security Levels
3.5.5. Delivery Models
3.5.6. Integration Levels
3.5.7. Emerging Technologies
3.5.8. Geography
4. Market Competitive Landscape Analysis
4.1. Company Market Share Analysis, 2023
4.1.1. Global Conditional Access Systems Market: Company Market Share, Value 2023
4.1.2. Global Conditional Access Systems Market: Top 6 Company Market Share, Value 2023
4.1.3. Global Conditional Access Systems Market: Top 3 Company Market Share, Value 2023
4.2. Global Conditional Access Systems Market: Company Revenue Share Analysis, 2023
4.3. Company Assessment Metrics, 2023
4.3.1. Stars
4.3.2. Emerging Leaders
4.3.3. Pervasive Players
4.3.4. Participants
4.4. Startups/ SMEs Assessment Metrics, 2023
4.4.1. Progressive Companies
4.4.2. Responsive Companies
4.4.3. Dynamic Companies
4.4.4. Starting Blocks
4.5. Strategic Development
4.5.1. Acquisition and Mergers
4.5.2. New Product Launch
4.5.3. Regional Expansion
4.5.4. Partnerships
4.6. Key Player Product Matrix
4.7. Potential for New Players in the Global Conditional Access Systems Market
5. Premium Insights
5.1. STAR (Situation, Task, Action, Results) Analysis
5.2. Porter’s Five Forces Analysis
5.2.1. Threat of New Entrants
5.2.2. Bargaining Power of Buyers/Consumers
5.2.3. Bargaining Power of Suppliers
5.2.4. Threat of Substitute Types
5.2.5. Intensity of Competitive Rivalry
5.3. PESTEL Analysis
5.3.1. Political Factors
5.3.2. Economic Factors
5.3.3. Social Factors
5.3.4. Technological Factors
5.3.5. Environmental Factors
5.3.6. Legal Factors
5.4. Key Market Trends
5.4.1. Demand Side Trends
5.4.2. Supply Side Trends
5.5. Value Chain Analysis
5.6. Technology Analysis
5.6.1. Research and development in the global market
5.6.2. Patent Analysis
5.6.3. Emerging technologies and their potential disruption to the market
5.7. Consumer Behaviour Analysis
5.7.1. Consumer Preferences and Expectations
5.7.2. Factors Influencing Consumer Buying Decisions
5.7.2.1. North America
5.7.2.2. Europe
5.7.2.3. Asia Pacific
5.7.2.4. Latin America
5.7.2.5. Middle East and Africa
5.7.3. Consumer Pain Points
5.8. Analysis and Recommendations
5.9. Adjacent Market Analysis
6. Market Positioning of Key Players, 2023
6.1. Company market share of key players, 2023
6.2. Competitive Benchmarking
6.3. Market Positioning of Key Vendors
6.4. Geographical Presence Analysis
6.5. Major Strategies Adopted by Key Players
6.5.1. Key Strategies Analysis
6.5.2. Mergers and Acquisitions
6.5.3. Partnerships
6.5.4. Product Launch
6.5.5. Geographical Expansion
6.5.6. Others
7. Impact Analysis of COVID 19 and Russia – Ukraine War on Conditional Access Systems Market
7.1. Ukraine-Russia War Impact
7.1.1. Uncertainty and Economic Instability
7.1.2. Supply chain disruptions
7.1.3. Regional market shifts
7.1.4. Shift in government priorities
7.2. COVID-19 Impact Analysis
7.2.1. Supply Chain Disruptions
7.2.2. Demand Fluctuations
7.2.3. Shift in Product Mix
7.2.4. Reduced Industrial Activity
7.2.5. Regional Impact Analysis
7.2.5.1. North America
7.2.5.2. Europe
7.2.5.3. Asia Pacific
7.2.5.4. Latin America
7.2.5.5. Middle East and Africa
8. Global Conditional Access Systems Market, By Type of Conditional Access Systems
8.1. Global Conditional Access Systems Market Overview, by Type of Conditional Access Systems
8.1.1. Global Conditional Access Systems Market Revenue Share, By Type of Conditional Access Systems, 2023 Vs 2032 (in %)
8.2. Smart Card-Based CAS
8.2.1. Global Conditional Access Systems Market, By Smart Card-Based CAS, By Region, 2019-2032 (US$ Mn)
8.2.2. Market Dynamics for Smart Card-Based CAS
8.2.2.1. Drivers
8.2.2.2. Restraints
8.2.2.3. Opportunities
8.2.2.4. Trends
8.3. Cardless CAS
8.3.1. Global Conditional Access Systems Market, By Cardless CAS, By Region, 2019-2032 (US$ Mn)
8.3.2. Market Dynamics for Cardless CAS
8.3.2.1. Drivers
8.3.2.2. Restraints
8.3.2.3. Opportunities
8.3.2.4. Trends
9. Global Conditional Access Systems Market, By Applications
9.1. Global Conditional Access Systems Market Overview, by Applications
9.1.1. Global Conditional Access Systems Market Revenue Share, By Applications, 2023 Vs 2032 (in %)
9.2. IPTV Service Providers Broadcasting
9.2.1. Global Conditional Access Systems Market, By IPTV Service Providers Broadcasting, By Region, 2019-2032 (US$ Mn)
9.2.2. Market Dynamics for IPTV Service Providers Broadcasting
9.2.2.1. Drivers
9.2.2.2. Restraints
9.2.2.3. Opportunities
9.2.2.4. Trends
9.3. Internet Protocol IPTV Service Providers (IPTV)
9.3.1. Global Conditional Access Systems Market, By Internet Protocol IPTV Service Providers (IPTV), By Region, 2019-2032 (US$ Mn)
9.3.2. Market Dynamics for Internet Protocol IPTV Service Providers (IPTV)
9.3.2.1. Drivers
9.3.2.2. Restraints
9.3.2.3. Opportunities
9.3.2.4. Trends
9.4. Digital Radio Broadcasting
9.4.1. Global Conditional Access Systems Market, By Digital Radio Broadcasting, By Region, 2019-2032 (US$ Mn)
9.4.2. Market Dynamics for Digital Radio Broadcasting
9.4.2.1. Drivers
9.4.2.2. Restraints
9.4.2.3. Opportunities
9.4.2.4. Trends
10. Global Conditional Access Systems Market, By End-User
10.1. Global Conditional Access Systems Market Overview, by End-User
10.1.1. Global Conditional Access Systems Market Revenue Share, By End-User, 2023 Vs 2032 (in %)
10.2. Broadcasters and Content Providers
10.2.1. Global Conditional Access Systems Market, By Broadcasters and Content Providers, By Region, 2019-2032 (US$ Mn)
10.2.2. Market Dynamics for Broadcasters and Content Providers
10.2.2.1. Drivers
10.2.2.2. Restraints
10.2.2.3. Opportunities
10.2.2.4. Trends
10.3. Cable IPTV Service Providers Operators
10.3.1. Global Conditional Access Systems Market, By Cable IPTV Service Providers Operators, By Region, 2019-2032 (US$ Mn)
10.3.2. Market Dynamics for Cable IPTV Service Providers Operators
10.3.2.1. Drivers
10.3.2.2. Restraints
10.3.2.3. Opportunities
10.3.2.4. Trends
10.4. Satellite IPTV Service Providers Operators
10.4.1. Global Conditional Access Systems Market, By Satellite IPTV Service Providers Operators, By Region, 2019-2032 (US$ Mn)
10.4.2. Market Dynamics for Ethernet
10.4.2.1. Drivers
10.4.2.2. Restraints
10.4.2.3. Opportunities
10.4.2.4. Trends
10.5. IPTV Service Providers
10.5.1. Global Conditional Access Systems Market, By IPTV Service Providers, By Region, 2019-2032 (US$ Mn)
10.5.2. Market Dynamics for IPTV Service Providers
10.5.2.1. Drivers
10.5.2.2. Restraints
10.5.2.3. Opportunities
10.5.2.4. Trends
10.6. Digital Terrestrial Television (DTT) Operators
10.6.1. Global Conditional Access Systems Market, By Digital Terrestrial Television (DTT) Operators, By Region, 2019-2032 (US$ Mn)
10.6.2. Market Dynamics for Digital Terrestrial Television (DTT) Operators
10.6.2.1. Drivers
10.6.2.2. Restraints
10.6.2.3. Opportunities
10.6.2.4. Trends
11. Global Conditional Access Systems Market, By Security Levels
11.1. Global Conditional Access Systems Market Overview, by Security Levels
11.1.1. Global Conditional Access Systems Market Revenue Share, By Security Levels, 2023 Vs 2032 (in %)
11.2. Basic Encryption
11.2.1. Global Conditional Access Systems Market, By Basic Encryption, By Region, 2019-2032 (US$ Mn)
11.2.2. Market Dynamics for Basic Encryption
11.2.2.1. Drivers
11.2.2.2. Restraints
11.2.2.3. Opportunities
11.2.2.4. Trends
11.3. Advanced Encryption Standards (AES)
11.3.1. Global Conditional Access Systems Market, By Advanced Encryption Standards (AES), By Region, 2019-2032 (US$ Mn)
11.3.2. Market Dynamics for Advanced Encryption Standards (AES)
11.3.2.1. Drivers
11.3.2.2. Restraints
11.3.2.3. Opportunities
11.3.2.4. Trends
11.4. Digital Rights Management (DRM)
11.4.1. Global Conditional Access Systems Market, By Digital Rights Management (DRM), By Region, 2019-2032 (US$ Mn)
11.4.2. Market Dynamics for Digital Rights Management (DRM)
11.4.2.1. Drivers
11.4.2.2. Restraints
11.4.2.3. Opportunities
11.4.2.4. Trends
12. Global Conditional Access Systems Market, By Delivery Models
12.1. Global Conditional Access Systems Market Overview, by Delivery Models
12.1.1. Global Conditional Access Systems Market Revenue Share, By Delivery Models, 2023 Vs 2032 (in %)
12.2. Hardware-Based CAS
12.2.1. Global Conditional Access Systems Market, By Hardware-Based CAS, By Region, 2019-2032 (US$ Mn)
12.2.2. Market Dynamics for Hardware-Based CAS
12.2.2.1. Drivers
12.2.2.2. Restraints
12.2.2.3. Opportunities
12.2.2.4. Trends
12.3. Software-Based CAS
12.3.1. Global Conditional Access Systems Market, By Software-Based CAS, By Region, 2019-2032 (US$ Mn)
12.3.2. Market Dynamics for Software-Based CAS
12.3.2.1. Drivers
12.3.2.2. Restraints
12.3.2.3. Opportunities
12.3.2.4. Trends
13. Global Conditional Access Systems Market, By Integration Levels
13.1. Global Conditional Access Systems Market Overview, by Integration Levels
13.1.1. Global Conditional Access Systems Market Revenue Share, By Integration Levels, 2023 Vs 2032 (in %)
13.2. Integrated CAS
13.2.1. Global Conditional Access Systems Market, By Integrated CAS, By Region, 2019-2032 (US$ Mn)
13.2.2. Market Dynamics for Integrated CAS
13.2.2.1. Drivers
13.2.2.2. Restraints
13.2.2.3. Opportunities
13.2.2.4. Trends
13.3. Middleware Integration
13.3.1. Global Conditional Access Systems Market, By Middleware Integration, By Region, 2019-2032 (US$ Mn)
13.3.2. Market Dynamics for Middleware Integration
13.3.2.1. Drivers
13.3.2.2. Restraints
13.3.2.3. Opportunities
13.3.2.4. Trends
14. Global Conditional Access Systems Market, By Emerging Technologies
14.1. Global Conditional Access Systems Market Overview, by Emerging Technologies
14.1.1. Global Conditional Access Systems Market Revenue Share, By Emerging Technologies, 2023 Vs 2032 (in %)
14.2. Cloud-Based CAS
14.2.1. Global Conditional Access Systems Market, By Cloud-Based CAS, By Region, 2019-2032 (US$ Mn)
14.2.2. Market Dynamics for Cloud-Based CAS
14.2.2.1. Drivers
14.2.2.2. Restraints
14.2.2.3. Opportunities
14.2.2.4. Trends
14.3. Advanced Analytics and Reporting
14.3.1. Global Conditional Access Systems Market, By Advanced Analytics and Reporting, By Region, 2019-2032 (US$ Mn)
14.3.2. Market Dynamics for Advanced Analytics and Reporting
14.3.2.1. Drivers
14.3.2.2. Restraints
14.3.2.3. Opportunities
14.3.2.4. Trends
15. Global Conditional Access Systems Market, By Region
15.1. Global Conditional Access Systems Market Overview, by Region
15.1.1. Global Conditional Access Systems Market, By Region, 2023 vs 2032 (in%)
15.2. Type of Conditional Access Systems
15.2.1. Global Conditional Access Systems Market, By Type of Conditional Access Systems, 2019-2032 (US$ Mn)
15.3. Applications
15.3.1. Global Conditional Access Systems Market, By Applications, 2019-2032 (US$ Mn)
15.4. End-User
15.4.1. Global Conditional Access Systems Market, By End-User, 2019-2032 (US$ Mn)
15.5. Security Levels
15.5.1. Global Conditional Access Systems Market, By Security Levels, 2019-2032 (US$ Mn)
15.6. Delivery Models
15.6.1. Global Conditional Access Systems Market, By Delivery Models, 2019-2032 (US$ Mn)
15.7. Integration Levels
15.7.1. Global Conditional Access Systems Market, By Integration Levels, 2019-2032 (US$ Mn)
15.8. Emerging Technologies
15.8.1. Global Conditional Access Systems Market, By Emerging Technologies, 2019-2032 (US$ Mn)
16. North America Conditional Access Systems Market Analysis
16.1. Overview
16.1.1. Market Dynamics for North America
16.1.1.1. Drivers
16.1.1.2. Restraints
16.1.1.3. Opportunities
16.1.1.4. Trends
16.2. North America Conditional Access Systems Market, by Type of Conditional Access Systems, 2019-2032(US$ Mn)
16.2.1. Overview
16.2.2. SRC Analysis
16.3. North America Conditional Access Systems Market, by Applications, 2019-2032(US$ Mn)
16.3.1. Overview
16.3.2. SRC Analysis
16.4. North America Conditional Access Systems Market, by End-User, 2019-2032(US$ Mn)
16.4.1. Overview
16.4.2. SRC Analysis
16.5. North America Conditional Access Systems Market, by Security Levels, 2019-2032(US$ Mn)
16.5.1. Overview
16.5.2. SRC Analysis
16.6. North America Conditional Access Systems Market, by Delivery Models, 2019-2032(US$ Mn)
16.6.1. Overview
16.6.2. SRC Analysis
16.7. North America Conditional Access Systems Market, by Integration Levels, 2019-2032(US$ Mn)
16.7.1. Overview
16.7.2. SRC Analysis
16.8. North America Conditional Access Systems Market, by Emerging Technologies, 2019-2032(US$ Mn)
16.8.1. Overview
16.8.2. SRC Analysis
16.9. North America Conditional Access Systems Market, by Country, 2019-2032 (US$ Mn)
16.9.1. North America Conditional Access Systems Market, by Country, 2023 Vs 2032 (in%)
16.9.2. U.S.
16.9.3. Canada
16.9.4. Mexico
17. Europe Conditional Access Systems Market Analysis
17.1. Overview
17.1.1. Market Dynamics for North America
17.1.1.1. Drivers
17.1.1.2. Restraints
17.1.1.3. Opportunities
17.1.1.4. Trends
17.2. Europe Conditional Access Systems Market, by Type of Conditional Access Systems, 2019-2032(US$ Mn)
17.2.1. Overview
17.2.2. SRC Analysis
17.3. Europe Conditional Access Systems Market, by Applications, 2019-2032(US$ Mn)
17.3.1. Overview
17.3.2. SRC Analysis
17.4. Europe Conditional Access Systems Market, by End-User, 2019-2032(US$ Mn)
17.4.1. Overview
17.4.2. SRC Analysis
17.5. Europe Conditional Access Systems Market, by Security Levels, 2019-2032(US$ Mn)
17.5.1. Overview
17.5.2. SRC Analysis
17.6. Europe Conditional Access Systems Market, by Delivery Models, 2019-2032(US$ Mn)
17.6.1. Overview
17.6.2. SRC Analysis
17.7. Europe Conditional Access Systems Market, by Integration Levels, 2019-2032(US$ Mn)
17.7.1. Overview
17.7.2. SRC Analysis
17.8. Europe Conditional Access Systems Market, by Emerging Technologies, 2019-2032(US$ Mn)
17.8.1. Overview
17.8.2. SRC Analysis
17.9. Europe Conditional Access Systems Market, by Country, 2019-2032 (US$ Mn)
17.9.1. Europe Conditional Access Systems Market, by Country, 2023 Vs 2032 (in%)
17.9.2. UK
17.9.3. France
17.9.4. Germany
17.9.5. Italy
17.9.6. Spain
17.9.7. Benelux
17.9.8. Russia
17.9.9. Rest of Europe
18. Asia Pacific Conditional Access Systems Market Analysis
18.1. Overview
18.1.1. Market Dynamics for North America
18.1.1.1. Drivers
18.1.1.2. Restraints
18.1.1.3. Opportunities
18.1.1.4. Trends
18.2. Asia Pacific Conditional Access Systems Market, by Type of Conditional Access Systems, 2019-2032(US$ Mn)
18.2.1. Overview
18.2.2. SRC Analysis
18.3. Asia Pacific Conditional Access Systems Market, by Applications, 2019-2032(US$ Mn)
18.3.1. Overview
18.3.2. SRC Analysis
18.4. Asia Pacific Conditional Access Systems Market, by End-User, 2019-2032(US$ Mn)
18.4.1. Overview
18.4.2. SRC Analysis
18.5. Asia Pacific Conditional Access Systems Market, by Security Levels, 2019-2032(US$ Mn)
18.5.1. Overview
18.5.2. SRC Analysis
18.6. Asia Pacific Conditional Access Systems Market, by Delivery Models, 2019-2032(US$ Mn)
18.6.1. Overview
18.6.2. SRC Analysis
18.7. Asia Pacific Conditional Access Systems Market, by Integration Levels, 2019-2032(US$ Mn)
18.7.1. Overview
18.7.2. SRC Analysis
18.8. Asia Pacific Conditional Access Systems Market, by Emerging Technologies, 2019-2032(US$ Mn)
18.8.1. Overview
18.8.2. SRC Analysis
18.9. Asia Pacific Conditional Access Systems Market, by Country, 2019-2032 (US$ Mn)
18.9.1. Asia Pacific Conditional Access Systems Market, by Country, 2023 Vs 2032 (in%)
18.9.2. China
18.9.3. Japan
18.9.4. India
18.9.5. South Korea
18.9.6. South East Asia
18.9.7. Rest of Asia Pacific
19. Latin America Conditional Access Systems Market Analysis
19.1. Overview
19.1.1. Market Dynamics for North America
19.1.1.1. Drivers
19.1.1.2. Restraints
19.1.1.3. Opportunities
19.1.1.4. Trends
19.2. Latin America Conditional Access Systems Market, by Type of Conditional Access Systems, 2019-2032(US$ Mn)
19.2.1. Overview
19.2.2. SRC Analysis
19.3. Latin America Conditional Access Systems Market, by Applications, 2019-2032(US$ Mn)
19.3.1. Overview
19.3.2. SRC Analysis
19.4. Latin America Conditional Access Systems Market, by End-User, 2019-2032(US$ Mn)
19.4.1. Overview
19.4.2. SRC Analysis
19.5. Latin America Conditional Access Systems Market, by Security Levels, 2019-2032(US$ Mn)
19.5.1. Overview
19.5.2. SRC Analysis
19.6. Latin America Conditional Access Systems Market, by Delivery Models, 2019-2032(US$ Mn)
19.6.1. Overview
19.6.2. SRC Analysis
19.7. Latin America Conditional Access Systems Market, by Integration Levels, 2019-2032(US$ Mn)
19.7.1. Overview
19.7.2. SRC Analysis
19.8. Latin America Conditional Access Systems Market, by Emerging Technologies, 2019-2032(US$ Mn)
19.8.1. Overview
19.8.2. SRC Analysis
19.9. Latin America Conditional Access Systems Market, by Country, 2019-2032 (US$ Mn)
19.9.1. Latin America Conditional Access Systems Market, by Country, 2023 Vs 2032 (in%)
19.9.2. Brazil
19.9.3. Argentina
19.9.4. Rest of Latin America
20. Middle East Conditional Access Systems Market Analysis
20.1. Overview
20.1.1. Market Dynamics for North America
20.1.1.1. Drivers
20.1.1.2. Restraints
20.1.1.3. Opportunities
20.1.1.4. Trends
20.2. Middle East Conditional Access Systems Market, by Type of Conditional Access Systems, 2019-2032(US$ Mn)
20.2.1. Overview
20.2.2. SRC Analysis
20.3. Middle East Conditional Access Systems Market, by Applications, 2019-2032(US$ Mn)
20.3.1. Overview
20.3.2. SRC Analysis
20.4. Middle East Conditional Access Systems Market, by End-User, 2019-2032(US$ Mn)
20.4.1. Overview
20.4.2. SRC Analysis
20.5. Middle East Conditional Access Systems Market, by Security Levels, 2019-2032(US$ Mn)
20.5.1. Overview
20.5.2. SRC Analysis
20.6. Middle East Conditional Access Systems Market, by Delivery Models, 2019-2032(US$ Mn)
20.6.1. Overview
20.6.2. SRC Analysis
20.7. Middle East Conditional Access Systems Market, by Integration Levels, 2019-2032(US$ Mn)
20.7.1. Overview
20.7.2. SRC Analysis
20.8. Middle East Conditional Access Systems Market, by Emerging Technologies, 2019-2032(US$ Mn)
20.8.1. Overview
20.8.2. SRC Analysis
20.9. Middle East Conditional Access Systems Market, by Country, 2019-2032 (US$ Mn)
20.9.1. Middle East Conditional Access Systems Market, by Country, 2023 Vs 2032 (in%)
20.9.2. UAE
20.9.3. Saudi Arabia
20.9.4. Rest of Middle East
21. Africa Conditional Access Systems Market Analysis
21.1. Overview
21.1.1. Market Dynamics for North America
21.1.1.1. Drivers
21.1.1.2. Restraints
21.1.1.3. Opportunities
21.1.1.4. Trends
21.2. Africa Conditional Access Systems Market, by Type of Conditional Access Systems, 2019-2032(US$ Mn)
21.2.1. Overview
21.2.2. SRC Analysis
21.3. Africa Conditional Access Systems Market, by Applications, 2019-2032(US$ Mn)
21.3.1. Overview
21.3.2. SRC Analysis
21.4. Africa Conditional Access Systems Market, by End-User, 2019-2032(US$ Mn)
21.4.1. Overview
21.4.2. SRC Analysis
21.5. Africa Conditional Access Systems Market, by Security Levels, 2019-2032(US$ Mn)
21.5.1. Overview
21.5.2. SRC Analysis
21.6. Africa Conditional Access Systems Market, by Delivery Models, 2019-2032(US$ Mn)
21.6.1. Overview
21.6.2. SRC Analysis
21.7. Africa Conditional Access Systems Market, by Integration Levels, 2019-2032(US$ Mn)
21.7.1. Overview
21.7.2. SRC Analysis
21.8. Africa Conditional Access Systems Market, by Emerging Technologies, 2019-2032(US$ Mn)
21.8.1. Overview
21.8.2. SRC Analysis
21.9. Africa Conditional Access Systems Market, by Country, 2019-2032 (US$ Mn)
21.9.1. Middle East Conditional Access Systems Market, by Country, 2023 Vs 2032 (in%)
21.9.2. South Africa
21.9.3. Egypt
21.9.4. Rest of Africa
22. Company Profiles
22.1. Alticast Corporation
22.1.1. Company Overview
22.1.2. Products/Services Portfolio
22.1.3. Geographical Presence
22.1.4. SWOT Analysis
22.1.5. Financial Summary
22.1.5.1. Market Revenue and Net Profit (2019-2023)
22.1.5.2. Business Segment Revenue Analysis
22.1.5.3. Geographical Revenue Analysis
22.2. Cisco Systems, Inc.
22.3. ARRIS Group, Inc.
22.4. Nagravision SA (Kudelski Group)
22.5. China Digital TV Holding Co., Ltd.
22.6. Coretrust, Inc.
22.7. Latens Systems Ltd.
22.8. Austrian Broadcasting Services GmbH & Co. KG (ORS Group
22.9. Irdeto, Inc.
22.10. Others
23. Research Methodology
23.1. Research Methodology
23.2. Phase I – Secondary Research
23.3. Phase II – Data Modelling
23.3.1. Company Share Analysis Model
23.3.2. Revenue Based Modelling
23.4. Phase III – Primary Research
23.5. Research Limitations
23.5.1. Assumptions

List of Figures
FIG. 1 Global Conditional Access Systems Market: Research Methodology
FIG. 2 Market Size Estimation – Top Down & Bottom up Approach
FIG. 3 Global Conditional Access Systems Market Segmentation
FIG. 4 Global Conditional Access Systems Market, by Type of Conditional Access Systems, 2023 (US$ Mn)
FIG. 5 Global Conditional Access Systems Market, by Applications, 2023 (US$ Mn)
FIG. 6 Global Conditional Access Systems Market, by End-User, 2023 (US$ Mn)
FIG. 7 Global Conditional Access Systems Market, by Security Levels, 2023 (US$ Mn)
FIG. 8 Global Conditional Access Systems Market, by Delivery Models, 2023 (US$ Mn)
FIG. 9 Global Conditional Access Systems Market, by Integration Levels, 2023 (US$ Mn)
FIG. 10 Global Conditional Access Systems Market, by Emerging Technologies, 2023 (US$ Mn)
FIG. 11 Global Conditional Access Systems Market, by Geography, 2023 (US$ Mn)
FIG. 12 Attractive Investment Proposition, by Type of Conditional Access Systems, 2023
FIG. 13 Attractive Investment Proposition, by Applications, 2023
FIG. 14 Attractive Investment Proposition, by End-User, 2023
FIG. 15 Attractive Investment Proposition, by Security Levels, 2023
FIG. 16 Attractive Investment Proposition, by Delivery Models, 2023
FIG. 17 Attractive Investment Proposition, by Integration Levels, 2023
FIG. 18 Attractive Investment Proposition, by Emerging Technologies, 2023
FIG. 19 Attractive Investment Proposition, by Geography, 2023
FIG. 20 Global Market Share Analysis of Key Conditional Access Systems Market Manufacturers, 2023
FIG. 21 Global Market Positioning of Key Conditional Access Systems Market Manufacturers, 2023
FIG. 22 Global Conditional Access Systems Market Value Contribution, By Type of Conditional Access Systems, 2023 & 2032 (Value %)
FIG. 23 Global Conditional Access Systems Market, by Smart Card-Based CAS, Value, 2019-2032 (US$ Mn)
FIG. 24 Global Conditional Access Systems Market, by Cardless CAS, Value, 2019-2032 (US$ Mn)
FIG. 25 Global Conditional Access Systems Market Value Contribution, By Applications, 2023 & 2032 (Value %)
FIG. 26 Global Conditional Access Systems Market, by IPTV Service Providers Broadcasting, Value, 2019-2032 (US$ Mn)
FIG. 27 Global Conditional Access Systems Market, by Internet Protocol IPTV Service Providers (IPTV), Value, 2019-2032 (US$ Mn)
FIG. 28 Global Conditional Access Systems Market, by Digital Radio Broadcasting, Value, 2019-2032 (US$ Mn)
FIG. 29 Global Conditional Access Systems Market Value Contribution, By End-User, 2023 & 2032 (Value %)
FIG. 30 Global Conditional Access Systems Market, by Broadcasters and Content Providers, Value, 2019-2032 (US$ Mn)
FIG. 31 Global Conditional Access Systems Market, by Cable Television Operators, Value, 2019-2032 (US$ Mn)
FIG. 32 Global Conditional Access Systems Market, by Satellite Television Operators, Value, 2019-2032 (US$ Mn)
FIG. 33 Global Conditional Access Systems Market, by IPTV Service Providers, Value, 2019-2032 (US$ Mn)
FIG. 34 Global Conditional Access Systems Market, by Digital Terrestrial Television (DTT) Operators, Value, 2019-2032 (US$ Mn)
FIG. 35 Global Conditional Access Systems Market Value Contribution, By Security Levels, 2023 & 2032 (Value %)
FIG. 36 Global Conditional Access Systems Market, by Basic Encryption, Value, 2019-2032 (US$ Mn)
FIG. 37 Global Conditional Access Systems Market, by Advanced Encryption Standards (AES), Value, 2019-2032 (US$ Mn)
FIG. 38 Global Conditional Access Systems Market, by Digital Rights Management (DRM), Value, 2019-2032 (US$ Mn)
FIG. 39 Global Conditional Access Systems Market Value Contribution, By Delivery Models, 2023 & 2032 (Value %)
FIG. 40 Global Conditional Access Systems Market, by Hardware-Based CAS, Value, 2019-2032 (US$ Mn)
FIG. 41 Global Conditional Access Systems Market, by Software-Based CAS, Value, 2019-2032 (US$ Mn)
FIG. 42 Global Conditional Access Systems Market Value Contribution, By Integration Levels, 2023 & 2032 (Value %)
FIG. 43 Global Conditional Access Systems Market, by Integrated CAS, Value, 2019-2032 (US$ Mn)
FIG. 44 Global Conditional Access Systems Market, by Middleware Integration, Value, 2019-2032 (US$ Mn)
FIG. 45 Global Conditional Access Systems Market Value Contribution, By Emerging Technologies, 2023 & 2032 (Value %)
FIG. 46 Global Conditional Access Systems Market, by Cloud-Based CAS, Value, 2019-2032 (US$ Mn)
FIG. 47 Global Conditional Access Systems Market, by Advanced Analytics and Reporting, Value, 2019-2032 (US$ Mn)
FIG. 48 North America Conditional Access Systems Market, 2019-2032 (US$ Mn)
FIG. 49 U.S. Conditional Access Systems Market, 2019-2032 (US$ Mn)
FIG. 50 Canada Conditional Access Systems Market, 2019-2032 (US$ Mn)
FIG. 51 Mexico Conditional Access Systems Market, 2019-2032 (US$ Mn)
FIG. 52 Europe Conditional Access Systems Market, 2019-2032 (US$ Mn)
FIG. 53 Germany Conditional Access Systems Market, 2019-2032 (US$ Mn)
FIG. 54 France Conditional Access Systems Market, 2019-2032 (US$ Mn)
FIG. 55 U.K. Conditional Access Systems Market, 2019-2032 (US$ Mn)
FIG. 56 Italy Conditional Access Systems Market, 2019-2032 (US$ Mn)
FIG. 57 Spain Conditional Access Systems Market, 2019-2032 (US$ Mn)
FIG. 58 Benelux Conditional Access Systems Market, 2019-2032 (US$ Mn)
FIG. 59 Russia Conditional Access Systems Market, 2019-2032 (US$ Mn)
FIG. 60 Rest of Europe Conditional Access Systems Market, 2019-2032 (US$ Mn)
FIG. 61 Asia Pacific Conditional Access Systems Market, 2019-2032 (US$ Mn)
FIG. 62 China Conditional Access Systems Market, 2019-2032 (US$ Mn)
FIG. 63 Japan Conditional Access Systems Market, 2019-2032 (US$ Mn)
FIG. 64 India Conditional Access Systems Market, 2019-2032 (US$ Mn)
FIG. 65 South Korea Conditional Access Systems Market, 2019-2032 (US$ Mn)
FIG. 66 South-East Asia Conditional Access Systems Market, 2019-2032 (US$ Mn)
FIG. 67 Rest of Asia Pacific Conditional Access Systems Market, 2019-2032 (US$ Mn)
FIG. 68 Latin America Conditional Access Systems Market, 2019-2032 (US$ Mn)
FIG. 69 Brazil Conditional Access Systems Market, 2019-2032 (US$ Mn)
FIG. 70 Argentina Conditional Access Systems Market, 2019-2032 (US$ Mn)
FIG. 71 Rest of Latin America Conditional Access Systems Market, 2019-2032 (US$ Mn)
FIG. 72 Middle East Conditional Access Systems Market, 2019-2032 (US$ Mn)
FIG. 73 UAE Conditional Access Systems Market, 2019-2032 (US$ Mn)
FIG. 74 Saudi Arabia Conditional Access Systems Market, 2019-2032 (US$ Mn)
FIG. 75 Rest of Middle East Conditional Access Systems Market, 2019-2032 (US$ Mn)
FIG. 76 Africa Conditional Access Systems Market, 2019-2032 (US$ Mn)
FIG. 77 South Africa Conditional Access Systems Market, 2019-2032 (US$ Mn)
FIG. 78 Egypt Conditional Access Systems Market, 2019-2032 (US$ Mn)
FIG. 79 Rest of Africa Conditional Access Systems Market, 2019-2032 (US$ Mn)

List of Tables
TABLE 1 Market Snapshot: Global Conditional Access Systems Market
TABLE 2 Global Conditional Access Systems Market: Market Drivers Impact Analysis
TABLE 3 Global Conditional Access Systems Market: Market Restraints Impact Analysis
TABLE 4 Global Conditional Access Systems Market, by Competitive Benchmarking, 2023
TABLE 5 Global Conditional Access Systems Market, by Geographical Presence Analysis, 2023
TABLE 6 Global Conditional Access Systems Market, by Key Strategies Analysis, 2023
TABLE 7 Global Conditional Access Systems Market, by Smart Card-Based CAS, By Region, 2019-2023 (US$ Mn)
TABLE 8 Global Conditional Access Systems Market, by Smart Card-Based CAS, By Region, 2024-2032 (US$ Mn)
TABLE 9 Global Conditional Access Systems Market, by Cardless CAS, By Region, 2019-2023 (US$ Mn)
TABLE 10 Global Conditional Access Systems Market, by Cardless CAS, By Region, 2024-2032 (US$ Mn)
TABLE 11 Global Conditional Access Systems Market, by Television Broadcasting, By Region, 2019-2023 (US$ Mn)
TABLE 12 Global Conditional Access Systems Market, by Television Broadcasting, By Region, 2024-2032 (US$ Mn)
TABLE 13 Global Conditional Access Systems Market, by Internet Protocol Television (IPTV), By Region, 2019-2023 (US$ Mn)
TABLE 14 Global Conditional Access Systems Market, by Internet Protocol Television (IPTV), By Region, 2024-2032 (US$ Mn)
TABLE 15 Global Conditional Access Systems Market, by Digital Radio Broadcasting, By Region, 2019-2023 (US$ Mn)
TABLE 16 Global Conditional Access Systems Market, by Digital Radio Broadcasting, By Region, 2024-2032 (US$ Mn)
TABLE 17 Global Conditional Access Systems Market, by Broadcasters and Content Providers, By Region, 2019-2023 (US$ Mn)
TABLE 18 Global Conditional Access Systems Market, by Broadcasters and Content Providers, By Region, 2024-2032 (US$ Mn)
TABLE 19 Global Conditional Access Systems Market, by Cable Television Service Providers Operators, By Region, 2019-2023 (US$ Mn)
TABLE 20 Global Conditional Access Systems Market, by Cable Television Service Providers Operators, By Region, 2024-2032 (US$ Mn)
TABLE 21 Global Conditional Access Systems Market, by Satellite Television Service Providers Operators, By Region, 2019-2023 (US$ Mn)
TABLE 22 Global Conditional Access Systems Market, by Satellite Television Service Providers Operators, By Region, 2024-2032 (US$ Mn)
TABLE 23 Global Conditional Access Systems Market, by Digital Terrestrial Television (DTT) Operators, By Region, 2019-2023 (US$ Mn)
TABLE 24 Global Conditional Access Systems Market, by Digital Terrestrial Television (DTT) Operators, By Region, 2024-2032 (US$ Mn)
TABLE 25 Global Conditional Access Systems Market, by Advanced Encryption Standards (AES), By Region, 2019-2023 (US$ Mn)
TABLE 26 Global Conditional Access Systems Market, by Advanced Encryption Standards (AES), By Region, 2024-2032 (US$ Mn)
TABLE 27 Global Conditional Access Systems Market, by Digital Rights Management (DRM), By Region, 2019-2023 (US$ Mn)
TABLE 28 Global Conditional Access Systems Market, by Digital Rights Management (DRM), By Region, 2024-2032 (US$ Mn)
TABLE 29 Global Conditional Access Systems Market, by Hardware-Based CAS, By Region, 2019-2023 (US$ Mn)
TABLE 30 Global Conditional Access Systems Market, by Hardware-Based CAS, By Region, 2024-2032 (US$ Mn)
TABLE 31 Global Conditional Access Systems Market, by Software-Based CAS, By Region, 2019-2023 (US$ Mn)
TABLE 32 Global Conditional Access Systems Market, by Software-Based CAS, By Region, 2024-2032 (US$ Mn)
TABLE 33 Global Conditional Access Systems Market, by Integrated CAS, By Region, 2019-2023 (US$ Mn)
TABLE 34 Global Conditional Access Systems Market, by Integrated CAS, By Region, 2024-2032 (US$ Mn)
TABLE 35 Global Conditional Access Systems Market, by Middleware Integration, By Region, 2019-2023 (US$ Mn)
TABLE 36 Global Conditional Access Systems Market, by Middleware Integration, By Region, 2024-2032 (US$ Mn)
TABLE 37 Global Conditional Access Systems Market, by Cloud-Based CAS, By Region, 2019-2023 (US$ Mn)
TABLE 38 Global Conditional Access Systems Market, by Cloud-Based CAS, By Region, 2024-2032 (US$ Mn)
TABLE 39 Global Conditional Access Systems Market, by Advanced Analytics and Reporting, By Region, 2019-2023 (US$ Mn)
TABLE 40 Global Conditional Access Systems Market, by Advanced Analytics and Reporting, By Region, 2024-2032 (US$ Mn)
TABLE 41 Global Conditional Access Systems Market, by Type of Conditional Access Systems, 2019-2023 (US$ Mn)
TABLE 42 Global Conditional Access Systems Market, by Type of Conditional Access Systems, 2024-2032 (US$ Mn)
TABLE 43 Global Conditional Access Systems Market, by Applications, 2019-2023 (US$ Mn)
TABLE 44 Global Conditional Access Systems Market, by Applications, 2024-2032 (US$ Mn)
TABLE 45 Global Conditional Access Systems Market, by End-User, 2019-2023 (US$ Mn)
TABLE 46 Global Conditional Access Systems Market, by End-User, 2024-2032 (US$ Mn)
TABLE 47 Global Conditional Access Systems Market, by Security Levels, By Region, 2019-2023 (US$ Mn)
TABLE 48 Global Conditional Access Systems Market, by Security Levels, By Region, 2024-2032 (US$ Mn)
TABLE 49 Global Conditional Access Systems Market, by Delivery Models, 2019-2023 (US$ Mn)
TABLE 50 Global Conditional Access Systems Market, by Delivery Models, 2024-2032 (US$ Mn)
TABLE 51 Global Conditional Access Systems Market, by Integration Levels, 2019-2023 (US$ Mn)
TABLE 52 Global Conditional Access Systems Market, by Integration Levels, 2024-2032 (US$ Mn)
TABLE 53 Global Conditional Access Systems Market, by Emerging Technologies, 2019-2023 (US$ Mn)
TABLE 54 Global Conditional Access Systems Market, by Emerging Technologies, 2024-2032 (US$ Mn)
TABLE 55 Global Conditional Access Systems Market, by Region, 2019-2023 (US$ Mn)
TABLE 56 Global Conditional Access Systems Market, by Region, 2024-2032 (US$ Mn)
TABLE 57 North America Conditional Access Systems Market, by Type of Conditional Access Systems, 2019-2023 (US$ Mn)
TABLE 58 North America Conditional Access Systems Market, by Type of Conditional Access Systems, 2024-2032 (US$ Mn)
TABLE 59 North America Conditional Access Systems Market, by Applications, 2019-2023 (US$ Mn)
TABLE 60 North America Conditional Access Systems Market, by Applications, 2024-2032 (US$ Mn)
TABLE 61 North America Conditional Access Systems Market, by End-User, 2019-2023 (US$ Mn)
TABLE 62 North America Conditional Access Systems Market, by End-User, 2024-2032 (US$ Mn)
TABLE 63 North America Conditional Access Systems Market, by Security Levels, By Region, 2019-2023 (US$ Mn)
TABLE 64 North America Conditional Access Systems Market, by Security Levels, By Region, 2024-2032 (US$ Mn)
TABLE 65 North America Conditional Access Systems Market, by Delivery Models, 2019-2023 (US$ Mn)
TABLE 66 North America Conditional Access Systems Market, by Delivery Models, 2024-2032 (US$ Mn)
TABLE 67 North America Conditional Access Systems Market, by Integration Levels, 2019-2023 (US$ Mn)
TABLE 68 North America Conditional Access Systems Market, by Integration Levels, 2024-2032 (US$ Mn)
TABLE 69 North America Conditional Access Systems Market, by Emerging Technologies, 2019-2023 (US$ Mn)
TABLE 70 North America Conditional Access Systems Market, by Emerging Technologies, 2024-2032 (US$ Mn)
TABLE 71 North America Conditional Access Systems Market, by Country, 2019-2023 (US$ Mn)
TABLE 72 North America Conditional Access Systems Market, by Country, 2024-2032 (US$ Mn)
TABLE 73 United States Conditional Access Systems Market, by Type of Conditional Access Systems, 2019-2023 (US$ Mn)
TABLE 74 United States Conditional Access Systems Market, by Type of Conditional Access Systems, 2024-2032 (US$ Mn)
TABLE 75 United States Conditional Access Systems Market, by Applications, 2019-2023 (US$ Mn)
TABLE 76 United States Conditional Access Systems Market, by Applications, 2024-2032 (US$ Mn)
TABLE 77 United States Conditional Access Systems Market, by End-User, 2019-2023 (US$ Mn)
TABLE 78 United States Conditional Access Systems Market, by End-User, 2024-2032 (US$ Mn)
TABLE 79 United States Conditional Access Systems Market, by Security Levels, By Region, 2019-2023 (US$ Mn)
TABLE 80 United States Conditional Access Systems Market, by Security Levels, By Region, 2024-2032 (US$ Mn)
TABLE 81 United States Conditional Access Systems Market, by Delivery Models, 2019-2023 (US$ Mn)
TABLE 82 United States Conditional Access Systems Market, by Delivery Models, 2024-2032 (US$ Mn)
TABLE 83 United States Conditional Access Systems Market, by Integration Levels, 2019-2023 (US$ Mn)
TABLE 84 United States Conditional Access Systems Market, by Integration Levels, 2024-2032 (US$ Mn)
TABLE 85 United States Conditional Access Systems Market, by Emerging Technologies, 2019-2023 (US$ Mn)
TABLE 86 United States Conditional Access Systems Market, by Emerging Technologies, 2024-2032 (US$ Mn)
TABLE 87 Canada Conditional Access Systems Market, by Type of Conditional Access Systems, 2019-2023 (US$ Mn)
TABLE 88 Canada Conditional Access Systems Market, by Type of Conditional Access Systems, 2024-2032 (US$ Mn)
TABLE 89 Canada Conditional Access Systems Market, by Applications, 2019-2023 (US$ Mn)
TABLE 90 Canada Conditional Access Systems Market, by Applications, 2024-2032 (US$ Mn)
TABLE 91 Canada Conditional Access Systems Market, by End-User, 2019-2023 (US$ Mn)
TABLE 92 Canada Conditional Access Systems Market, by End-User, 2024-2032 (US$ Mn)
TABLE 93 Canada Conditional Access Systems Market, by Security Levels, By Region, 2019-2023 (US$ Mn)
TABLE 94 Canada Conditional Access Systems Market, by Security Levels, By Region, 2024-2032 (US$ Mn)
TABLE 95 Canada Conditional Access Systems Market, by Delivery Models, 2019-2023 (US$ Mn)
TABLE 96 Canada Conditional Access Systems Market, by Delivery Models, 2024-2032 (US$ Mn)
TABLE 97 Canada Conditional Access Systems Market, by Integration Levels, 2019-2023 (US$ Mn)
TABLE 98 Canada Conditional Access Systems Market, by Integration Levels, 2024-2032 (US$ Mn)
TABLE 99 Canada Conditional Access Systems Market, by Emerging Technologies, 2019-2023 (US$ Mn)
TABLE 100 Canada Conditional Access Systems Market, by Emerging Technologies, 2024-2032 (US$ Mn)
TABLE 101 Mexico Conditional Access Systems Market, by Type of Conditional Access Systems, 2019-2023 (US$ Mn)
TABLE 102 Mexico Conditional Access Systems Market, by Type of Conditional Access Systems, 2024-2032 (US$ Mn)
TABLE 103 Mexico Conditional Access Systems Market, by Applications, 2019-2023 (US$ Mn)
TABLE 104 Mexico Conditional Access Systems Market, by Applications, 2024-2032 (US$ Mn)
TABLE 105 Mexico Conditional Access Systems Market, by End-User, 2019-2023 (US$ Mn)
TABLE 106 Mexico Conditional Access Systems Market, by End-User, 2024-2032 (US$ Mn)
TABLE 107 Mexico Conditional Access Systems Market, by Security Levels, By Region, 2019-2023 (US$ Mn)
TABLE 108 Mexico Conditional Access Systems Market, by Security Levels, By Region, 2024-2032 (US$ Mn)
TABLE 109 Mexico Conditional Access Systems Market, by Delivery Models, 2019-2023 (US$ Mn)
TABLE 110 Mexico Conditional Access Systems Market, by Delivery Models, 2024-2032 (US$ Mn)
TABLE 111 Mexico Conditional Access Systems Market, by Integration Levels, 2019-2023 (US$ Mn)
TABLE 112 Mexico Conditional Access Systems Market, by Integration Levels, 2024-2032 (US$ Mn)
TABLE 113 Mexico Conditional Access Systems Market, by Emerging Technologies, 2019-2023 (US$ Mn)
TABLE 114 Mexico Conditional Access Systems Market, by Emerging Technologies, 2024-2032 (US$ Mn)
TABLE 115 Europe Conditional Access Systems Market, by Type of Conditional Access Systems, 2019-2023 (US$ Mn)
TABLE 116 Europe Conditional Access Systems Market, by Type of Conditional Access Systems, 2024-2032 (US$ Mn)
TABLE 117 Europe Conditional Access Systems Market, by Applications, 2019-2023 (US$ Mn)
TABLE 118 Europe Conditional Access Systems Market, by Applications, 2024-2032 (US$ Mn)
TABLE 119 Europe Conditional Access Systems Market, by End-User, 2019-2023 (US$ Mn)
TABLE 120 Europe Conditional Access Systems Market, by End-User, 2024-2032 (US$ Mn)
TABLE 121 Europe Conditional Access Systems Market, by Security Levels, By Region, 2019-2023 (US$ Mn)
TABLE 122 Europe Conditional Access Systems Market, by Security Levels, By Region, 2024-2032 (US$ Mn)
TABLE 123 Europe Conditional Access Systems Market, by Delivery Models, 2019-2023 (US$ Mn)
TABLE 124 Europe Conditional Access Systems Market, by Delivery Models, 2024-2032 (US$ Mn)
TABLE 125 Europe Conditional Access Systems Market, by Integration Levels, 2019-2023 (US$ Mn)
TABLE 126 Europe Conditional Access Systems Market, by Integration Levels, 2024-2032 (US$ Mn)
TABLE 127 Europe Conditional Access Systems Market, by Emerging Technologies, 2019-2023 (US$ Mn)
TABLE 128 Europe Conditional Access Systems Market, by Emerging Technologies, 2024-2032 (US$ Mn)
TABLE 129 Europe Conditional Access Systems Market, by Country, 2019-2023 (US$ Mn)
TABLE 130 Europe Conditional Access Systems Market, by Country, 2024-2032 (US$ Mn)
TABLE 131 Germany Conditional Access Systems Market, by Type of Conditional Access Systems, 2019-2023 (US$ Mn)
TABLE 132 Germany Conditional Access Systems Market, by Type of Conditional Access Systems, 2024-2032 (US$ Mn)
TABLE 133 Germany Conditional Access Systems Market, by Applications, 2019-2023 (US$ Mn)
TABLE 134 Germany Conditional Access Systems Market, by Applications, 2024-2032 (US$ Mn)
TABLE 135 Germany Conditional Access Systems Market, by End-User, 2019-2023 (US$ Mn)
TABLE 136 Germany Conditional Access Systems Market, by End-User, 2024-2032 (US$ Mn)
TABLE 137 Germany Conditional Access Systems Market, by Security Levels, By Region, 2019-2023 (US$ Mn)
TABLE 138 Germany Conditional Access Systems Market, by Security Levels, By Region, 2024-2032 (US$ Mn)
TABLE 139 Germany Conditional Access Systems Market, by Delivery Models, 2019-2023 (US$ Mn)
TABLE 140 Germany Conditional Access Systems Market, by Delivery Models, 2024-2032 (US$ Mn)
TABLE 141 Germany Conditional Access Systems Market, by Integration Levels, 2019-2023 (US$ Mn)
TABLE 142 Germany Conditional Access Systems Market, by Integration Levels, 2024-2032 (US$ Mn)
TABLE 143 Germany Conditional Access Systems Market, by Emerging Technologies, 2019-2023 (US$ Mn)
TABLE 144 Germany Conditional Access Systems Market, by Emerging Technologies, 2024-2032 (US$ Mn)
TABLE 145 France Conditional Access Systems Market, by Type of Conditional Access Systems, 2019-2023 (US$ Mn)
TABLE 146 France Conditional Access Systems Market, by Type of Conditional Access Systems, 2024-2032 (US$ Mn)
TABLE 147 France Conditional Access Systems Market, by Applications, 2019-2023 (US$ Mn)
TABLE 148 France Conditional Access Systems Market, by Applications, 2024-2032 (US$ Mn)
TABLE 149 France Conditional Access Systems Market, by End-User, 2019-2023 (US$ Mn)
TABLE 150 France Conditional Access Systems Market, by End-User, 2024-2032 (US$ Mn)
TABLE 151 France Conditional Access Systems Market, by Security Levels, By Region, 2019-2023 (US$ Mn)
TABLE 152 France Conditional Access Systems Market, by Security Levels, By Region, 2024-2032 (US$ Mn)
TABLE 153 France Conditional Access Systems Market, by Delivery Models, 2019-2023 (US$ Mn)
TABLE 154 France Conditional Access Systems Market, by Delivery Models, 2024-2032 (US$ Mn)
TABLE 155 France Conditional Access Systems Market, by Integration Levels, 2019-2023 (US$ Mn)
TABLE 156 France Conditional Access Systems Market, by Integration Levels, 2024-2032 (US$ Mn)
TABLE 157 France Conditional Access Systems Market, by Emerging Technologies, 2019-2023 (US$ Mn)
TABLE 158 France Conditional Access Systems Market, by Emerging Technologies, 2024-2032 (US$ Mn)
TABLE 159 United Kingdom Conditional Access Systems Market, by Type of Conditional Access Systems, 2019-2023 (US$ Mn)
TABLE 160 United Kingdom Conditional Access Systems Market, by Type of Conditional Access Systems, 2024-2032 (US$ Mn)
TABLE 161 United Kingdom Conditional Access Systems Market, by Applications, 2019-2023 (US$ Mn)
TABLE 162 United Kingdom Conditional Access Systems Market, by Applications, 2024-2032 (US$ Mn)
TABLE 163 United Kingdom Conditional Access Systems Market, by End-User, 2019-2023 (US$ Mn)
TABLE 164 United Kingdom Conditional Access Systems Market, by End-User, 2024-2032 (US$ Mn)
TABLE 165 United Kingdom Conditional Access Systems Market, by Security Levels, By Region, 2019-2023 (US$ Mn)
TABLE 166 United Kingdom Conditional Access Systems Market, by Security Levels, By Region, 2024-2032 (US$ Mn)
TABLE 167 United Kingdom Conditional Access Systems Market, by Delivery Models, 2019-2023 (US$ Mn)
TABLE 168 United Kingdom Conditional Access Systems Market, by Delivery Models, 2024-2032 (US$ Mn)
TABLE 169 United Kingdom Conditional Access Systems Market, by Integration Levels, 2019-2023 (US$ Mn)
TABLE 170 United Kingdom Conditional Access Systems Market, by Integration Levels, 2024-2032 (US$ Mn)
TABLE 171 United Kingdom Conditional Access Systems Market, by Emerging Technologies, 2019-2023 (US$ Mn)
TABLE 172 United Kingdom Conditional Access Systems Market, by Emerging Technologies, 2024-2032 (US$ Mn)
TABLE 173 Italy Conditional Access Systems Market, by Type of Conditional Access Systems, 2019-2023 (US$ Mn)
TABLE 174 Italy Conditional Access Systems Market, by Type of Conditional Access Systems, 2024-2032 (US$ Mn)
TABLE 175 Italy Conditional Access Systems Market, by Applications, 2019-2023 (US$ Mn)
TABLE 176 Italy Conditional Access Systems Market, by Applications, 2024-2032 (US$ Mn)
TABLE 177 Italy Conditional Access Systems Market, by End-User, 2019-2023 (US$ Mn)
TABLE 178 Italy Conditional Access Systems Market, by End-User, 2024-2032 (US$ Mn)
TABLE 179 Italy Conditional Access Systems Market, by Security Levels, By Region, 2019-2023 (US$ Mn)
TABLE 180 Italy Conditional Access Systems Market, by Security Levels, By Region, 2024-2032 (US$ Mn)
TABLE 181 Italy Conditional Access Systems Market, by Delivery Models, 2019-2023 (US$ Mn)
TABLE 182 Italy Conditional Access Systems Market, by Delivery Models, 2024-2032 (US$ Mn)
TABLE 183 Italy Conditional Access Systems Market, by Integration Levels, 2019-2023 (US$ Mn)
TABLE 184 Italy Conditional Access Systems Market, by Integration Levels, 2024-2032 (US$ Mn)
TABLE 185 Italy Conditional Access Systems Market, by Emerging Technologies, 2019-2023 (US$ Mn)
TABLE 186 Italy Conditional Access Systems Market, by Emerging Technologies, 2024-2032 (US$ Mn)
TABLE 187 Spain Conditional Access Systems Market, by Type of Conditional Access Systems, 2019-2023 (US$ Mn)
TABLE 188 Spain Conditional Access Systems Market, by Type of Conditional Access Systems, 2024-2032 (US$ Mn)
TABLE 189 Spain Conditional Access Systems Market, by Applications, 2019-2023 (US$ Mn)
TABLE 190 Spain Conditional Access Systems Market, by Applications, 2024-2032 (US$ Mn)
TABLE 191 Spain Conditional Access Systems Market, by End-User, 2019-2023 (US$ Mn)
TABLE 192 Spain Conditional Access Systems Market, by End-User, 2024-2032 (US$ Mn)
TABLE 193 Spain Conditional Access Systems Market, by Security Levels, By Region, 2019-2023 (US$ Mn)
TABLE 194 Spain Conditional Access Systems Market, by Security Levels, By Region, 2024-2032 (US$ Mn)
TABLE 195 Spain Conditional Access Systems Market, by Delivery Models, 2019-2023 (US$ Mn)
TABLE 196 Spain Conditional Access Systems Market, by Delivery Models, 2024-2032 (US$ Mn)
TABLE 197 Spain Conditional Access Systems Market, by Integration Levels, 2019-2023 (US$ Mn)
TABLE 198 Spain Conditional Access Systems Market, by Integration Levels, 2024-2032 (US$ Mn)
TABLE 199 Spain Conditional Access Systems Market, by Emerging Technologies, 2019-2023 (US$ Mn)
TABLE 200 Spain Conditional Access Systems Market, by Emerging Technologies, 2024-2032 (US$ Mn)
TABLE 201 Benelux Conditional Access Systems Market, by Type of Conditional Access Systems, 2019-2023 (US$ Mn)
TABLE 202 Benelux Conditional Access Systems Market, by Type of Conditional Access Systems, 2024-2032 (US$ Mn)
TABLE 203 Benelux Conditional Access Systems Market, by Applications, 2019-2023 (US$ Mn)
TABLE 204 Benelux Conditional Access Systems Market, by Applications, 2024-2032 (US$ Mn)
TABLE 205 Benelux Conditional Access Systems Market, by End-User, 2019-2023 (US$ Mn)
TABLE 206 Benelux Conditional Access Systems Market, by End-User, 2024-2032 (US$ Mn)
TABLE 207 Benelux Conditional Access Systems Market, by Security Levels, By Region, 2019-2023 (US$ Mn)
TABLE 208 Benelux Conditional Access Systems Market, by Security Levels, By Region, 2024-2032 (US$ Mn)
TABLE 209 Benelux Conditional Access Systems Market, by Delivery Models, 2019-2023 (US$ Mn)
TABLE 210 Benelux Conditional Access Systems Market, by Delivery Models, 2024-2032 (US$ Mn)
TABLE 211 Benelux Conditional Access Systems Market, by Integration Levels, 2019-2023 (US$ Mn)
TABLE 212 Benelux Conditional Access Systems Market, by Integration Levels, 2024-2032 (US$ Mn)
TABLE 213 Benelux Conditional Access Systems Market, by Emerging Technologies, 2019-2023 (US$ Mn)
TABLE 214 Benelux Conditional Access Systems Market, by Emerging Technologies, 2024-2032 (US$ Mn)
TABLE 215 Russia Conditional Access Systems Market, by Type of Conditional Access Systems, 2019-2023 (US$ Mn)
TABLE 216 Russia Conditional Access Systems Market, by Type of Conditional Access Systems, 2024-2032 (US$ Mn)
TABLE 217 Russia Conditional Access Systems Market, by Applications, 2019-2023 (US$ Mn)
TABLE 218 Russia Conditional Access Systems Market, by Applications, 2024-2032 (US$ Mn)
TABLE 219 Russia Conditional Access Systems Market, by End-User, 2019-2023 (US$ Mn)
TABLE 220 Russia Conditional Access Systems Market, by End-User, 2024-2032 (US$ Mn)
TABLE 221 Russia Conditional Access Systems Market, by Security Levels, By Region, 2019-2023 (US$ Mn)
TABLE 222 Russia Conditional Access Systems Market, by Security Levels, By Region, 2024-2032 (US$ Mn)
TABLE 223 Russia Conditional Access Systems Market, by Delivery Models, 2019-2023 (US$ Mn)
TABLE 224 Russia Conditional Access Systems Market, by Delivery Models, 2024-2032 (US$ Mn)
TABLE 225 Russia Conditional Access Systems Market, by Integration Levels, 2019-2023 (US$ Mn)
TABLE 226 Russia Conditional Access Systems Market, by Integration Levels, 2024-2032 (US$ Mn)
TABLE 227 Russia Conditional Access Systems Market, by Emerging Technologies, 2019-2023 (US$ Mn)
TABLE 228 Russia Conditional Access Systems Market, by Emerging Technologies, 2024-2032 (US$ Mn)
TABLE 229 Rest of Europe Conditional Access Systems Market, by Type of Conditional Access Systems, 2019-2023 (US$ Mn)
TABLE 230 Rest of Europe Conditional Access Systems Market, by Type of Conditional Access Systems, 2024-2032 (US$ Mn)
TABLE 231 Rest of Europe Conditional Access Systems Market, by Applications, 2019-2023 (US$ Mn)
TABLE 232 Rest of Europe Conditional Access Systems Market, by Applications, 2024-2032 (US$ Mn)
TABLE 233 Rest of Europe Conditional Access Systems Market, by End-User, 2019-2023 (US$ Mn)
TABLE 234 Rest of Europe Conditional Access Systems Market, by End-User, 2024-2032 (US$ Mn)
TABLE 235 Rest of Europe Conditional Access Systems Market, by Security Levels, By Region, 2019-2023 (US$ Mn)
TABLE 236 Rest of Europe Conditional Access Systems Market, by Security Levels, By Region, 2024-2032 (US$ Mn)
TABLE 237 Rest of Europe Conditional Access Systems Market, by Delivery Models, 2019-2023 (US$ Mn)
TABLE 238 Rest of Europe Conditional Access Systems Market, by Delivery Models, 2024-2032 (US$ Mn)
TABLE 239 Rest of Europe Conditional Access Systems Market, by Integration Levels, 2019-2023 (US$ Mn)
TABLE 240 Rest of Europe Conditional Access Systems Market, by Integration Levels, 2024-2032 (US$ Mn)
TABLE 241 Rest of Europe Conditional Access Systems Market, by Emerging Technologies, 2019-2023 (US$ Mn)
TABLE 242 Rest of Europe Conditional Access Systems Market, by Emerging Technologies, 2024-2032 (US$ Mn)
TABLE 243 Asia Pacific Conditional Access Systems Market, by Type of Conditional Access Systems, 2019-2023 (US$ Mn)
TABLE 244 Asia Pacific Conditional Access Systems Market, by Type of Conditional Access Systems, 2024-2032 (US$ Mn)
TABLE 245 Asia Pacific Conditional Access Systems Market, by Applications, 2019-2023 (US$ Mn)
TABLE 246 Asia Pacific Conditional Access Systems Market, by Applications, 2024-2032 (US$ Mn)
TABLE 247 Asia Pacific Conditional Access Systems Market, by End-User, 2019-2023 (US$ Mn)
TABLE 248 Asia Pacific Conditional Access Systems Market, by End-User, 2024-2032 (US$ Mn)
TABLE 249 Asia Pacific Conditional Access Systems Market, by Security Levels, By Region, 2019-2023 (US$ Mn)
TABLE 250 Asia Pacific Conditional Access Systems Market, by Security Levels, By Region, 2024-2032 (US$ Mn)
TABLE 251 Asia Pacific Conditional Access Systems Market, by Delivery Models, 2019-2023 (US$ Mn)
TABLE 252 Asia Pacific Conditional Access Systems Market, by Delivery Models, 2024-2032 (US$ Mn)
TABLE 253 Asia Pacific Conditional Access Systems Market, by Integration Levels, 2019-2023 (US$ Mn)
TABLE 254 Asia Pacific Conditional Access Systems Market, by Integration Levels, 2024-2032 (US$ Mn)
TABLE 255 Asia Pacific Conditional Access Systems Market, by Emerging Technologies, 2019-2023 (US$ Mn)
TABLE 256 Asia Pacific Conditional Access Systems Market, by Emerging Technologies, 2024-2032 (US$ Mn)
TABLE 257 China Conditional Access Systems Market, by Type of Conditional Access Systems, 2019-2023 (US$ Mn)
TABLE 258 China Conditional Access Systems Market, by Type of Conditional Access Systems, 2024-2032 (US$ Mn)
TABLE 259 China Conditional Access Systems Market, by Applications, 2019-2023 (US$ Mn)
TABLE 260 China Conditional Access Systems Market, by Applications, 2024-2032 (US$ Mn)
TABLE 261 China Conditional Access Systems Market, by End-User, 2019-2023 (US$ Mn)
TABLE 262 China Conditional Access Systems Market, by End-User, 2024-2032 (US$ Mn)
TABLE 263 China Conditional Access Systems Market, by Security Levels, By Region, 2019-2023 (US$ Mn)
TABLE 264 China Conditional Access Systems Market, by Security Levels, By Region, 2024-2032 (US$ Mn)
TABLE 265 China Conditional Access Systems Market, by Delivery Models, 2019-2023 (US$ Mn)
TABLE 266 China Conditional Access Systems Market, by Delivery Models, 2024-2032 (US$ Mn)
TABLE 267 China Conditional Access Systems Market, by Integration Levels, 2019-2023 (US$ Mn)
TABLE 268 China Conditional Access Systems Market, by Integration Levels, 2024-2032 (US$ Mn)
TABLE 269 China Conditional Access Systems Market, by Emerging Technologies, 2019-2023 (US$ Mn)
TABLE 270 China Conditional Access Systems Market, by Emerging Technologies, 2024-2032 (US$ Mn)
TABLE 271 Japan Conditional Access Systems Market, by Type of Conditional Access Systems, 2019-2023 (US$ Mn)
TABLE 272 Japan Conditional Access Systems Market, by Type of Conditional Access Systems, 2024-2032 (US$ Mn)
TABLE 273 Japan Conditional Access Systems Market, by Applications, 2019-2023 (US$ Mn)
TABLE 274 Japan Conditional Access Systems Market, by Applications, 2024-2032 (US$ Mn)
TABLE 275 Japan Conditional Access Systems Market, by End-User, 2019-2023 (US$ Mn)
TABLE 276 Japan Conditional Access Systems Market, by End-User, 2024-2032 (US$ Mn)
TABLE 277 Japan Conditional Access Systems Market, by Security Levels, By Region, 2019-2023 (US$ Mn)
TABLE 278 Japan Conditional Access Systems Market, by Security Levels, By Region, 2024-2032 (US$ Mn)
TABLE 279 Japan Conditional Access Systems Market, by Delivery Models, 2019-2023 (US$ Mn)
TABLE 280 Japan Conditional Access Systems Market, by Delivery Models, 2024-2032 (US$ Mn)
TABLE 281 Japan Conditional Access Systems Market, by Integration Levels, 2019-2023 (US$ Mn)
TABLE 282 Japan Conditional Access Systems Market, by Integration Levels, 2024-2032 (US$ Mn)
TABLE 283 Japan Conditional Access Systems Market, by Emerging Technologies, 2019-2023 (US$ Mn)
TABLE 284 Japan Conditional Access Systems Market, by Emerging Technologies, 2024-2032 (US$ Mn)
TABLE 285 India Conditional Access Systems Market, by Type of Conditional Access Systems, 2019-2023 (US$ Mn)
TABLE 286 India Conditional Access Systems Market, by Type of Conditional Access Systems, 2024-2032 (US$ Mn)
TABLE 287 India Conditional Access Systems Market, by Applications, 2019-2023 (US$ Mn)
TABLE 288 India Conditional Access Systems Market, by Applications, 2024-2032 (US$ Mn)
TABLE 289 India Conditional Access Systems Market, by End-User, 2019-2023 (US$ Mn)
TABLE 290 India Conditional Access Systems Market, by End-User, 2024-2032 (US$ Mn)
TABLE 291 India Conditional Access Systems Market, by Security Levels, By Region, 2019-2023 (US$ Mn)
TABLE 292 India Conditional Access Systems Market, by Security Levels, By Region, 2024-2032 (US$ Mn)
TABLE 293 India Conditional Access Systems Market, by Delivery Models, 2019-2023 (US$ Mn)
TABLE 294 India Conditional Access Systems Market, by Delivery Models, 2024-2032 (US$ Mn)
TABLE 295 India Conditional Access Systems Market, by Integration Levels, 2019-2023 (US$ Mn)
TABLE 296 India Conditional Access Systems Market, by Integration Levels, 2024-2032 (US$ Mn)
TABLE 297 India Conditional Access Systems Market, by Emerging Technologies, 2019-2023 (US$ Mn)
TABLE 298 India Conditional Access Systems Market, by Emerging Technologies, 2024-2032 (US$ Mn)
TABLE 299 South Korea Conditional Access Systems Market, by Type of Conditional Access Systems, 2019-2023 (US$ Mn)
TABLE 300 South Korea Conditional Access Systems Market, by Type of Conditional Access Systems, 2024-2032 (US$ Mn)
TABLE 301 South Korea Conditional Access Systems Market, by Applications, 2019-2023 (US$ Mn)
TABLE 302 South Korea Conditional Access Systems Market, by Applications, 2024-2032 (US$ Mn)
TABLE 303 South Korea Conditional Access Systems Market, by End-User, 2019-2023 (US$ Mn)
TABLE 304 South Korea Conditional Access Systems Market, by End-User, 2024-2032 (US$ Mn)
TABLE 305 South Korea Conditional Access Systems Market, by Security Levels, By Region, 2019-2023 (US$ Mn)
TABLE 306 South Korea Conditional Access Systems Market, by Security Levels, By Region, 2024-2032 (US$ Mn)
TABLE 307 South Korea Conditional Access Systems Market, by Delivery Models, 2019-2023 (US$ Mn)
TABLE 308 South Korea Conditional Access Systems Market, by Delivery Models, 2024-2032 (US$ Mn)
TABLE 309 South Korea Conditional Access Systems Market, by Integration Levels, 2019-2023 (US$ Mn)
TABLE 310 South Korea Conditional Access Systems Market, by Integration Levels, 2024-2032 (US$ Mn)
TABLE 311 South Korea Conditional Access Systems Market, by Emerging Technologies, 2019-2023 (US$ Mn)
TABLE 312 South Korea Conditional Access Systems Market, by Emerging Technologies, 2024-2032 (US$ Mn)
TABLE 313 South-East Asia Conditional Access Systems Market, by Type of Conditional Access Systems, 2019-2023 (US$ Mn)
TABLE 314 South-East Asia Conditional Access Systems Market, by Type of Conditional Access Systems, 2024-2032 (US$ Mn)
TABLE 315 South-East Asia Conditional Access Systems Market, by Applications, 2019-2023 (US$ Mn)
TABLE 316 South-East Asia Conditional Access Systems Market, by Applications, 2024-2032 (US$ Mn)
TABLE 317 South-East Asia Conditional Access Systems Market, by End-User, 2019-2023 (US$ Mn)
TABLE 318 South-East Asia Conditional Access Systems Market, by End-User, 2024-2032 (US$ Mn)
TABLE 319 South-East Asia Conditional Access Systems Market, by Security Levels, By Region, 2019-2023 (US$ Mn)
TABLE 320 South-East Asia Conditional Access Systems Market, by Security Levels, By Region, 2024-2032 (US$ Mn)
TABLE 321 South-East Asia Conditional Access Systems Market, by Delivery Models, 2019-2023 (US$ Mn)
TABLE 322 South-East Asia Conditional Access Systems Market, by Delivery Models, 2024-2032 (US$ Mn)
TABLE 323 South-East Asia Conditional Access Systems Market, by Integration Levels, 2019-2023 (US$ Mn)
TABLE 324 South-East Asia Conditional Access Systems Market, by Integration Levels, 2024-2032 (US$ Mn)
TABLE 325 South-East Asia Conditional Access Systems Market, by Emerging Technologies, 2019-2023 (US$ Mn)
TABLE 326 South-East Asia Conditional Access Systems Market, by Emerging Technologies, 2024-2032 (US$ Mn)
TABLE 327 Rest of Asia Pacific Conditional Access Systems Market, by Type of Conditional Access Systems, 2019-2023 (US$ Mn)
TABLE 328 Rest of Asia Pacific Conditional Access Systems Market, by Type of Conditional Access Systems, 2024-2032 (US$ Mn)
TABLE 329 Rest of Asia Pacific Conditional Access Systems Market, by Applications, 2019-2023 (US$ Mn)
TABLE 330 Rest of Asia Pacific Conditional Access Systems Market, by Applications, 2024-2032 (US$ Mn)
TABLE 331 Rest of Asia Pacific Conditional Access Systems Market, by End-User, 2019-2023 (US$ Mn)
TABLE 332 Rest of Asia Pacific Conditional Access Systems Market, by End-User, 2024-2032 (US$ Mn)
TABLE 333 Rest of Asia Pacific Conditional Access Systems Market, by Security Levels, By Region, 2019-2023 (US$ Mn)
TABLE 334 Rest of Asia Pacific Conditional Access Systems Market, by Security Levels, By Region, 2024-2032 (US$ Mn)
TABLE 335 Rest of Asia Pacific Conditional Access Systems Market, by Delivery Models, 2019-2023 (US$ Mn)
TABLE 336 Rest of Asia Pacific Conditional Access Systems Market, by Delivery Models, 2024-2032 (US$ Mn)
TABLE 337 Rest of Asia Pacific Conditional Access Systems Market, by Integration Levels, 2019-2023 (US$ Mn)
TABLE 338 Rest of Asia Pacific Conditional Access Systems Market, by Integration Levels, 2024-2032 (US$ Mn)
TABLE 339 Rest of Asia Pacific Conditional Access Systems Market, by Emerging Technologies, 2019-2023 (US$ Mn)
TABLE 340 Rest of Asia Pacific Conditional Access Systems Market, by Emerging Technologies, 2024-2032 (US$ Mn)
TABLE 341 Latin America Conditional Access Systems Market, by Type of Conditional Access Systems, 2019-2023 (US$ Mn)
TABLE 342 Latin America Conditional Access Systems Market, by Type of Conditional Access Systems, 2024-2032 (US$ Mn)
TABLE 343 Latin America Conditional Access Systems Market, by Applications, 2019-2023 (US$ Mn)
TABLE 344 Latin America Conditional Access Systems Market, by Applications, 2024-2032 (US$ Mn)
TABLE 345 Latin America Conditional Access Systems Market, by End-User, 2019-2023 (US$ Mn)
TABLE 346 Latin America Conditional Access Systems Market, by End-User, 2024-2032 (US$ Mn)
TABLE 347 Latin America Conditional Access Systems Market, by Security Levels, By Region, 2019-2023 (US$ Mn)
TABLE 348 Latin America Conditional Access Systems Market, by Security Levels, By Region, 2024-2032 (US$ Mn)
TABLE 349 Latin America Conditional Access Systems Market, by Delivery Models, 2019-2023 (US$ Mn)
TABLE 350 Latin America Conditional Access Systems Market, by Delivery Models, 2024-2032 (US$ Mn)
TABLE 351 Latin America Conditional Access Systems Market, by Integration Levels, 2019-2023 (US$ Mn)
TABLE 352 Latin America Conditional Access Systems Market, by Integration Levels, 2024-2032 (US$ Mn)
TABLE 353 Latin America Conditional Access Systems Market, by Emerging Technologies, 2019-2023 (US$ Mn)
TABLE 354 Latin America Conditional Access Systems Market, by Emerging Technologies, 2024-2032 (US$ Mn)
TABLE 355 Brazil Conditional Access Systems Market, by Type of Conditional Access Systems, 2019-2023 (US$ Mn)
TABLE 356 Brazil Conditional Access Systems Market, by Type of Conditional Access Systems, 2024-2032 (US$ Mn)
TABLE 357 Brazil Conditional Access Systems Market, by Applications, 2019-2023 (US$ Mn)
TABLE 358 Brazil Conditional Access Systems Market, by Applications, 2024-2032 (US$ Mn)
TABLE 359 Brazil Conditional Access Systems Market, by End-User, 2019-2023 (US$ Mn)
TABLE 360 Brazil Conditional Access Systems Market, by End-User, 2024-2032 (US$ Mn)
TABLE 361 Brazil Conditional Access Systems Market, by Security Levels, By Region, 2019-2023 (US$ Mn)
TABLE 362 Brazil Conditional Access Systems Market, by Security Levels, By Region, 2024-2032 (US$ Mn)
TABLE 363 Brazil Conditional Access Systems Market, by Delivery Models, 2019-2023 (US$ Mn)
TABLE 364 Brazil Conditional Access Systems Market, by Delivery Models, 2024-2032 (US$ Mn)
TABLE 365 Brazil Conditional Access Systems Market, by Integration Levels, 2019-2023 (US$ Mn)
TABLE 366 Brazil Conditional Access Systems Market, by Integration Levels, 2024-2032 (US$ Mn)
TABLE 367 Brazil Conditional Access Systems Market, by Emerging Technologies, 2019-2023 (US$ Mn)
TABLE 368 Brazil Conditional Access Systems Market, by Emerging Technologies, 2024-2032 (US$ Mn)
TABLE 369 Argentina Conditional Access Systems Market, by Type of Conditional Access Systems, 2019-2023 (US$ Mn)
TABLE 370 Argentina Conditional Access Systems Market, by Type of Conditional Access Systems, 2024-2032 (US$ Mn)
TABLE 371 Argentina Conditional Access Systems Market, by Applications, 2019-2023 (US$ Mn)
TABLE 372 Argentina Conditional Access Systems Market, by Applications, 2024-2032 (US$ Mn)
TABLE 373 Argentina Conditional Access Systems Market, by End-User, 2019-2023 (US$ Mn)
TABLE 374 Argentina Conditional Access Systems Market, by End-User, 2024-2032 (US$ Mn)
TABLE 375 Argentina Conditional Access Systems Market, by Security Levels, By Region, 2019-2023 (US$ Mn)
TABLE 376 Argentina Conditional Access Systems Market, by Security Levels, By Region, 2024-2032 (US$ Mn)
TABLE 377 Argentina Conditional Access Systems Market, by Delivery Models, 2019-2023 (US$ Mn)
TABLE 378 Argentina Conditional Access Systems Market, by Delivery Models, 2024-2032 (US$ Mn)
TABLE 379 Argentina Conditional Access Systems Market, by Integration Levels, 2019-2023 (US$ Mn)
TABLE 380 Argentina Conditional Access Systems Market, by Integration Levels, 2024-2032 (US$ Mn)
TABLE 381 Argentina Conditional Access Systems Market, by Emerging Technologies, 2019-2023 (US$ Mn)
TABLE 382 Argentina Conditional Access Systems Market, by Emerging Technologies, 2024-2032 (US$ Mn)
TABLE 383 Rest of Latin America Conditional Access Systems Market, by Type of Conditional Access Systems, 2019-2023 (US$ Mn)
TABLE 384 Rest of Latin America Conditional Access Systems Market, by Type of Conditional Access Systems, 2024-2032 (US$ Mn)
TABLE 385 Rest of Latin America Conditional Access Systems Market, by Applications, 2019-2023 (US$ Mn)
TABLE 386 Rest of Latin America Conditional Access Systems Market, by Applications, 2024-2032 (US$ Mn)
TABLE 387 Rest of Latin America Conditional Access Systems Market, by End-User, 2019-2023 (US$ Mn)
TABLE 388 Rest of Latin America Conditional Access Systems Market, by End-User, 2024-2032 (US$ Mn)
TABLE 389 Rest of Latin America Conditional Access Systems Market, by Security Levels, By Region, 2019-2023 (US$ Mn)
TABLE 390 Rest of Latin America Conditional Access Systems Market, by Security Levels, By Region, 2024-2032 (US$ Mn)
TABLE 391 Rest of Latin America Conditional Access Systems Market, by Delivery Models, 2019-2023 (US$ Mn)
TABLE 392 Rest of Latin America Conditional Access Systems Market, by Delivery Models, 2024-2032 (US$ Mn)
TABLE 393 Rest of Latin America Conditional Access Systems Market, by Integration Levels, 2019-2023 (US$ Mn)
TABLE 394 Rest of Latin America Conditional Access Systems Market, by Integration Levels, 2024-2032 (US$ Mn)
TABLE 395 Rest of Latin America Conditional Access Systems Market, by Emerging Technologies, 2019-2023 (US$ Mn)
TABLE 396 Rest of Latin America Conditional Access Systems Market, by Emerging Technologies, 2024-2032 (US$ Mn)
TABLE 397 Middle East Conditional Access Systems Market, by Type of Conditional Access Systems, 2019-2023 (US$ Mn)
TABLE 398 Middle East Conditional Access Systems Market, by Type of Conditional Access Systems, 2024-2032 (US$ Mn)
TABLE 399 Middle East Conditional Access Systems Market, by Applications, 2019-2023 (US$ Mn)
TABLE 400 Middle East Conditional Access Systems Market, by Applications, 2024-2032 (US$ Mn)
TABLE 401 Middle East Conditional Access Systems Market, by End-User, 2019-2023 (US$ Mn)
TABLE 402 Middle East Conditional Access Systems Market, by End-User, 2024-2032 (US$ Mn)
TABLE 403 Middle East Conditional Access Systems Market, by Security Levels, By Region, 2019-2023 (US$ Mn)
TABLE 404 Middle East Conditional Access Systems Market, by Security Levels, By Region, 2024-2032 (US$ Mn)
TABLE 405 Middle East Conditional Access Systems Market, by Delivery Models, 2019-2023 (US$ Mn)
TABLE 406 Middle East Conditional Access Systems Market, by Delivery Models, 2024-2032 (US$ Mn)
TABLE 407 Middle East Conditional Access Systems Market, by Integration Levels, 2019-2023 (US$ Mn)
TABLE 408 Middle East Conditional Access Systems Market, by Integration Levels, 2024-2032 (US$ Mn)
TABLE 409 Middle East Conditional Access Systems Market, by Emerging Technologies, 2019-2023 (US$ Mn)
TABLE 410 Middle East Conditional Access Systems Market, by Emerging Technologies, 2024-2032 (US$ Mn)
TABLE 411 UAE Conditional Access Systems Market, by Type of Conditional Access Systems, 2019-2023 (US$ Mn)
TABLE 412 UAE Conditional Access Systems Market, by Type of Conditional Access Systems, 2024-2032 (US$ Mn)
TABLE 413 UAE Conditional Access Systems Market, by Applications, 2019-2023 (US$ Mn)
TABLE 414 UAE Conditional Access Systems Market, by Applications, 2024-2032 (US$ Mn)
TABLE 415 UAE Conditional Access Systems Market, by End-User, 2019-2023 (US$ Mn)
TABLE 416 UAE Conditional Access Systems Market, by End-User, 2024-2032 (US$ Mn)
TABLE 417 UAE Conditional Access Systems Market, by Security Levels, By Region, 2019-2023 (US$ Mn)
TABLE 418 UAE Conditional Access Systems Market, by Security Levels, By Region, 2024-2032 (US$ Mn)
TABLE 419 UAE Conditional Access Systems Market, by Delivery Models, 2019-2023 (US$ Mn)
TABLE 420 UAE Conditional Access Systems Market, by Delivery Models, 2024-2032 (US$ Mn)
TABLE 421 UAE Conditional Access Systems Market, by Integration Levels, 2019-2023 (US$ Mn)
TABLE 422 UAE Conditional Access Systems Market, by Integration Levels, 2024-2032 (US$ Mn)
TABLE 423 UAE Conditional Access Systems Market, by Emerging Technologies, 2019-2023 (US$ Mn)
TABLE 424 UAE Conditional Access Systems Market, by Emerging Technologies, 2024-2032 (US$ Mn)
TABLE 425 Saudi Arabia Conditional Access Systems Market, by Type of Conditional Access Systems, 2019-2023 (US$ Mn)
TABLE 426 Saudi Arabia Conditional Access Systems Market, by Type of Conditional Access Systems, 2024-2032 (US$ Mn)
TABLE 427 Saudi Arabia Conditional Access Systems Market, by Applications, 2019-2023 (US$ Mn)
TABLE 428 Saudi Arabia Conditional Access Systems Market, by Applications, 2024-2032 (US$ Mn)
TABLE 429 Saudi Arabia Conditional Access Systems Market, by End-User, 2019-2023 (US$ Mn)
TABLE 430 Saudi Arabia Conditional Access Systems Market, by End-User, 2024-2032 (US$ Mn)
TABLE 431 Saudi Arabia Conditional Access Systems Market, by Security Levels, By Region, 2019-2023 (US$ Mn)
TABLE 432 Saudi Arabia Conditional Access Systems Market, by Security Levels, By Region, 2024-2032 (US$ Mn)
TABLE 433 Saudi Arabia Conditional Access Systems Market, by Delivery Models, 2019-2023 (US$ Mn)
TABLE 434 Saudi Arabia Conditional Access Systems Market, by Delivery Models, 2024-2032 (US$ Mn)
TABLE 435 Saudi Arabia Conditional Access Systems Market, by Integration Levels, 2019-2023 (US$ Mn)
TABLE 436 Saudi Arabia Conditional Access Systems Market, by Integration Levels, 2024-2032 (US$ Mn)
TABLE 437 Saudi Arabia Conditional Access Systems Market, by Emerging Technologies, 2019-2023 (US$ Mn)
TABLE 438 Saudi Arabia Conditional Access Systems Market, by Emerging Technologies, 2024-2032 (US$ Mn)
TABLE 439 Rest of Middle East Conditional Access Systems Market, by Type of Conditional Access Systems, 2019-2023 (US$ Mn)
TABLE 440 Rest of Middle East Conditional Access Systems Market, by Type of Conditional Access Systems, 2024-2032 (US$ Mn)
TABLE 441 Rest of Middle East Conditional Access Systems Market, by Applications, 2019-2023 (US$ Mn)
TABLE 442 Rest of Middle East Conditional Access Systems Market, by Applications, 2024-2032 (US$ Mn)
TABLE 443 Rest of Middle East Conditional Access Systems Market, by End-User, 2019-2023 (US$ Mn)
TABLE 444 Rest of Middle East Conditional Access Systems Market, by End-User, 2024-2032 (US$ Mn)
TABLE 445 Rest of Middle East Conditional Access Systems Market, by Security Levels, By Region, 2019-2023 (US$ Mn)
TABLE 446 Rest of Middle East Conditional Access Systems Market, by Security Levels, By Region, 2024-2032 (US$ Mn)
TABLE 447 Rest of Middle East Conditional Access Systems Market, by Delivery Models, 2019-2023 (US$ Mn)
TABLE 448 Rest of Middle East Conditional Access Systems Market, by Delivery Models, 2024-2032 (US$ Mn)
TABLE 449 Rest of Middle East Conditional Access Systems Market, by Integration Levels, 2019-2023 (US$ Mn)
TABLE 450 Rest of Middle East Conditional Access Systems Market, by Integration Levels, 2024-2032 (US$ Mn)
TABLE 451 Rest of Middle East Conditional Access Systems Market, by Emerging Technologies, 2019-2023 (US$ Mn)
TABLE 452 Rest of Middle East Conditional Access Systems Market, by Emerging Technologies, 2024-2032 (US$ Mn)
TABLE 453 Africa Conditional Access Systems Market, by Type of Conditional Access Systems, 2019-2023 (US$ Mn)
TABLE 454 Africa Conditional Access Systems Market, by Type of Conditional Access Systems, 2024-2032 (US$ Mn)
TABLE 455 Africa Conditional Access Systems Market, by Applications, 2019-2023 (US$ Mn)
TABLE 456 Africa Conditional Access Systems Market, by Applications, 2024-2032 (US$ Mn)
TABLE 457 Africa Conditional Access Systems Market, by End-User, 2019-2023 (US$ Mn)
TABLE 458 Africa Conditional Access Systems Market, by End-User, 2024-2032 (US$ Mn)
TABLE 459 Africa Conditional Access Systems Market, by Security Levels, By Region, 2019-2023 (US$ Mn)
TABLE 460 Africa Conditional Access Systems Market, by Security Levels, By Region, 2024-2032 (US$ Mn)
TABLE 461 Africa Conditional Access Systems Market, by Delivery Models, 2019-2023 (US$ Mn)
TABLE 462 Africa Conditional Access Systems Market, by Delivery Models, 2024-2032 (US$ Mn)
TABLE 463 Africa Conditional Access Systems Market, by Integration Levels, 2019-2023 (US$ Mn)
TABLE 464 Africa Conditional Access Systems Market, by Integration Levels, 2024-2032 (US$ Mn)
TABLE 465 Africa Conditional Access Systems Market, by Emerging Technologies, 2019-2023 (US$ Mn)
TABLE 466 Africa Conditional Access Systems Market, by Emerging Technologies, 2024-2032 (US$ Mn)
TABLE 467 South Africa Conditional Access Systems Market, by Type of Conditional Access Systems, 2019-2023 (US$ Mn)
TABLE 468 South Africa Conditional Access Systems Market, by Type of Conditional Access Systems, 2024-2032 (US$ Mn)
TABLE 469 South Africa Conditional Access Systems Market, by Applications, 2019-2023 (US$ Mn)
TABLE 470 South Africa Conditional Access Systems Market, by Applications, 2024-2032 (US$ Mn)
TABLE 471 South Africa Conditional Access Systems Market, by End-User, 2019-2023 (US$ Mn)
TABLE 472 South Africa Conditional Access Systems Market, by End-User, 2024-2032 (US$ Mn)
TABLE 473 South Africa Conditional Access Systems Market, by Security Levels, By Region, 2019-2023 (US$ Mn)
TABLE 474 South Africa Conditional Access Systems Market, by Security Levels, By Region, 2024-2032 (US$ Mn)
TABLE 475 South Africa Conditional Access Systems Market, by Delivery Models, 2019-2023 (US$ Mn)
TABLE 476 South Africa Conditional Access Systems Market, by Delivery Models, 2024-2032 (US$ Mn)
TABLE 477 South Africa Conditional Access Systems Market, by Integration Levels, 2019-2023 (US$ Mn)
TABLE 478 South Africa Conditional Access Systems Market, by Integration Levels, 2024-2032 (US$ Mn)
TABLE 479 South Africa Conditional Access Systems Market, by Emerging Technologies, 2019-2023 (US$ Mn)
TABLE 480 South Africa Conditional Access Systems Market, by Emerging Technologies, 2024-2032 (US$ Mn)
TABLE 481 Egypt Conditional Access Systems Market, by Type of Conditional Access Systems, 2019-2023 (US$ Mn)
TABLE 482 Egypt Conditional Access Systems Market, by Type of Conditional Access Systems, 2024-2032 (US$ Mn)
TABLE 483 Egypt Conditional Access Systems Market, by Applications, 2019-2023 (US$ Mn)
TABLE 484 Egypt Conditional Access Systems Market, by Applications, 2024-2032 (US$ Mn)
TABLE 485 Egypt Conditional Access Systems Market, by End-User, 2019-2023 (US$ Mn)
TABLE 486 Egypt Conditional Access Systems Market, by End-User, 2024-2032 (US$ Mn)
TABLE 487 Egypt Conditional Access Systems Market, by Security Levels, By Region, 2019-2023 (US$ Mn)
TABLE 488 Egypt Conditional Access Systems Market, by Security Levels, By Region, 2024-2032 (US$ Mn)
TABLE 489 Egypt Conditional Access Systems Market, by Delivery Models, 2019-2023 (US$ Mn)
TABLE 490 Egypt Conditional Access Systems Market, by Delivery Models, 2024-2032 (US$ Mn)
TABLE 491 Egypt Conditional Access Systems Market, by Integration Levels, 2019-2023 (US$ Mn)
TABLE 492 Egypt Conditional Access Systems Market, by Integration Levels, 2024-2032 (US$ Mn)
TABLE 493 Egypt Conditional Access Systems Market, by Emerging Technologies, 2019-2023 (US$ Mn)
TABLE 494 Egypt Conditional Access Systems Market, by Emerging Technologies, 2024-2032 (US$ Mn)
TABLE 495 Rest of Africa Conditional Access Systems Market, by Type of Conditional Access Systems, 2019-2023 (US$ Mn)
TABLE 496 Rest of Africa Conditional Access Systems Market, by Type of Conditional Access Systems, 2024-2032 (US$ Mn)
TABLE 497 Rest of Africa Conditional Access Systems Market, by Applications, 2019-2023 (US$ Mn)
TABLE 498 Rest of Africa Conditional Access Systems Market, by Applications, 2024-2032 (US$ Mn)
TABLE 499 Rest of Africa Conditional Access Systems Market, by End-User, 2019-2023 (US$ Mn)
TABLE 500 Rest of Africa Conditional Access Systems Market, by End-User, 2024-2032 (US$ Mn)
TABLE 501 Rest of Africa Conditional Access Systems Market, by Security Levels, By Region, 2019-2023 (US$ Mn)
TABLE 502 Rest of Africa Conditional Access Systems Market, by Security Levels, By Region, 2024-2032 (US$ Mn)
TABLE 503 Rest of Africa Conditional Access Systems Market, by Delivery Models, 2019-2023 (US$ Mn)
TABLE 504 Rest of Africa Conditional Access Systems Market, by Delivery Models, 2024-2032 (US$ Mn)
TABLE 505 Rest of Africa Conditional Access Systems Market, by Integration Levels, 2019-2023 (US$ Mn)
TABLE 506 Rest of Africa Conditional Access Systems Market, by Integration Levels, 2024-2032 (US$ Mn)
TABLE 507 Rest of Africa Conditional Access Systems Market, by Emerging Technologies, 2019-2023 (US$ Mn)
TABLE 508 Rest of Africa Conditional Access Systems Market, by Emerging Technologies, 2024-2032 (US$ Mn)

Frequently Asked Questions:

What is the current size of the global Conditional Access Systems market?

The global Conditional Access Systems market was valued at USD 4,845.80 Million in 2023.

What is the expected growth rate of the Conditional Access Systems market between 2024 and 2032?

The Conditional Access Systems market is expected to grow at a CAGR of 12.50% between 2024 and 2032, reaching USD 13,987.43 Million in 2032.

Which segment is leading the market share in terms of type of conditional access systems?

Smart Card-Based CAS is the leading segment by type of conditional access systems, holding over 55% share in value in 2023.

Which Security Levels segment is expected to post the highest CAGR during the forecast period?

The Advanced Encryption Standards (AES) segment is expected to post the highest CAGR during the forecast period.

Who are the major players in the global Conditional Access Systems market?

The top players include Alticast Corporation, Cisco Systems, Inc., ARRIS Group, Inc., Nagravision SA (Kudelski Group), China Digital TV Holding Co., Ltd., Coretrust, Inc., Latens Systems Ltd., Austrian Broadcasting Services GmbH & Co. KG (ORS Group), Irdeto, Inc., and Others.

Saudi Arabia Managed Security Services Market

Published:
Report ID: 36393

Microwave Oven Market

Published:
Report ID: 36314

Inkjet Coders Market

Published:
Report ID: 6669

Rich Communication Services Market

Published:
Report ID: 35774

Middle East and Africa Real-Time Payments Market

Published:
Report ID: 35770

Vietnam Managed Security Services (MSS) Market

Published:
Report ID: 35766

Middle East and Africa EdTech and Smart Classroom Market

Published:
Report ID: 35756

Digital Business Support System (DBSS) Market

Published:
Report ID: 35732

China Artificial Intelligence (AI) Market

Published:
Report ID: 35729

Asia-Pacific Workforce Management Software Market

Published:
Report ID: 35719

Mobile Wallet Market

Published:
Report ID: 8977

Recirculating Chillers Market

Published:
Report ID: 8862

Purchase Options

$2999
Delivery Format: Excel.
$4999
Designed for the individual purchaser.
$6999
Users located at a single corporate site or regional office.
$7999
Allowed for unlimited sharing globally within one company.
Smallform of Sample request

Have a question?

User Profile

Don’t settle for less – trust Mitul to help you find the best solution.

Report delivery within 24 to 48 hours

– Other Info –

What people say?-

User Review

I am very impressed with the information in this report. The author clearly did their research when they came up with this product and it has already given me a lot of ideas.

Jana Schmidt
CEDAR CX Technologies

– Connect with us –

Phone

+91 6232 49 3207


support

24/7 Research Support


sales@credenceresearch.com

– Research Methodology –

Going beyond the basics: advanced techniques in research methodology

– Trusted By –

Pepshi, LG, Nestle
Motorola, Honeywell, Johnson and johnson
LG Chem, SIEMENS, Pfizer
Unilever, Samsonite, QIAGEN