CHAPTER NO. 1 : INTRODUCTION 18
1.1.1. Report Description 18
Purpose of the Report 18
USP & Key Offerings 18
1.1.2. Key Benefits for Stakeholders 18
1.1.3. Target Audience 19
1.1.4. Report Scope 19
CHAPTER NO. 2 : EXECUTIVE SUMMARY 20
2.1. India Biomaterials Market Snapshot 20
2.1.1. India Biomaterials Market, 2018 – 2032 (USD Million) 22
CHAPTER NO. 3 : INDIA BIOMATERIALS MARKET – INDUSTRY ANALYSIS 23
3.1. Introduction 23
3.2. Market Drivers 24
3.2.1. Emerging Trends in Regenerative Medicine and Tissue Engineering 24
3.2.2. Government Support for Research and Innovation in Healthcare 25
3.3. Market Restraints 26
3.3.1. Regulatory Challenges and Long Approval Times which is Lengthy and Complex 26
3.4. Market Opportunities 27
3.4.1. Market Opportunity Analysis 27
3.5. Porter’s Five Forces Analysis 28
CHAPTER NO. 4 : ANALYSIS COMPETITIVE LANDSCAPE 29
4.1. Company Market Share Analysis – 2024 29
4.1.1. India Biomaterials Market: Company Market Share, by Volume, 2024 29
4.1.2. India Biomaterials Market: Company Market Share, by Revenue, 2024 30
4.1.3. India Biomaterials Market: Top 6 Company Market Share, by Revenue, 2024 30
4.1.4. India Biomaterials Market: Top 3 Company Market Share, by Revenue, 2024 31
4.2. India Biomaterials Market Company Revenue Market Share, 2024 32
4.3. Company Assessment Metrics, 2024 33
4.3.1. Stars 33
4.3.2. Emerging Leaders 33
4.3.3. Pervasive Players 33
4.3.4. Participants 33
4.4. Start-ups /SMEs Assessment Metrics, 2024 33
4.4.1. Progressive Companies 33
4.4.2. Responsive Companies 33
4.4.3. Dynamic Companies 33
4.4.4. Starting Blocks 33
4.5. Strategic Developments 34
4.5.1. Acquisitions & Mergers 34
New Product Launch 34
India Expansion 34
4.6. Key Players Product Matrix 35
CHAPTER NO. 5 : PESTEL & ADJACENT MARKET ANALYSIS 36
5.1. PESTEL 36
5.1.1. Political Factors 36
5.1.2. Economic Factors 36
5.1.3. Social Factors 36
5.1.4. Technological Factors 36
5.1.5. Environmental Factors 36
5.1.6. Legal Factors 36
5.2. Adjacent Market Analysis 36
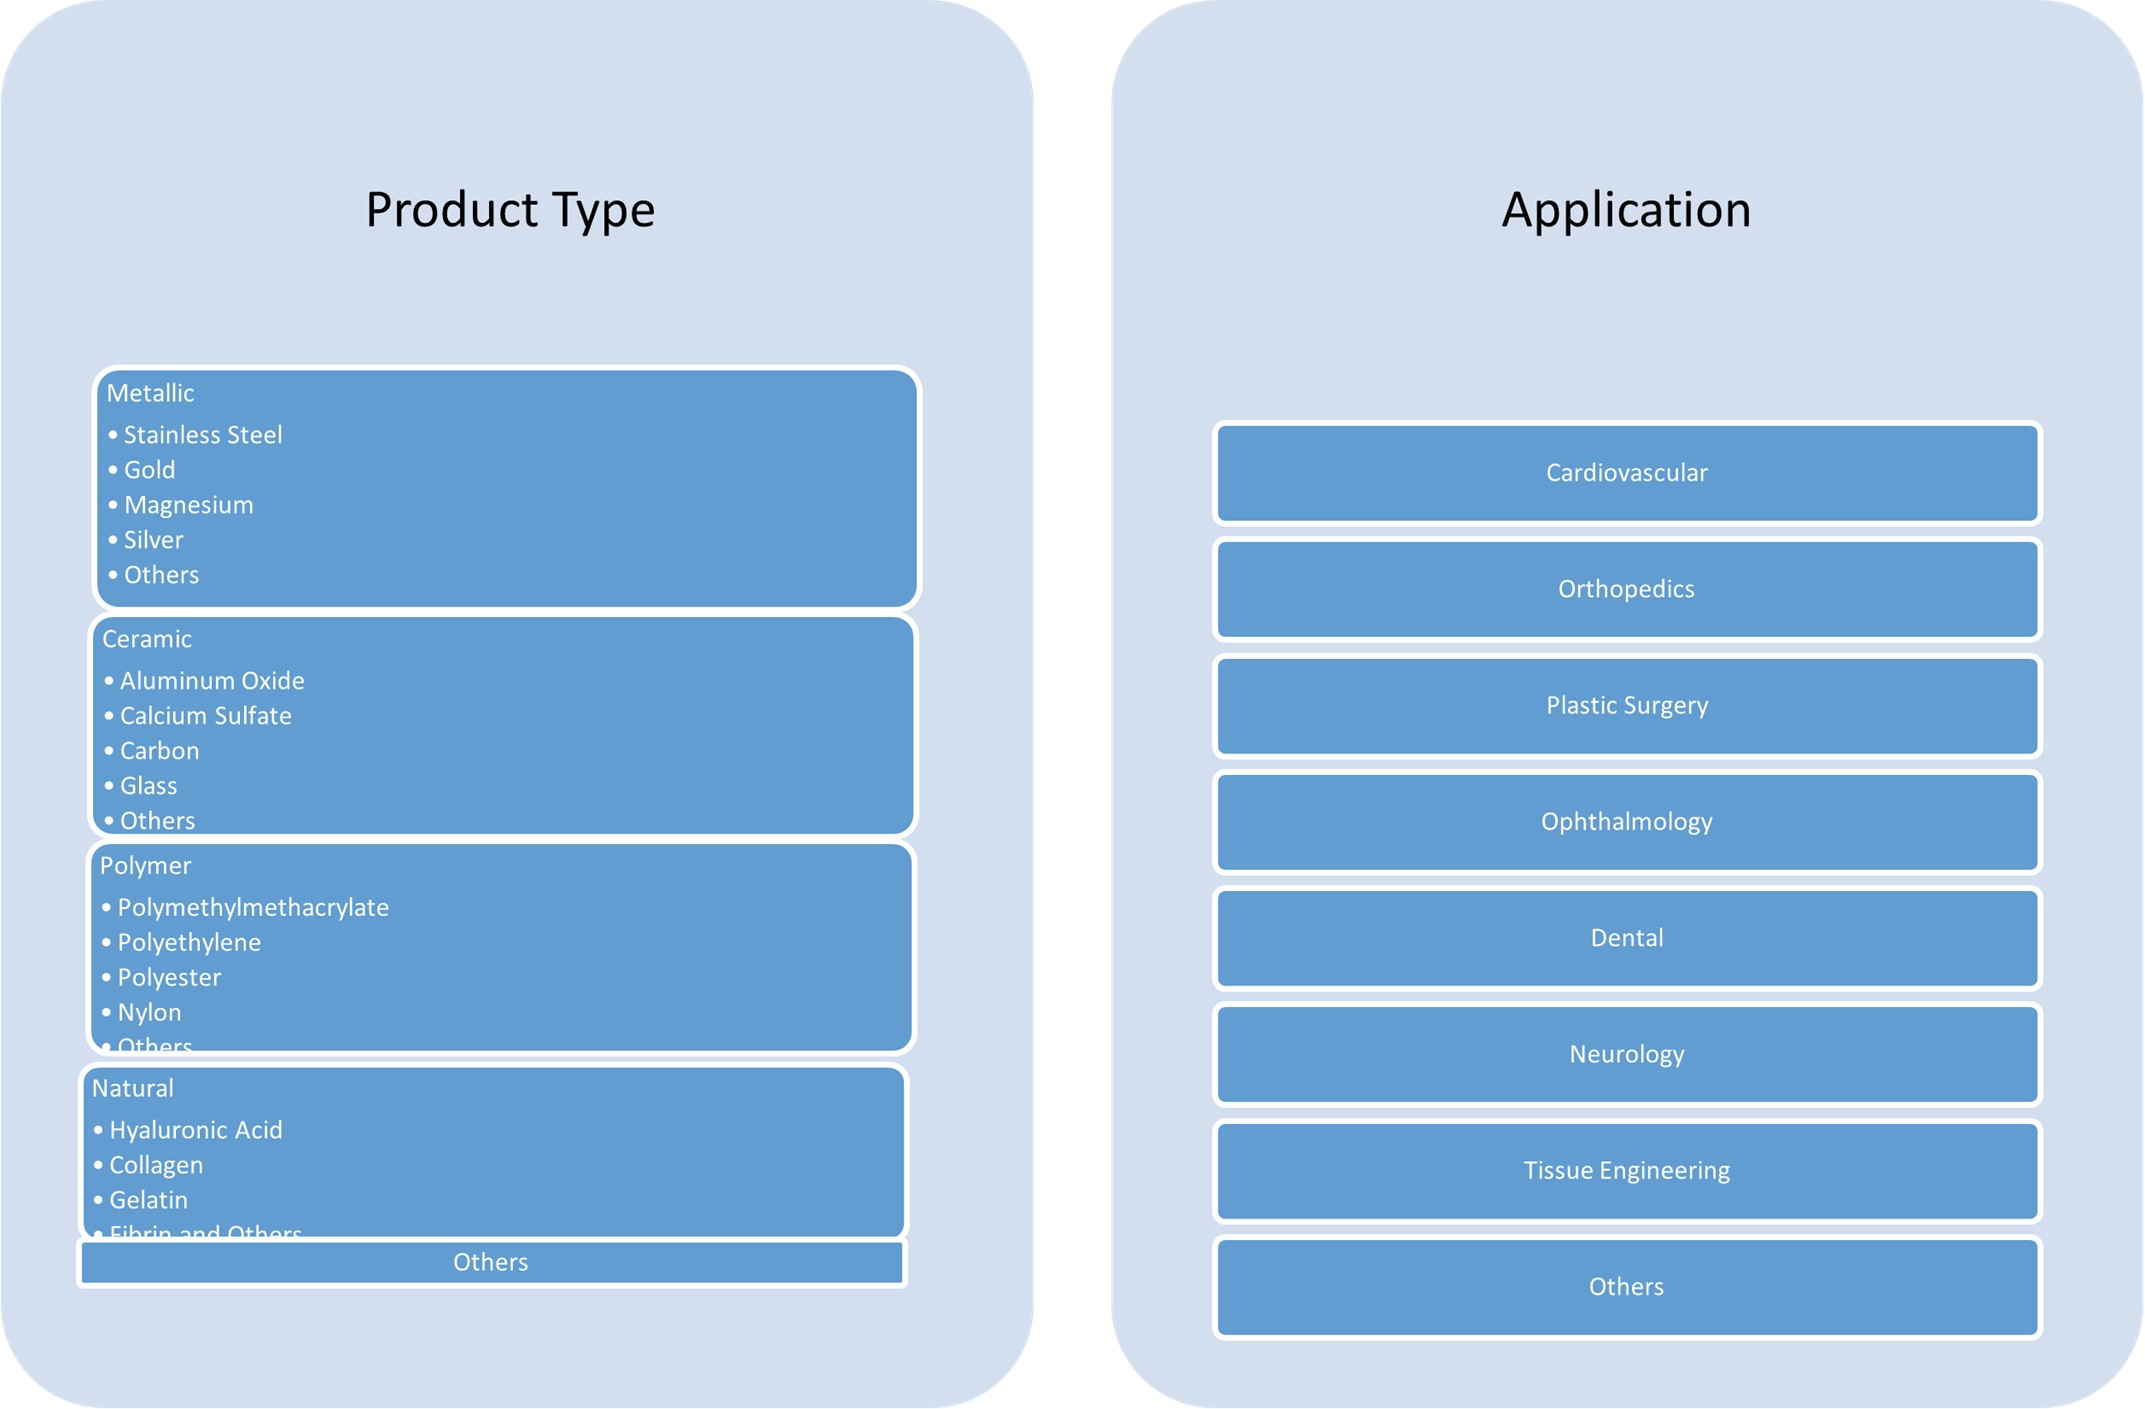
CHAPTER NO. 6 : INDIA BIOMATERIALS MARKET – BY PRODUCT TYPE SEGMENT ANALYSIS 37
6.1. India Biomaterials Market Overview, by Product Type Segment 37
6.1.1. India Biomaterials Market Revenue Share, By Product Type, 2023 & 2032 38
6.1.2. India Biomaterials Market Attractiveness Analysis, By Product Type 39
6.1.3. Incremental Revenue Growth Opportunity, by Product Type, 2024 – 2032 39
6.1.4. India Biomaterials Market Revenue, By Product Type, 2018, 2023, 2027 & 2032 40
6.2. Metallic 41
6.3. Stainless Steel 42
6.4. Gold 43
6.5. Magnesium 44
6.6. Silver 45
6.7. Others 46
6.8. Ceramic 47
6.9. Aluminum Oxide 48
6.10. Calcium Sulfate 49
6.11. Carbon 50
6.12. Glass 51
6.13. Others 52
6.14. Polymer 53
6.15. Polymethylmethacrylate 54
6.16. Polyethylene 55
6.17. Polyester 56
6.18. Nylon 57
6.19. Others 58
6.20. Natural 59
6.21. Hyaluronic Acid 60
6.22. Collagen 61
6.23. Gelatin 62
6.24. Fibrin 63
6.25. Others 64
6.26. Others 65
CHAPTER NO. 7 : INDIA BIOMATERIALS MARKET – BY APPLICATION SEGMENT ANALYSIS 66
7.1. India Biomaterials Market Overview, by Application Segment 66
7.1.1. India Biomaterials Market Revenue Share, By Application, 2023 & 2032 67
7.1.2. India Biomaterials Market Attractiveness Analysis, By Application 68
7.1.3. Incremental Revenue Growth Opportunity, by Application, 2024 – 2032 68
7.1.4. India Biomaterials Market Revenue, By Application, 2018, 2023, 2027 & 2032 69
7.2. Cardiovascular 70
7.3. Orthopedics 71
7.4. Plastic Surgery 72
7.5. Ophthalmology 73
7.6. Dental 74
7.7. Neurology 75
7.8. Tissue Engineering 76
7.9. Others 77
CHAPTER NO. 8 : INDIA BIOMATERIALS MARKET – INDIA ANALYSIS 78
8.1. Product Type 78
8.1.1. India Biomaterials Market Revenue, By Product Type, 2018 – 2023 (USD Million) 78
8.1.2. India Biomaterials Market Revenue, By Product Type, 2024 – 2032 (USD Million) 78
8.2. Application 79
8.2.1. India Biomaterials Market Revenue, By Application, 2018 – 2023 (USD Million) 79
8.2.2. India Biomaterials Market Revenue, By Application, 2024 – 2032 (USD Million) 79
CHAPTER NO. 9 : COMPANY PROFILES 80
9.1. Orthogen 80
9.1.1. Company Overview 80
9.1.2. Product Portfolio 80
9.1.3. Swot Analysis 80
9.1.4. Business Strategy 81
9.1.5. Financial Overview 81
9.2. Biomet 82
9.3. Medicure 82
9.4. CureMetrix 82
9.5. Ethan Group 82
9.6. Company 6 82
9.7. Company 7 82
9.8. Company 8 82
9.9. Company 9 82
9.10. Company 10 82
9.11. Company 11 82
9.12. Company 12 82
9.13. Company 13 82
9.14. Company 14 82
List of Figures
FIG NO. 1. India Biomaterials Market Revenue, 2018 – 2032 (USD Million) 22
FIG NO. 2. Porter’s Five Forces Analysis for India Biomaterials Market 28
FIG NO. 3. Company Share Analysis, 2024 29
FIG NO. 4. Company Share Analysis, 2024 30
FIG NO. 5. Company Share Analysis, 2024 30
FIG NO. 6. Company Share Analysis, 2024 31
FIG NO. 7. India Biomaterials Market – Company Revenue Market Share, 2024 32
FIG NO. 8. India Biomaterials Market Revenue Share, By Product Type, 2023 & 2032 38
FIG NO. 9. Market Attractiveness Analysis, By Product Type 39
FIG NO. 10. Incremental Revenue Growth Opportunity by Product Type, 2024 – 2032 39
FIG NO. 11. India Biomaterials Market Revenue, By Product Type, 2018, 2023, 2027 & 2032 40
FIG NO. 12. India Biomaterials Market for Metallic, Revenue (USD Million) 2018 – 2032 41
FIG NO. 13. India Biomaterials Market for Stainless Steel, Revenue (USD Million) 2018 – 2032 42
FIG NO. 14. India Biomaterials Market for Gold, Revenue (USD Million) 2018 – 2032 43
FIG NO. 15. India Biomaterials Market for Magnesium, Revenue (USD Million) 2018 – 2032 44
FIG NO. 16. India Biomaterials Market for Cooling Silver, Revenue (USD Million) 2018 – 2032 45
FIG NO. 17. India Biomaterials Market for Others, Revenue (USD Million) 2018 – 2032 46
FIG NO. 18. India Biomaterials Market for Ceramic, Revenue (USD Million) 2018 – 2032 47
FIG NO. 19. India Biomaterials Market for Cooling Aluminum Oxide, Revenue (USD Million) 2018 – 2032 48
FIG NO. 20. India Biomaterials Market for Calcium Sulfate, Revenue (USD Million) 2018 – 2032 49
FIG NO. 21. India Biomaterials Market for Carbon, Revenue (USD Million) 2018 – 2032 50
FIG NO. 22. India Biomaterials Market for Glass, Revenue (USD Million) 2018 – 2032 51
FIG NO. 23. India Biomaterials Market for Others, Revenue (USD Million) 2018 – 2032 52
FIG NO. 24. India Biomaterials Market for Polymer, Revenue (USD Million) 2018 – 2032 53
FIG NO. 25. India Biomaterials Market for Polymethylmethacrylate, Revenue (USD Million) 2018 – 2032 54
FIG NO. 26. India Biomaterials Market for Polyethylene, Revenue (USD Million) 2018 – 2032 55
FIG NO. 27. India Biomaterials Market for Polyester, Revenue (USD Million) 2018 – 2032 56
FIG NO. 28. India Biomaterials Market for Nylon, Revenue (USD Million) 2018 – 2032 57
FIG NO. 29. India Biomaterials Market for Others, Revenue (USD Million) 2018 – 2032 58
FIG NO. 30. India Biomaterials Market for Natural, Revenue (USD Million) 2018 – 2032 59
FIG NO. 31. India Biomaterials Market for Hyaluronic Acid, Revenue (USD Million) 2018 – 2032 60
FIG NO. 32. India Biomaterials Market for Collagen, Revenue (USD Million) 2018 – 2032 61
FIG NO. 33. India Biomaterials Market for Gelatin, Revenue (USD Million) 2018 – 2032 62
FIG NO. 34. India Biomaterials Market for Fibrin, Revenue (USD Million) 2018 – 2032 63
FIG NO. 35. India Biomaterials Market for Others, Revenue (USD Million) 2018 – 2032 64
FIG NO. 36. India Biomaterials Market for Others, Revenue (USD Million) 2018 – 2032 65
FIG NO. 37. India Biomaterials Market Revenue Share, By Application, 2023 & 2032 67
FIG NO. 38. Market Attractiveness Analysis, By Application 68
FIG NO. 39. Incremental Revenue Growth Opportunity by Application, 2024 – 2032 68
FIG NO. 40. India Biomaterials Market Revenue, By Application, 2018, 2023, 2027 & 2032 69
FIG NO. 41. India Biomaterials Market for Cardiovascular, Revenue (USD Million) 2018 – 2032 70
FIG NO. 42. India Biomaterials Market for Orthopedics, Revenue (USD Million) 2018 – 2032 71
FIG NO. 43. India Biomaterials Market for Plastic Surgery, Revenue (USD Million) 2018 – 2032 72
FIG NO. 44. India Biomaterials Market for Ophthalmology, Revenue (USD Million) 2018 – 2032 73
FIG NO. 45. India Biomaterials Market for Dental, Revenue (USD Million) 2018 – 2032 74
FIG NO. 46. India Biomaterials Market for Neurology, Revenue (USD Million) 2018 – 2032 75
FIG NO. 47. India Biomaterials Market for Tissue Engineering, Revenue (USD Million) 2018 – 2032 76
FIG NO. 48. India Biomaterials Market for Others, Revenue (USD Million) 2018 – 2032 77
List of Tables
TABLE NO. 1. : India Biomaterials Market: Snapshot 20
TABLE NO. 2. : Drivers for the India Biomaterials Market: Impact Analysis 24
TABLE NO. 3. : Restraints for the India Biomaterials Market: Impact Analysis 26
TABLE NO. 4. : India Biomaterials Market Revenue, By Product Type, 2018 – 2023 (USD Million) 78
TABLE NO. 5. : India Biomaterials Market Revenue, By Product Type, 2024 – 2032 (USD Million) 78
TABLE NO. 6. : India Biomaterials Market Revenue, By Application, 2018 – 2023 (USD Million) 79
TABLE NO. 7. : India Biomaterials Market Revenue, By Application, 2024 – 2032 (USD Million) 79