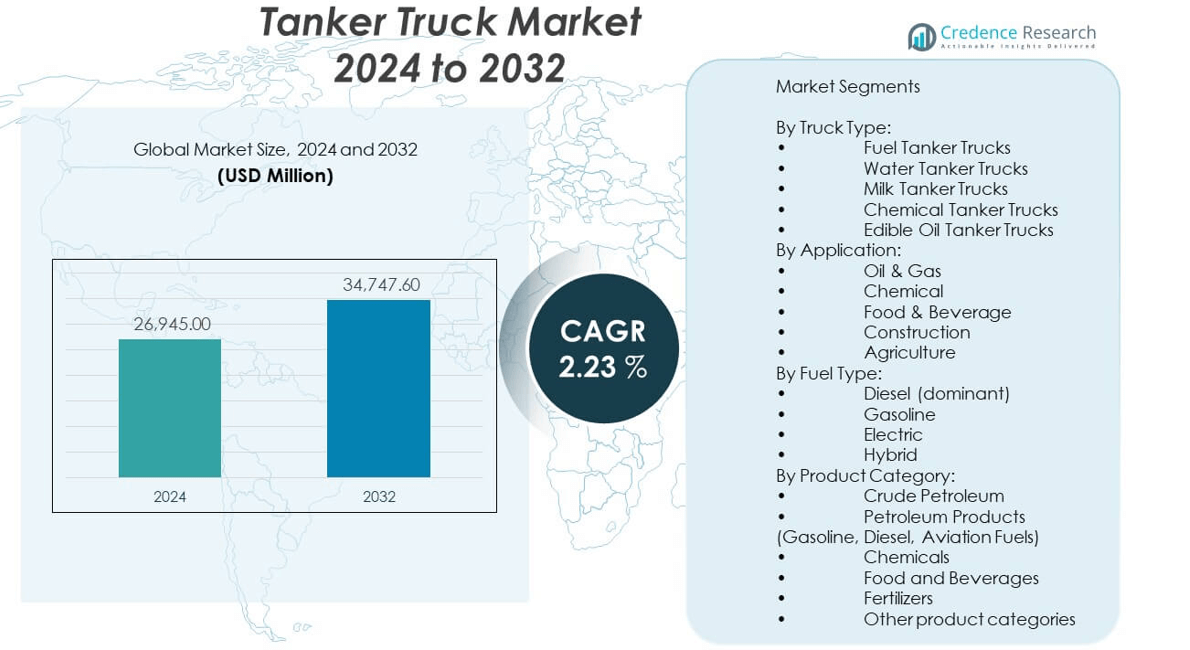
Home » Automotive & Transportation » Tanker Trucks Market

Tanker Trucks Market By Product (Rigid Tanker Trucks, Articulated Tanker Trucks); By Application (Municipal Water Supply, Construction, Mining, Waste Management, Others); By End-User (Industrial, Commercial, Government, Agriculture, Others); By Capacity (Below 5,000 Gallons, 5,001 – 10,000 Gallons, 10,000 – 15,000 Gallons, 15,000 – 20,000 Gallons, Above 20,000 Gallons) – Growth, Share, Opportunities & Competitive Analysis, 2024 – 2032

Price: $4699

Published: | Report ID: 10874 | Report Format : PDF
REPORT ATTRIBUTE DETAILS
Historical Period  2019-2022
Base Year  2023
Forecast Period  2024-2032
Tanker Trucks Market Size 2023  USD 106,572.93 Million
Tanker Trucks Market, CAGR  6.45%
Tanker Trucks Market Size 2032  USD 187,050.08 Million

Market Overview

The Tanker Trucks Market is projected to grow from USD 106,572.93 million in 2023 to an estimated USD 187,050.08 million by 2032, with a compound annual growth rate (CAGR) of 6.45% from 2024 to 2032. This growth is fueled by increasing demand for the transportation of bulk liquids, chemicals, petroleum products, and food-grade liquids.

Key drivers of the tanker trucks market include the growth of industrialization, especially in developing regions, coupled with an increasing demand for energy and chemicals. The rising trend of e-commerce has also fueled the need for advanced logistics solutions. Additionally, the adoption of regulations concerning safety, emissions, and environmental impact are pushing manufacturers to innovate, leading to the development of more fuel-efficient and safer tanker trucks. Another significant trend is the integration of IoT and GPS technology for real-time monitoring of shipments, enhancing operational efficiency.

Geographically, North America and Europe are dominant markets for tanker trucks, driven by strong infrastructure and regulations surrounding safety and emissions. However, the Asia-Pacific region is expected to experience the highest growth rate during the forecast period due to rapid industrialization and increased demand for transportation solutions in countries like China and India. Key players in the market include Volvo Group, Daimler AG, MAN SE, Scania AB, and Navistar International Corporation, all of which are advancing innovations in safety, fuel efficiency, and technology integration.

Design Element 2

Access crucial information at unmatched prices!

Request your free sample report today & start making informed decisions powered by Credence Research!

Download Free Sample

CTA Design Element 3

Market Insights

  1. The tanker trucks market is projected to grow from USD 106,572.93 million in 2023 to USD 187,050.08 million by 2032, with a CAGR of 6.45% from 2024 to 2032.
  2. The rising demand for the transportation of liquids, chemicals, and petroleum products is a key driver fueling market growth, especially in emerging economies.
  3. Innovations in fuel-efficient engines, hybrid/electric trucks, and IoT integration for real-time tracking are enhancing tanker truck operational efficiency and safety.
  4. Stricter safety, emissions, and environmental regulations are pushing manufacturers to develop more sustainable and compliant tanker trucks.
  5. North America and Europe are leading markets, while Asia-Pacific is expected to witness the highest growth due to rapid industrialization and increased demand for transportation solutions.
  6. The high upfront costs of advanced tanker trucks, especially electric or hybrid models, may limit adoption in price-sensitive regions.
  7. The boom in e-commerce and industrial growth is driving the need for more efficient logistics solutions, including tanker trucks for bulk liquid transport.

Market Drivers

Integration of Advanced Safety Features and Autonomous Driving Technology

One of the most prominent trends in the tanker trucks market is the integration of advanced safety technologies, including autonomous driving systems and driver assistance features. Safety is a major concern in the transportation of hazardous materials, and as such, manufacturers are increasingly incorporating advanced safety technologies to minimize risk and improve operational efficiency. For instance, many modern tanker trucks are now equipped with collision mitigation systems that utilize radar and sensors to predict potential collisions, automatically applying brakes when necessary to prevent accidents. Additionally, lane-keeping assist technologies help drivers maintain their position on the road by monitoring lane markings and providing corrective steering assistance if the vehicle drifts without signaling. Moreover, roll stability control systems are being incorporated to detect rollover risks and apply brakes to individual wheels, thereby stabilizing the truck during critical maneuvers. The adoption of these technologies not only aims to protect drivers but also enhances safety for other road users, particularly when transporting hazardous materials.Furthermore, the trend toward autonomous driving technology is gaining traction in the tanker trucks market. Several manufacturers are actively developing self-driving systems that can enhance safety and reduce human error in the transportation of hazardous cargo. Autonomous trucks are expected to improve fuel efficiency by optimizing driving patterns and reducing accidents caused by human mistakes, which could also lead to cost reductions in the long term. Although fully autonomous trucks are not yet widely used, the growing interest in this technology suggests it will play an increasingly important role in the future of tanker truck fleets. As the technology matures, it could significantly transform the tanker truck market by creating new safety standards and operational efficiencies.

Shift Toward Eco-friendly and Fuel-efficient Tanker Trucks

With growing concerns over environmental sustainability, there has been a marked shift in the tanker trucks market toward the development and adoption of eco-friendly and fuel-efficient vehicles. Regulations surrounding carbon emissions and environmental impact are forcing manufacturers to innovate and design tanker trucks that comply with stringent emissions standards while also minimizing fuel consumption. In regions such as Europe, where regulations like Euro 6 and beyond are in place, tankers are being built with cleaner engine technologies that reduce emissions and enhance fuel efficiency.Electric and hybrid tanker trucks are emerging as viable alternatives to traditional diesel-powered vehicles, offering reduced carbon footprints and lower operational costs. Electric tanker trucks, though still in the early stages of commercialization, offer the potential to significantly reduce emissions and fuel costs, particularly for short-haul routes or last-mile deliveries. Hybrid models, which combine traditional internal combustion engines with electric motors, are also gaining popularity due to their ability to reduce fuel consumption and improve overall efficiency. The shift toward greener tanker trucks is being driven by not only regulatory mandates but also by the growing consumer and corporate preference for more sustainable logistics solutions. This trend will likely accelerate as advancements in battery technology and electric vehicle infrastructure make these vehicles more practical and cost-effective.

Digitalization and Adoption of Fleet Management Software

The digital transformation of the tanker trucks market is another major trend that is reshaping the industry. The increasing adoption of fleet management software, telematics, and IoT-enabled technologies is allowing fleet operators to monitor and manage their tanker truck fleets more efficiently. These technologies provide real-time data on truck performance, fuel usage, driver behavior, and cargo condition, enabling operators to optimize routes, reduce fuel consumption, and enhance fleet productivity.Fleet management systems are now equipped with advanced capabilities such as predictive maintenance, which helps prevent costly breakdowns and downtime by alerting operators to potential mechanical issues before they become critical. Additionally, real-time GPS tracking allows companies to monitor the progress of deliveries, ensuring that shipments are on schedule and providing customers with real-time updates. These technologies also support compliance with safety regulations by tracking adherence to driving hours and ensuring drivers follow appropriate safety protocols. The integration of telematics and fleet management software not only improves operational efficiency but also boosts safety and customer satisfaction, driving continued adoption of these technologies in the tanker truck sector.

Growing Demand for Specialized Tanker Trucks for Niche Markets

As the tanker trucks market evolves, there is an increasing demand for specialized tanker trucks designed for specific niche markets. Different industries require tailored tanker trucks based on the type of liquids being transported. For instance, food-grade tankers are specially designed to transport liquids such as milk, wine, and other consumables, ensuring that they meet strict hygiene and safety standards. Similarly, chemical tankers are engineered to safely transport hazardous liquids, requiring specialized materials, insulation, and safety measures to handle dangerous chemicals and prevent spills.Another emerging trend is the demand for multi-compartment tanker trucks that can transport several types of liquids simultaneously without mixing them. This is particularly useful for industries where multiple products need to be delivered in a single trip, such as in the oil and gas sector or in transporting multiple food or beverage ingredients. The ability to customize tanker trucks for specific use cases is driving demand for these specialized vehicles as industries seek more efficient and cost-effective ways to manage logistics for transporting various types of bulk liquids.Furthermore, the development of smaller, more flexible tanker trucks designed for urban and last-mile delivery is becoming increasingly popular. These trucks are more maneuverable and better suited for navigating congested city streets, offering the flexibility required to meet the growing demand for last-mile liquid delivery services. The growth of e-commerce, particularly in urban areas, is further fueling this demand for smaller, more adaptable tanker trucks capable of operating in challenging environments.

Market Trends

Integration of Advanced Safety Features and Autonomous Driving Technology

One of the most prominent trends in the tanker trucks market is the integration of advanced safety technologies, including autonomous driving systems and driver assistance features. Safety is a major concern in the transportation of hazardous materials, and as such, manufacturers are increasingly incorporating advanced safety technologies to minimize risk and improve operational efficiency. For instance, many modern tanker trucks are now equipped with collision mitigation systems that utilize radar and sensors to predict potential collisions, automatically applying brakes when necessary to prevent accidents. Additionally, lane-keeping assist technologies help drivers maintain their position on the road by monitoring lane markings and providing corrective steering assistance if the vehicle drifts without signaling. Moreover, roll stability control systems are being incorporated to detect rollover risks and apply brakes to individual wheels, thereby stabilizing the truck during critical maneuvers. The adoption of these technologies not only aims to protect drivers but also enhances safety for other road users, particularly when transporting hazardous materials.Furthermore, the trend toward autonomous driving technology is gaining traction in the tanker trucks market. Several manufacturers are actively developing self-driving systems that can enhance safety and reduce human error in the transportation of hazardous cargo. Autonomous trucks are expected to improve fuel efficiency by optimizing driving patterns and reducing accidents caused by human mistakes, which could also lead to cost reductions in the long term. Although fully autonomous trucks are not yet widely used, the growing interest in this technology suggests it will play an increasingly important role in the future of tanker truck fleets. As the technology matures, it could significantly transform the tanker truck market by creating new safety standards and operational efficiencies.

Shift Toward Eco-friendly and Fuel-efficient Tanker Trucks

With growing concerns over environmental sustainability, there has been a marked shift in the tanker trucks market toward the development and adoption of eco-friendly and fuel-efficient vehicles. Regulations surrounding carbon emissions and environmental impact are forcing manufacturers to innovate and design tanker trucks that comply with stringent emissions standards while also minimizing fuel consumption. In regions such as Europe, where regulations like Euro 6 and beyond are in place, tankers are being built with cleaner engine technologies that reduce emissions and enhance fuel efficiency.Electric and hybrid tanker trucks are emerging as viable alternatives to traditional diesel-powered vehicles, offering reduced carbon footprints and lower operational costs. Electric tanker trucks, though still in the early stages of commercialization, offer the potential to significantly reduce emissions and fuel costs, particularly for short-haul routes or last-mile deliveries. Hybrid models, which combine traditional internal combustion engines with electric motors, are also gaining popularity due to their ability to reduce fuel consumption and improve overall efficiency. The shift toward greener tanker trucks is being driven by not only regulatory mandates but also by the growing consumer and corporate preference for more sustainable logistics solutions. This trend will likely accelerate as advancements in battery technology and electric vehicle infrastructure make these vehicles more practical and cost-effective.

Digitalization and Adoption of Fleet Management Software

The digital transformation of the tanker trucks market is another major trend that is reshaping the industry. The increasing adoption of fleet management software, telematics, and IoT-enabled technologies is allowing fleet operators to monitor and manage their tanker truck fleets more efficiently. These technologies provide real-time data on truck performance, fuel usage, driver behavior, and cargo condition, enabling operators to optimize routes, reduce fuel consumption, and enhance fleet productivity.Fleet management systems are now equipped with advanced capabilities such as predictive maintenance, which helps prevent costly breakdowns and downtime by alerting operators to potential mechanical issues before they become critical. Additionally, real-time GPS tracking allows companies to monitor the progress of deliveries, ensuring that shipments are on schedule and providing customers with real-time updates. These technologies also support compliance with safety regulations by tracking adherence to driving hours and ensuring drivers follow appropriate safety protocols. The integration of telematics and fleet management software not only improves operational efficiency but also boosts safety and customer satisfaction, driving continued adoption of these technologies in the tanker truck sector.

Growing Demand for Specialized Tanker Trucks for Niche Markets

As the tanker trucks market evolves, there is an increasing demand for specialized tanker trucks designed for specific niche markets. Different industries require tailored tanker trucks based on the type of liquids being transported. For instance, food-grade tankers are specially designed to transport liquids such as milk, wine, and other consumables, ensuring that they meet strict hygiene and safety standards. Similarly, chemical tankers are engineered to safely transport hazardous liquids, requiring specialized materials, insulation, and safety measures to handle dangerous chemicals and prevent spills.Another emerging trend is the demand for multi-compartment tanker trucks that can transport several types of liquids simultaneously without mixing them. This is particularly useful for industries where multiple products need to be delivered in a single trip, such as in the oil and gas sector or in transporting multiple food or beverage ingredients. The ability to customize tanker trucks for specific use cases is driving demand for these specialized vehicles as industries seek more efficient and cost-effective ways to manage logistics for transporting various types of bulk liquids.Furthermore, the development of smaller, more flexible tanker trucks designed for urban and last-mile delivery is becoming increasingly popular. These trucks are more maneuverable and better suited for navigating congested city streets, offering the flexibility required to meet the growing demand for last-mile liquid delivery services. The growth of e-commerce, particularly in urban areas, is further fueling this demand for smaller, more adaptable tanker trucks capable of operating in challenging.

Market Challenges

Stringent Regulatory Compliance and Safety Standards

One of the major challenges faced by the tanker trucks market is the increasingly stringent regulatory landscape regarding safety, emissions, and environmental impact. As governments worldwide impose more rigorous regulations, particularly in regions such as Europe and North America, manufacturers and fleet operators are under significant pressure to comply with evolving standards. These regulations include safety measures for transporting hazardous materials, emissions reductions to combat climate change, and mandates to improve vehicle efficiency. Adhering to these regulations often requires substantial investments in new technologies, design modifications, and retrofitting of existing vehicles, which can be costly for operators, especially in smaller fleets. For example, the introduction of Euro 6 emission standards and the growing push for carbon-neutral transportation solutions require tankers to adopt cleaner engines and alternative fuel sources, such as electric or hybrid powertrains. While these innovations offer long-term environmental and economic benefits, the initial cost of transitioning to such technologies can be prohibitive. Moreover, ensuring tanker trucks comply with safety regulations for the transportation of hazardous and flammable liquids also demands advanced engineering solutions, which further increases the cost burden for operators. Failure to meet these regulatory requirements can result in penalties, operational delays, and reputational damage, creating a significant challenge for the industry.

High Operational and Maintenance Costs

Another significant challenge in the tanker trucks market is the high operational and maintenance costs associated with these vehicles. Tanker trucks, especially those used for transporting hazardous materials, require regular maintenance to ensure their safety and operational efficiency. The complexity of tanker design, with specialized components such as reinforced tanks, insulation, and pressure control systems, increases the cost of maintenance. Moreover, because tanker trucks often operate in demanding environments, including long-distance hauls and harsh weather conditions, the wear and tear on the vehicles is more significant compared to other types of trucks. In addition to maintenance, the rising fuel costs can considerably impact the profitability of fleet operators. While technological advancements, such as fuel-efficient engines and hybrid systems, help reduce operational costs over time, the upfront investment in these technologies can be substantial. For smaller operators, the financial burden of maintaining an aging fleet or investing in newer, more expensive tanker trucks can be a barrier to growth and sustainability. These high operational and maintenance costs, coupled with increasing competition in the logistics sector, create a challenging environment for companies looking to maximize profitability while ensuring compliance with safety and environmental standards.

Market Opportunities

Growth of Emerging Markets and Infrastructure Development

One of the most significant opportunities in the tanker trucks market lies in the expansion of infrastructure and industrialization in emerging markets, particularly in regions such as Asia-Pacific, Africa, and Latin America. These regions are experiencing rapid economic growth, urbanization, and an increased demand for goods and raw materials, driving the need for efficient bulk transportation solutions. As industries like oil and gas, chemicals, and food production expand in these markets, the demand for tanker trucks to transport liquids, fuels, chemicals, and food-grade products will continue to rise. Governments in these regions are also investing heavily in transportation infrastructure, such as highways, ports, and logistics hubs, further boosting the demand for tanker trucks. As regulatory frameworks evolve and standards for safety and environmental compliance become more robust, the tanker truck market can capitalize on these improvements by providing safer, more efficient transportation solutions. This trend presents a substantial opportunity for manufacturers to penetrate these rapidly developing markets with tailored solutions that meet local demand and regulatory requirements.

Technological Advancements and Sustainable Solutions

Another significant opportunity in the tanker trucks market is the growing demand for environmentally sustainable and fuel-efficient vehicles. As governments tighten emissions regulations and industries move toward more eco-conscious operations, the adoption of electric, hybrid, and alternative-fuel tanker trucks presents a promising avenue for growth. The development of more energy-efficient engines, alongside innovations in battery technology and hydrogen fuel cells, creates opportunities for manufacturers to lead in the production of eco-friendly tanker trucks that reduce operational costs while meeting environmental standards. This trend is particularly relevant in markets where environmental regulations are becoming more stringent, presenting an opportunity for companies that invest in clean technologies to gain a competitive edge.

Market Segmentation Analysis

By Product

Tanker trucks are classified into rigid and articulated types, each suited to different transportation needs. Rigid tanker trucks are single-unit vehicles with the cab and tank forming one solid structure, making them ideal for short-distance transport and industries that require frequent loading and unloading. Their enhanced maneuverability and ease of access make them well-suited for urban areas and applications like municipal water supply, waste management, and construction. On the other hand, articulated tanker trucks consist of a tractor unit connected to a detachable trailer, making them more suitable for long-distance transport. They offer higher load capacity and better stability on highways, which is why they are commonly used in industries like oil and gas, chemical transport, and large-scale agriculture, where longer hauls and heavier payloads are required.

By Application

Tanker trucks are essential across various applications, including municipal water supply, where they deliver potable water to urban areas with limited infrastructure or during emergencies. In construction, they transport water, chemicals, and fuel, ensuring the smooth operation of machinery and site management. In mining, tanker trucks provide critical support by transporting water, fuel, and chemicals for mining operations, as well as controlling dust on large sites. In waste management, they are used to collect and transport liquid waste, such as sewage and industrial effluents, ensuring compliance with environmental regulations. Additionally, tanker trucks are vital for transporting food-grade liquids, chemicals, and fuels in industries like oil and gas, agriculture, and manufacturing.

Segments

Based on Product

  • Rigid Tanker Trucks
  • Articulated Tanker Trucks

Based on Application

  • Municipal Water Supply
  • Construction
  • Mining
  • Waste Management
  • Others

Based on End-User

  • Industrial
  • Commercial
  • Government
  • Agriculture
  • Others

Based on Capacity

  • Below 5,000 Gallons
  • 5,001 – 10,000 Gallons
  • 10,000 – 15,000 Gallons
  • 15,000 – 20,000 Gallons
  • Above 20,000 Gallons

Based on Region

  • North America
    • U.S.
    • Canada
    • Mexico
  • Europe
    • Germany
    • France
    • U.K.
    • Italy
    • Spain
    • Rest of Europe
  • Asia Pacific
    • China
    • Japan
    • India
    • South Korea
    • South-east Asia
    • Rest of Asia Pacific
  • Latin America
    • Brazil
    • Argentina
    • Rest of Latin America
  • Middle East & Africa
    • GCC Countries
    • South Africa
    • Rest of the Middle East and Africa

Regional Analysis

North America (35%)

North America dominates the tanker trucks market with the largest share, accounting for approximately 35% of the total market. The market is primarily driven by the strong presence of industries such as oil and gas, chemical manufacturing, and agriculture, all of which require bulk liquid transportation. The U.S. is the largest contributor in this region, driven by the demand for articulated tanker trucks for long-distance transport of fuels, chemicals, and food-grade liquids. The stringent regulatory environment, including emission standards and safety requirements, has also encouraged the adoption of more efficient, eco-friendly tanker trucks. Additionally, the increasing demand for hazardous liquid transport, combined with a mature logistics infrastructure, continues to support market growth in this region.

Europe (30%)

Europe holds the second-largest share of the tanker trucks market, with a market share of approximately 30%. The region’s demand is primarily fueled by industrial sectors such as petrochemicals, food and beverages, and pharmaceuticals, as well as stringent government regulations regarding environmental sustainability. The EU has implemented robust emission standards like Euro 6, which are pushing the market toward the adoption of cleaner, more fuel-efficient tanker trucks. Germany, the U.K., and France are among the leading markets in Europe, where demand for high-capacity tanker trucks and those equipped with advanced safety and telematics technologies is high. The shift toward hybrid and electric tanker trucks is also gaining traction in response to environmental concerns.

Key players

  • Scania AB
  • Volvo
  • Mercedes
  • Man
  • Hyundai Motor Company
  • Iveco
  • Dongfeng Motor Corporation
  • Tata Motors Limited
  • The Knap Heide Manufacturing Company
  • Custom Truck One Source

Competitive Analysis

The tanker truck market is highly competitive, with key players like Scania AB, Volvo, Mercedes, and Hyundai Motor Company leading in terms of technological innovation, product offerings, and market reach. Scania AB, known for its fuel-efficient engines and advanced safety features, remains a strong contender, while Volvo and Mercedes have established themselves with their premium product lines and robust service networks. Hyundai Motor Company offers a cost-effective alternative with a focus on emerging markets, while Iveco and Dongfeng Motor Corporation cater to a broader geographical range with reliable, durable trucks suitable for various applications. Tata Motors and Custom Truck One Source offer customization options and are gaining market share through specialized solutions for niche sectors. The competition is marked by constant advancements in safety, fuel efficiency, and regulatory compliance, driving product innovation and shaping market dynamics.

Recent Developments

  • In November 2023, Scania launched the 2024 Scania 770, a flagship model featuring a powerful 770 horsepower engine and advanced safety technologies such as adaptive cruise control and lane-keeping assist. This model is designed to enhance performance and driver comfort while setting new standards for heavy-duty trucks in the transportation industry.
  • In October 2023, Volvo unveiled its new Volvo FH Electric model, which is specifically designed for heavy-duty electric transport. This model emphasizes sustainability with zero tailpipe emissions and is aimed at urban logistics and regional distribution, reflecting Volvo’s commitment to electrification in the trucking sector.
  • In September 2023, Mercedes-Benz launched the Actros L, a new version of its flagship truck that includes enhanced fuel efficiency features and advanced driver assistance systems. This model is aimed at improving safety and operational efficiency for long-haul transportation.
  • In July 2023, Hyundai launched its new line of Xcient Fuel Cell trucks, which are designed for heavy-duty transport with hydrogen fuel cell technology. This initiative marks Hyundai’s entry into sustainable logistics solutions within the tanker truck market.
  • In April 2023, Tata Motors launched its new range of Ultra Tanker Trucks, focusing on fuel efficiency and advanced safety features. These trucks are tailored for the Indian market, catering to both urban and rural transportation needs.
  • In February 2023, Custom Truck One Source announced the expansion of its product line with new custom tanker trucks equipped with advanced telematics systems for improved fleet management. This development aims to enhance operational efficiency for customers in the liquid transportation sector.

Market Concentration and Characteristics 

The tanker trucks market is moderately concentrated, with a mix of global leaders and regional players competing for market share. Major players such as Scania AB, Volvo, Mercedes, and Hyundai Motor Company dominate the market, leveraging their advanced technological capabilities, strong brand recognition, and extensive service networks. These companies primarily focus on innovation in safety, fuel efficiency, and regulatory compliance to meet the growing demand for eco-friendly and cost-effective solutions. However, there is also room for regional players like Tata Motors, Dongfeng Motor Corporation, and Custom Truck One Source, which cater to specific geographic markets or offer specialized customization for niche applications. The market is characterized by ongoing product innovation, price competition, and a focus on providing tailored solutions for industries like oil and gas, chemicals, agriculture, and construction. The increasing demand for regulatory-compliant and environmentally sustainable tanker trucks is pushing both global and local players to adapt their strategies to meet evolving market needs.

Shape Your Report to Specific Countries or Regions & Enjoy 30% Off!

Report Coverage

The research report offers an in-depth analysis based on Product, Application, End-User, Capacity and Region. It details leading market players, providing an overview of their business, product offerings, investments, revenue streams, and key applications. Additionally, the report includes insights into the competitive environment, SWOT analysis, current market trends, as well as the primary drivers and constraints. Furthermore, it discusses various factors that have driven market expansion in recent years. The report also explores market dynamics, regulatory scenarios, and technological advancements that are shaping the industry. It assesses the impact of external factors and global economic changes on market growth. Lastly, it provides strategic recommendations for new entrants and established companies to navigate the complexities of the market.

Future Outlook

  1. The Asia-Pacific and Latin American regions are expected to witness rapid growth in tanker truck demand, driven by industrialization and infrastructure development. Emerging economies will fuel the need for bulk liquid transportation in sectors like oil, gas, and agriculture.
  2. With the increasing focus on sustainability, the tanker trucks market will see more adoption of electric and hybrid vehicles. This transition will reduce emissions and operational costs in the long run, aligning with global environmental goals.
  3. Stricter safety standards, particularly in the transportation of hazardous materials, will drive demand for advanced tanker truck designs. Manufacturers will innovate to meet evolving compliance requirements in key markets like North America and Europe.
  4. The integration of telematics and IoT technologies into tanker trucks will enable real-time tracking, fuel optimization, and predictive maintenance. This will improve fleet efficiency and reduce operational downtime.
  5. The need for specialized tanker trucks will increase as industries require vehicles designed for transporting food-grade liquids, chemicals, and other specialized materials. Customization will be a key growth driver in niche applications.
  6. The tanker truck market will see increased mergers and acquisitions, as companies seek to expand their geographic footprint and product offerings. Strategic partnerships will enhance R&D capabilities and market access.
  7. As fuel costs continue to rise, manufacturers will prioritize the development of fuel-efficient engines and lightweight materials to improve tanker truck performance. This will help operators reduce their overall costs.
  8. The future of tanker trucks may include automation and autonomous driving technologies. These innovations will increase safety, optimize routes, and reduce human errors in long-haul transportation.
  9. The rise of e-commerce and fast-moving consumer goods will drive demand for tanker trucks in logistics and supply chain operations. Faster deliveries and bulk transport of liquids will become more critical in meeting market demands.
  10. Governments worldwide will continue to enforce stricter environmental regulations, pushing the tanker truck market toward adopting more sustainable practices. Compliance with these regulations will be critical for companies to maintain their market presence.

Table of Content
CHAPTER NO. 1 : INTRODUCTION 31
1.1.1. Report Description 31
Purpose of the Report 31
USP & Key Offerings 31
1.1.2. Key Benefits for Stakeholders 31
1.1.3. Target Audience 32
1.1.4. Report Scope 32
1.1.5. Regional Scope 33
CHAPTER NO. 2 : EXECUTIVE SUMMARY 33
2.1. Tanker Trucks Market Snapshot 33
2.1.1. Global Tanker Trucks Market, 2018 – 2032 (Unit) (USD Million) 36
2.2. Insights from Primary Respondents 36
CHAPTER NO. 3 : GEOPOLITICAL CRISIS IMPACT ANALYSIS 37
3.1. Russia-Ukraine and Israel-Palestine War Impacts 37
CHAPTER NO. 4 : TANKER TRUCKS MARKET – INDUSTRY ANALYSIS 38
4.1. Introduction 38
4.2. Market Drivers 39
4.2.1. Driving Factor 1 Analysis 39
4.2.2. Driving Factor 2 Analysis 40
4.3. Market Restraints 41
4.3.1. Restraining Factor Analysis 41
4.4. Market Opportunities 42
4.4.1. Market Opportunity Analysis 42
4.5. Porter’s Five Forces Analysis 43
CHAPTER NO. 5 : ANALYSIS COMPETITIVE LANDSCAPE 44
5.1. Company Market Share Analysis – 2023 44
5.1.1. Global Tanker Trucks Market: Company Market Share, by Volume, 2023 44
5.1.2. Global Tanker Trucks Market: Company Market Share, by Revenue, 2023 45
5.1.3. Global Tanker Trucks Market: Top 6 Company Market Share, by Revenue, 2023 45
5.1.4. Global Tanker Trucks Market: Top 3 Company Market Share, by Revenue, 2023 45
5.2. Global Tanker Trucks Market Company Volume Market Share, 2023 47
5.3. Company Assessment Metrics, 2023 48
5.3.1. Stars 48
5.3.2. Emerging Leaders 48
5.3.3. Pervasive Players 48
5.3.4. Participants 48
5.4. Start-ups /SMEs Assessment Metrics, 2023 48
5.4.1. Progressive Companies 48
5.4.2. Responsive Companies 48
5.4.3. Dynamic Companies 48
5.4.4. Starting Blocks 48
5.5. Strategic Developments 49
5.5.1. Acquisitions & Mergers 49
New Product Launch 49
Regional Expansion 49
5.6. Key Players Product Matrix 50
CHAPTER NO. 6 : PESTEL & ADJACENT MARKET ANALYSIS 51
6.1. PESTEL 51
6.1.1. Political Factors 51
6.1.2. Economic Factors 51
6.1.3. Social Factors 51
6.1.4. Technological Factors 51
6.1.5. Environmental Factors 51
6.1.6. Legal Factors 51
6.2. Adjacent Market Analysis 51
CHAPTER NO. 7 : TANKER TRUCKS MARKET – BY PRODUCT SEGMENT ANALYSIS 52
7.1. Tanker Trucks Market Overview, by Product Segment 52
7.1.1. Tanker Trucks Market Volume Share, By Product, 2023 & 2032 53
7.1.2. Tanker Trucks Market Revenue Share, By Product, 2023 & 2032 53
7.1.3. Tanker Trucks Market Attractiveness Analysis, By Product 54
7.1.4. Incremental Revenue Growth Opportunity, by Product, 2024 – 2032 54
7.1.5. Tanker Trucks Market Revenue, By Product, 2018, 2023, 2027 & 2032 55
7.2. Rigid tanker trucks 56
7.2.1. Global Rigid tanker trucks Tanker Trucks Market Volume & Revenue, By Region, 2018 – 2023 (Unit) (USD Million) 57
7.2.2. Global Rigid tanker trucks Tanker Trucks Market Volume & Revenue, By Region, 2024 – 2032 (Unit) (USD Million) 57
7.3. Articulated tanker trucks 58
7.3.1. Global Articulated tanker trucks Tanker Trucks Market Volume & Revenue, By Region, 2018 – 2023 (Unit) (USD Million) 59
7.3.2. Global Articulated tanker trucks Tanker Trucks Market Volume & Revenue, By Region, 2024 – 2032 (Unit) (USD Million) 59
CHAPTER NO. 8 : TANKER TRUCKS MARKET – BY APPLICATION SEGMENT ANALYSIS 60
8.1. Tanker Trucks Market Overview, by Application Segment 60
8.1.1. Tanker Trucks Market Volume Share, By Application, 2023 & 2032 61
8.1.2. Tanker Trucks Market Revenue Share, By Application, 2023 & 2032 61
8.1.3. Tanker Trucks Market Attractiveness Analysis, By Application 62
8.1.4. Incremental Revenue Growth Opportunity, by Application, 2024 – 2032 62
8.1.5. Tanker Trucks Market Revenue, By Application, 2018, 2023, 2027 & 2032 63
8.2. Municipal water supply 64
8.2.1. Global Municipal water supply Tanker Trucks Market Volume & Revenue, By Region, 2018 – 2023 (Unit) (USD Million) 65
8.2.2. Global Municipal water supply Tanker Trucks Market Volume & Revenue, By Region, 2024 – 2032 (Unit) (USD Million) 65
8.3. Construction 66
8.3.1. Global Construction Tanker Trucks Market Volume & Revenue, By Region, 2018 – 2023 (Unit) (USD Million) 67
8.3.2. Global Construction Tanker Trucks Market Volume & Revenue, By Region, 2024 – 2032 (Unit) (USD Million) 67
8.4. Mining 68
8.5. Global Mining Tanker Trucks Market Volume & Revenue, By Region, 2018 – 2023 (Unit) (USD Million) 69
8.6. Global Mining Tanker Trucks Market Volume & Revenue, By Region, 2024 – 2032 (Unit) (USD Million) 69
8.7. Waste management 70
8.7.1. Global Waste management Tanker Trucks Market Volume & Revenue, By Region, 2018 – 2023 (Unit) (USD Million) 71
8.7.2. Global Waste management Tanker Trucks Market Volume & Revenue, By Region, 2024 – 2032 (Unit) (USD Million) 71
8.8. Others 72
8.8.1. Global Others Tanker Trucks Market Volume & Revenue, By Region, 2018 – 2023 (Unit) (USD Million) 73
8.8.2. Global Others Tanker Trucks Market Volume & Revenue, By Region, 2024 – 2032 (Unit) (USD Million) 73
CHAPTER NO. 9 : TANKER TRUCKS MARKET – BY END-USER SEGMENT ANALYSIS 74
9.1. Tanker Trucks Market Overview, by End-user Segment 74
9.1.1. Tanker Trucks Market Volume Share, By End-user, 2023 & 2032 75
9.1.2. Tanker Trucks Market Revenue Share, By End-user, 2023 & 2032 75
9.1.3. Tanker Trucks Market Attractiveness Analysis, By End-user 76
9.1.4. Incremental Revenue Growth Opportunity, by End-user, 2024 – 2032 76
9.1.5. Tanker Trucks Market Revenue, By End-user, 2018, 2023, 2027 & 2032 77
9.2. Industrial 78
9.2.1. Global Industrial Tanker Trucks Market Volume & Revenue, By Region, 2018 – 2023 (Unit) (USD Million) 79
9.2.2. Global Industrial Tanker Trucks Market Volume & Revenue, By Region, 2024 – 2032 (Unit) (USD Million) 79
9.3. Commercial 80
9.3.1. Global Commercial Tanker Trucks Market Volume & Revenue, By Region, 2018 – 2023 (Unit) (USD Million) 81
9.3.2. Global Commercial Tanker Trucks Market Volume & Revenue, By Region, 2024 – 2032 (Unit) (USD Million) 81
9.4. Government 82
9.5. Global Government Tanker Trucks Market Volume & Revenue, By Region, 2018 – 2023 (Unit) (USD Million) 83
9.6. Global Government Tanker Trucks Market Volume & Revenue, By Region, 2024 – 2032 (Unit) (USD Million) 83
9.7. Agriculture 84
9.7.1. Global Agriculture Tanker Trucks Market Volume & Revenue, By Region, 2018 – 2023 (Unit) (USD Million) 85
9.7.2. Global Agriculture Tanker Trucks Market Volume & Revenue, By Region, 2024 – 2032 (Unit) (USD Million) 85
9.8. Others 86
9.8.1. Global Others Tanker Trucks Market Volume & Revenue, By Region, 2018 – 2023 (Unit) (USD Million) 87
9.8.2. Global Others Tanker Trucks Market Volume & Revenue, By Region, 2024 – 2032 (Unit) (USD Million) 87
CHAPTER NO. 10 : TANKER TRUCKS MARKET – BY CAPACITY SEGMENT ANALYSIS 88
10.1. Tanker Trucks Market Overview, by Capacity Segment 88
10.1.1. Tanker Trucks Market Volume Share, By Capacity, 2023 & 2032 89
10.1.2. Tanker Trucks Market Revenue Share, By Capacity, 2023 & 2032 89
10.1.3. Tanker Trucks Market Attractiveness Analysis, By Capacity 90
10.1.4. Incremental Revenue Growth Opportunity, by Capacity, 2024 – 2032 90
10.1.5. Tanker Trucks Market Revenue, By Capacity, 2018, 2023, 2027 & 2032 91
10.2. Below 5,000 gallons 92
10.2.1. Global Below 5,000 gallons Tanker Trucks Market Volume & Revenue, By Region, 2018 – 2023 (Unit) (USD Million) 93
10.2.2. Global Below 5,000 gallons Tanker Trucks Market Volume & Revenue, By Region, 2024 – 2032 (Unit) (USD Million) 93
10.3. 5,001 – 10,000 gallons 94
10.3.1. Global 5,001 – 10,000 gallons Tanker Trucks Market Volume & Revenue, By Region, 2018 – 2023 (Unit) (USD Million) 95
10.3.2. Global 5,001 – 10,000 gallons Tanker Trucks Market Volume & Revenue, By Region, 2024 – 2032 (Unit) (USD Million) 95
10.4. 10,000 – 15,000 gallons 96
10.5. Global 10,000 – 15,000 gallons Tanker Trucks Market Volume & Revenue, By Region, 2018 – 2023 (Unit) (USD Million) 97
10.6. Global 10,000 – 15,000 gallons Tanker Trucks Market Volume & Revenue, By Region, 2024 – 2032 (Unit) (USD Million) 97
10.7. 15,000 – 20,000 gallons 98
10.7.1. Global 15,000 – 20,000 gallons Tanker Trucks Market Volume & Revenue, By Region, 2018 – 2023 (Unit) (USD Million) 99
10.7.2. Global 15,000 – 20,000 gallons Tanker Trucks Market Volume & Revenue, By Region, 2024 – 2032 (Unit) (USD Million) 99
10.8. Above 20,000 gallons 100
10.8.1. Global Above 20,000 gallons Tanker Trucks Market Volume & Revenue, By Region, 2018 – 2023 (Unit) (USD Million) 101
10.8.2. Global Above 20,000 gallons Tanker Trucks Market Volume & Revenue, By Region, 2024 – 2032 (Unit) (USD Million) 101
CHAPTER NO. 11 : TANKER TRUCKS MARKET – REGIONAL ANALYSIS 102
11.1. Tanker Trucks Market Overview, by Regional Segments 102
11.2. Region 103
11.2.1. Global Tanker Trucks Market Volume Share, By Region, 2023 & 2032 103
11.2.2. Global Tanker Trucks Market Revenue Share, By Region, 2023 & 2032 103
11.2.3. Tanker Trucks Market Attractiveness Analysis, By Region 104
11.2.4. Incremental Revenue Growth Opportunity, by Region, 2024 – 2032 104
11.2.5. Tanker Trucks Market Revenue, By Region, 2018, 2023, 2027 & 2032 105
11.2.6. Global Tanker Trucks Market Volume & Revenue, By Region, 2018 – 2023 (Unit) (USD Million) 106
11.2.7. Global Tanker Trucks Market Volume & Revenue, By Region, 2024 – 2032 (Unit) (USD Million) 106
11.3. Product 107
11.3.1. Global Tanker Trucks Market Volume & Revenue, By Product, 2018 – 2023 (Unit) (USD Million) 107
11.4. Global Tanker Trucks Market Volume & Revenue, By Product, 2024 – 2032 (Unit) (USD Million) 107
11.5. Application 108
11.5.1. Global Tanker Trucks Market Volume & Revenue, By Application, 2018 – 2023 (Unit) (USD Million) 108
11.5.2. Global Tanker Trucks Market Volume & Revenue, By Application, 2024 – 2032 (Unit) (USD Million) 108
11.6. End-user 109
11.6.1. Global Tanker Trucks Market Volume & Revenue, By End-user, 2018 – 2023 (Unit) (USD Million) 109
11.6.2. Global Tanker Trucks Market Volume & Revenue, By End-user, 2024 – 2032 (Unit) (USD Million) 109
11.7. Capacity 110
11.7.1. Global Tanker Trucks Market Volume & Revenue, By Capacity, 2018 – 2023 (Unit) (USD Million) 110
11.7.2. Global Tanker Trucks Market Volume & Revenue, By Capacity, 2024 – 2032 (Unit) (USD Million) 110
CHAPTER NO. 12 : TANKER TRUCKS MARKET – NORTH AMERICA 111
12.1. North America 111
12.1.1. Key Highlights 111
12.1.2. North America Tanker Trucks Market Volume, By Country, 2018 – 2032 (Unit) 112
12.1.3. North America Tanker Trucks Market Revenue, By Country, 2018 – 2023 (USD Million) 113
12.1.4. North America Tanker Trucks Market Volume, By Product, 2018 – 2023 (Unit) 114
12.1.5. North America Tanker Trucks Market Revenue, By Product, 2018 – 2023 (USD Million) 115
12.1.6. North America Tanker Trucks Market Volume, By Application, 2018 – 2023 (Unit) 116
12.1.7. North America Tanker Trucks Market Revenue, By Application, 2018 – 2023 (USD Million) 117
12.1.8. North America Tanker Trucks Market Volume, By End-user, 2018 – 2023 (Unit) 118
12.1.9. North America Tanker Trucks Market Revenue, By End-user, 2018 – 2023 (USD Million) 119
12.1.10. North America Tanker Trucks Market Volume, By Capacity, 2018 – 2023 (Unit) 120
12.1.11. North America Tanker Trucks Market Revenue, By Capacity, 2018 – 2023 (USD Million) 121
12.2. U.S. 122
12.3. Canada 122
12.4. Mexico 122
CHAPTER NO. 13 : TANKER TRUCKS MARKET – EUROPE 123
13.1. Europe 123
13.1.1. Key Highlights 123
13.1.2. Europe Tanker Trucks Market Volume, By Country, 2018 – 2032 (Unit) 124
13.1.3. Europe Tanker Trucks Market Revenue, By Country, 2018 – 2023 (USD Million) 125
13.1.4. Europe Tanker Trucks Market Volume, By Product, 2018 – 2023 (Unit) 126
13.1.5. Europe Tanker Trucks Market Revenue, By Product, 2018 – 2023 (USD Million) 127
13.1.6. Europe Tanker Trucks Market Volume, By Application, 2018 – 2023 (Unit) 128
13.1.7. Europe Tanker Trucks Market Revenue, By Application, 2018 – 2023 (USD Million) 129
13.1.8. Europe Tanker Trucks Market Volume, By End-user, 2018 – 2023 (Unit) 130
13.1.9. Europe Tanker Trucks Market Revenue, By End-user, 2018 – 2023 (USD Million) 131
13.1.10. Europe Tanker Trucks Market Volume, By Capacity, 2018 – 2023 (Unit) 132
13.1.11. Europe Tanker Trucks Market Revenue, By Capacity, 2018 – 2023 (USD Million) 133
13.2. UK 134
13.3. France 134
13.4. Germany 134
13.5. Italy 134
13.6. Spain 134
13.7. Russia 134
13.8. Belgium 134
13.9. Netherland 134
13.10. Austria 134
13.11. Sweden 134
13.12. Poland 134
13.13. Denmark 134
13.14. Switzerland 134
13.15. Rest of Europe 134
CHAPTER NO. 14 : TANKER TRUCKS MARKET – ASIA PACIFIC 135
14.1. Asia Pacific 135
14.1.1. Key Highlights 135
14.1.2. Asia Pacific Tanker Trucks Market Volume, By Country, 2018 – 2032 (Unit) 136
14.1.3. Asia Pacific Tanker Trucks Market Revenue, By Country, 2018 – 2023 (USD Million) 137
14.1.4. Asia Pacific Tanker Trucks Market Volume, By Product, 2018 – 2023 (Unit) 138
14.1.5. Asia Pacific Tanker Trucks Market Revenue, By Product, 2018 – 2023 (USD Million) 139
14.1.6. Asia Pacific Tanker Trucks Market Volume, By Application, 2018 – 2023 (Unit) 140
14.1.7. Asia Pacific Tanker Trucks Market Revenue, By Application, 2018 – 2023 (USD Million) 141
14.1.8. Asia Pacific Tanker Trucks Market Volume, By End-user, 2018 – 2023 (Unit) 142
14.1.9. Asia Pacific Tanker Trucks Market Revenue, By End-user, 2018 – 2023 (USD Million) 143
14.1.10. Asia Pacific Tanker Trucks Market Volume, By Capacity, 2018 – 2023 (Unit) 144
14.1.11. Asia Pacific Tanker Trucks Market Revenue, By Capacity, 2018 – 2023 (USD Million) 145
14.2. China 146
14.3. Japan 146
14.4. South Korea 146
14.5. India 146
14.6. Australia 146
14.7. Thailand 146
14.8. Indonesia 146
14.9. Vietnam 146
14.10. Malaysia 146
14.11. Philippines 146
14.12. Taiwan 146
14.13. Rest of Asia Pacific 146
CHAPTER NO. 15 : TANKER TRUCKS MARKET – LATIN AMERICA 147
15.1. Latin America 147
15.1.1. Key Highlights 147
15.1.2. Latin America Tanker Trucks Market Volume, By Country, 2018 – 2032 (Unit) 148
15.1.3. Latin America Tanker Trucks Market Revenue, By Country, 2018 – 2023 (USD Million) 149
15.1.4. Latin America Tanker Trucks Market Volume, By Product, 2018 – 2023 (Unit) 150
15.1.5. Latin America Tanker Trucks Market Revenue, By Product, 2018 – 2023 (USD Million) 151
15.1.6. Latin America Tanker Trucks Market Volume, By Application, 2018 – 2023 (Unit) 152
15.1.7. Latin America Tanker Trucks Market Revenue, By Application, 2018 – 2023 (USD Million) 153
15.1.8. Latin America Tanker Trucks Market Volume, By End-user, 2018 – 2023 (Unit) 154
15.1.9. Latin America Tanker Trucks Market Revenue, By End-user, 2018 – 2023 (USD Million) 155
15.1.10. Latin America Tanker Trucks Market Volume, By Capacity, 2018 – 2023 (Unit) 156
15.1.11. Latin America Tanker Trucks Market Revenue, By Capacity, 2018 – 2023 (USD Million) 157
15.2. Brazil 158
15.3. Argentina 158
15.4. Peru 158
15.5. Chile 158
15.6. Colombia 158
15.7. Rest of Latin America 158
CHAPTER NO. 16 : TANKER TRUCKS MARKET – MIDDLE EAST 159
16.1. Middle East 159
16.1.1. Key Highlights 159
16.1.2. Middle East Tanker Trucks Market Volume, By Country, 2018 – 2032 (Unit) 160
16.1.3. Middle East Tanker Trucks Market Revenue, By Country, 2018 – 2023 (USD Million) 161
16.1.4. Middle East Tanker Trucks Market Volume, By Product, 2018 – 2023 (Unit) 162
16.1.5. Middle East Tanker Trucks Market Revenue, By Product, 2018 – 2023 (USD Million) 163
16.1.6. Middle East Tanker Trucks Market Volume, By Application, 2018 – 2023 (Unit) 164
16.1.7. Middle East Tanker Trucks Market Revenue, By Application, 2018 – 2023 (USD Million) 165
16.1.8. Middle East Tanker Trucks Market Volume, By End-user, 2018 – 2023 (Unit) 166
16.1.9. Middle East Tanker Trucks Market Revenue, By End-user, 2018 – 2023 (USD Million) 167
16.1.10. Middle East Tanker Trucks Market Volume, By Capacity, 2018 – 2023 (Unit) 168
16.1.11. Middle East Tanker Trucks Market Revenue, By Capacity, 2018 – 2023 (USD Million) 169
16.2. UAE 170
16.3. KSA 170
16.4. Israel 170
16.5. Turkey 170
16.6. Iran 170
16.7. Rest of Middle East 170
CHAPTER NO. 17 : TANKER TRUCKS MARKET – AFRICA 171
17.1. Africa 171
17.1.1. Key Highlights 171
17.1.2. Africa Tanker Trucks Market Volume, By Country, 2018 – 2032 (Unit) 172
17.1.3. Africa Tanker Trucks Market Revenue, By Country, 2018 – 2023 (USD Million) 173
17.1.4. Africa Tanker Trucks Market Volume, By Product, 2018 – 2023 (Unit) 174
17.1.5. Africa Tanker Trucks Market Revenue, By Product, 2018 – 2023 (USD Million) 175
17.1.6. Africa Tanker Trucks Market Volume, By Application, 2018 – 2023 (Unit) 176
17.1.7. Africa Tanker Trucks Market Revenue, By Application, 2018 – 2023 (USD Million) 177
17.1.8. Africa Tanker Trucks Market Volume, By End-user, 2018 – 2023 (Unit) 178
17.1.9. Africa Tanker Trucks Market Revenue, By End-user, 2018 – 2023 (USD Million) 179
17.1.10. Africa Tanker Trucks Market Volume, By Capacity, 2018 – 2023 (Unit) 180
17.1.11. Africa Tanker Trucks Market Revenue, By Capacity, 2018 – 2023 (USD Million) 181
17.2. Egypt 182
17.3. Nigeria 182
17.4. Algeria 182
17.5. Morocco 182
17.6. Rest of Africa 182
CHAPTER NO. 18 : COMPANY PROFILES 183
18.1. Scania AB 183
18.1.1. Company Overview 183
18.1.2. Product Portfolio 183
18.1.3. Swot Analysis 183
18.1.4. Business Strategy 183
18.1.5. Financial Overview 184
18.2. Volvo 185
18.3. Mercedez 185
18.4. Man 185
18.5. Hyundai Motor Company 185
18.6. Iveco 185
18.7. Dongfeng Motor Corporation 185
18.8. Tata Motors Limited 185
18.9. The Knap Heide Manufacturing Company 185
18.10. Custom Truck One Source 185

List of Figures
FIG NO. 1. Global Tanker Trucks Market Volume & Revenue, 2018 – 2032 (Unit) (USD Million) 36
FIG NO. 2. Porter’s Five Forces Analysis for Global Tanker Trucks Market 43
FIG NO. 3. Company Share Analysis, 2023 44
FIG NO. 4. Company Share Analysis, 2023 45
FIG NO. 5. Company Share Analysis, 2023 45
FIG NO. 6. Company Share Analysis, 2023 45
FIG NO. 7. Tanker Trucks Market – Company Volume Market Share, 2023 47
FIG NO. 8. Tanker Trucks Market Volume Share, By Product, 2023 & 2032 53
FIG NO. 9. Tanker Trucks Market Revenue Share, By Product, 2023 & 2032 53
FIG NO. 10. Market Attractiveness Analysis, By Product 54
FIG NO. 11. Incremental Revenue Growth Opportunity by Product, 2024 – 2032 54
FIG NO. 12. Tanker Trucks Market Revenue, By Product, 2018, 2023, 2027 & 2032 55
FIG NO. 13. Global Tanker Trucks Market for Rigid tanker trucks, Volume & Revenue (Unit) (USD Million) 2018 – 2032 56
FIG NO. 14. Global Tanker Trucks Market for Articulated tanker trucks, Volume & Revenue (Unit) (USD Million) 2018 – 2032 58
FIG NO. 15. Tanker Trucks Market Volume Share, By Application, 2023 & 2032 61
FIG NO. 16. Tanker Trucks Market Revenue Share, By Application, 2023 & 2032 61
FIG NO. 17. Market Attractiveness Analysis, By Application 62
FIG NO. 18. Incremental Revenue Growth Opportunity by Application, 2024 – 2032 62
FIG NO. 19. Tanker Trucks Market Revenue, By Application, 2018, 2023, 2027 & 2032 63
FIG NO. 20. Global Tanker Trucks Market for Municipal water supply, Volume & Revenue (Unit) (USD Million) 2018 – 2032 64
FIG NO. 21. Global Tanker Trucks Market for Construction, Volume & Revenue (Unit) (USD Million) 2018 – 2032 66
FIG NO. 22. Global Tanker Trucks Market for Mining, Volume & Revenue (Unit) (USD Million) 2018 – 2032 68
FIG NO. 23. Global Tanker Trucks Market for Waste management, Volume & Revenue (Unit) (USD Million) 2018 – 2032 70
FIG NO. 24. Global Tanker Trucks Market for Others, Volume & Revenue (Unit) (USD Million) 2018 – 2032 72
FIG NO. 25. Tanker Trucks Market Volume Share, By End-user, 2023 & 2032 75
FIG NO. 26. Tanker Trucks Market Revenue Share, By End-user, 2023 & 2032 75
FIG NO. 27. Market Attractiveness Analysis, By End-user 76
FIG NO. 28. Incremental Revenue Growth Opportunity by End-user, 2024 – 2032 76
FIG NO. 29. Tanker Trucks Market Revenue, By End-user, 2018, 2023, 2027 & 2032 77
FIG NO. 30. Global Tanker Trucks Market for Industrial, Volume & Revenue (Unit) (USD Million) 2018 – 2032 78
FIG NO. 31. Global Tanker Trucks Market for Commercial, Volume & Revenue (Unit) (USD Million) 2018 – 2032 80
FIG NO. 32. Global Tanker Trucks Market for Government, Volume & Revenue (Unit) (USD Million) 2018 – 2032 82
FIG NO. 33. Global Tanker Trucks Market for Agriculture, Volume & Revenue (Unit) (USD Million) 2018 – 2032 84
FIG NO. 34. Global Tanker Trucks Market for Others, Volume & Revenue (Unit) (USD Million) 2018 – 2032 86
FIG NO. 35. Tanker Trucks Market Volume Share, By Capacity, 2023 & 2032 89
FIG NO. 36. Tanker Trucks Market Revenue Share, By Capacity, 2023 & 2032 89
FIG NO. 37. Market Attractiveness Analysis, By Capacity 90
FIG NO. 38. Incremental Revenue Growth Opportunity by Capacity, 2024 – 2032 90
FIG NO. 39. Tanker Trucks Market Revenue, By Capacity, 2018, 2023, 2027 & 2032 91
FIG NO. 40. Global Tanker Trucks Market for Below 5,000 gallons, Volume & Revenue (Unit) (USD Million) 2018 – 2032 92
FIG NO. 41. Global Tanker Trucks Market for 5,001 – 10,000 gallons, Volume & Revenue (Unit) (USD Million) 2018 – 2032 94
FIG NO. 42. Global Tanker Trucks Market for 10,000 – 15,000 gallons, Volume & Revenue (Unit) (USD Million) 2018 – 2032 96
FIG NO. 43. Global Tanker Trucks Market for 15,000 – 20,000 gallons, Volume & Revenue (Unit) (USD Million) 2018 – 2032 98
FIG NO. 44. Global Tanker Trucks Market for Above 20,000 gallons, Volume & Revenue (Unit) (USD Million) 2018 – 2032 100
FIG NO. 45. Global Tanker Trucks Market Volume Share, By Region, 2023 & 2032 103
FIG NO. 46. Global Tanker Trucks Market Revenue Share, By Region, 2023 & 2032 103
FIG NO. 47. Market Attractiveness Analysis, By Region 104
FIG NO. 48. Incremental Revenue Growth Opportunity by Region, 2024 – 2032 104
FIG NO. 49. Tanker Trucks Market Revenue, By Region, 2018, 2023, 2027 & 2032 105
FIG NO. 50. North America Tanker Trucks Market Volume & Revenue, 2018 – 2032 (Unit) (USD Million) 111
FIG NO. 51. Europe Tanker Trucks Market Volume & Revenue, 2018 – 2032 (Unit) (USD Million) 123
FIG NO. 52. Asia Pacific Tanker Trucks Market Volume & Revenue, 2018 – 2032 (Unit) (USD Million) 135
FIG NO. 53. Latin America Tanker Trucks Market Volume & Revenue, 2018 – 2032 (Unit) (USD Million) 147
FIG NO. 54. Middle East Tanker Trucks Market Volume & Revenue, 2018 – 2032 (Unit) (USD Million) 159
FIG NO. 55. Africa Tanker Trucks Market Volume & Revenue, 2018 – 2032 (Unit) (USD Million) 171

List of Tables
TABLE NO. 1. : Global Tanker Trucks Market: Snapshot 32
TABLE NO. 2. : Drivers for the Tanker Trucks Market: Impact Analysis 37
TABLE NO. 3. : Restraints for the Tanker Trucks Market: Impact Analysis 39
TABLE NO. 4. : Global Rigid tanker trucks Tanker Trucks Market Volume & Revenue, By Region, 2018 – 2023 (Unit) (USD Million) 55
TABLE NO. 5. : Global Rigid tanker trucks Tanker Trucks Market Volume & Revenue, By Region, 2024 – 2032 (Unit) (USD Million) 55
TABLE NO. 6. : Global Articulated tanker trucks Tanker Trucks Market Volume & Revenue, By Region, 2018 – 2023 (Unit) (USD Million) 57
TABLE NO. 7. : Global Articulated tanker trucks Tanker Trucks Market Volume & Revenue, By Region, 2024 – 2032 (Unit) (USD Million) 57
TABLE NO. 8. : Global Municipal water supply Tanker Trucks Market Volume & Revenue, By Region, 2018 – 2023 (Unit) (USD Million) 63
TABLE NO. 9. : Global Municipal water supply Tanker Trucks Market Volume & Revenue, By Region, 2024 – 2032 (Unit) (USD Million) 63
TABLE NO. 10. : Global Construction Tanker Trucks Market Volume & Revenue, By Region, 2018 – 2023 (Unit) (USD Million) 65
TABLE NO. 11. : Global Construction Tanker Trucks Market Volume & Revenue, By Region, 2024 – 2032 (Unit) (USD Million) 65
TABLE NO. 12. : Global Mining Tanker Trucks Market Volume & Revenue, By Region, 2018 – 2023 (Unit) (USD Million) 67
TABLE NO. 13. : Global Mining Tanker Trucks Market Volume & Revenue, By Region, 2024 – 2032 (Unit) (USD Million) 67
TABLE NO. 14. : Global Waste management Tanker Trucks Market Volume & Revenue, By Region, 2018 – 2023 (Unit) (USD Million) 69
TABLE NO. 15. : Global Waste management Tanker Trucks Market Volume & Revenue, By Region, 2024 – 2032 (Unit) (USD Million) 69
TABLE NO. 16. : Global Others Tanker Trucks Market Volume & Revenue, By Region, 2018 – 2023 (Unit) (USD Million) 71
TABLE NO. 17. : Global Others Tanker Trucks Market Volume & Revenue, By Region, 2024 – 2032 (Unit) (USD Million) 71
TABLE NO. 18. : Global Industrial Tanker Trucks Market Volume & Revenue, By Region, 2018 – 2023 (Unit) (USD Million) 77
TABLE NO. 19. : Global Industrial Tanker Trucks Market Volume & Revenue, By Region, 2024 – 2032 (Unit) (USD Million) 77
TABLE NO. 20. : Global Commercial Tanker Trucks Market Volume & Revenue, By Region, 2018 – 2023 (Unit) (USD Million) 79
TABLE NO. 21. : Global Commercial Tanker Trucks Market Volume & Revenue, By Region, 2024 – 2032 (Unit) (USD Million) 79
TABLE NO. 22. : Global Government Tanker Trucks Market Volume & Revenue, By Region, 2018 – 2023 (Unit) (USD Million) 81
TABLE NO. 23. : Global Government Tanker Trucks Market Volume & Revenue, By Region, 2024 – 2032 (Unit) (USD Million) 81
TABLE NO. 24. : Global Agriculture Tanker Trucks Market Volume & Revenue, By Region, 2018 – 2023 (Unit) (USD Million) 83
TABLE NO. 25. : Global Agriculture Tanker Trucks Market Volume & Revenue, By Region, 2024 – 2032 (Unit) (USD Million) 83
TABLE NO. 26. : Global Others Tanker Trucks Market Volume & Revenue, By Region, 2018 – 2023 (Unit) (USD Million) 85
TABLE NO. 27. : Global Others Tanker Trucks Market Volume & Revenue, By Region, 2024 – 2032 (Unit) (USD Million) 85
TABLE NO. 28. : Global Below 5,000 gallons Tanker Trucks Market Volume & Revenue, By Region, 2018 – 2023 (Unit) (USD Million) 91
TABLE NO. 29. : Global Below 5,000 gallons Tanker Trucks Market Volume & Revenue, By Region, 2024 – 2032 (Unit) (USD Million) 91
TABLE NO. 30. : Global 5,001 – 10,000 gallons Tanker Trucks Market Volume & Revenue, By Region, 2018 – 2023 (Unit) (USD Million) 93
TABLE NO. 31. : Global 5,001 – 10,000 gallons Tanker Trucks Market Volume & Revenue, By Region, 2024 – 2032 (Unit) (USD Million) 93
TABLE NO. 32. : Global 10,000 – 15,000 gallons Tanker Trucks Market Volume & Revenue, By Region, 2018 – 2023 (Unit) (USD Million) 95
TABLE NO. 33. : Global 10,000 – 15,000 gallons Tanker Trucks Market Volume & Revenue, By Region, 2024 – 2032 (Unit) (USD Million) 95
TABLE NO. 34. : Global 15,000 – 20,000 gallons Tanker Trucks Market Volume & Revenue, By Region, 2018 – 2023 (Unit) (USD Million) 97
TABLE NO. 35. : Global 15,000 – 20,000 gallons Tanker Trucks Market Volume & Revenue, By Region, 2024 – 2032 (Unit) (USD Million) 97
TABLE NO. 36. : Global Above 20,000 gallons Tanker Trucks Market Volume & Revenue, By Region, 2018 – 2023 (Unit) (USD Million) 99
TABLE NO. 37. : Global Above 20,000 gallons Tanker Trucks Market Volume & Revenue, By Region, 2024 – 2032 (Unit) (USD Million) 99
TABLE NO. 38. : Global Tanker Trucks Market Volume & Revenue, By Region, 2018 – 2023 (Unit) (USD Million) 104
TABLE NO. 39. : Global Tanker Trucks Market Volume & Revenue, By Region, 2024 – 2032 (Unit) (USD Million) 104
TABLE NO. 40. : Global Tanker Trucks Market Volume & Revenue, By Product, 2018 – 2023 (Unit) (USD Million) 105
TABLE NO. 41. : Global Tanker Trucks Market Volume & Revenue, By Product, 2024 – 2032 (Unit) (USD Million) 105
TABLE NO. 42. : Global Tanker Trucks Market Volume & Revenue, By Application, 2018 – 2023 (Unit) (USD Million) 106
TABLE NO. 43. : Global Tanker Trucks Market Volume & Revenue, By Application, 2024 – 2032 (Unit) (USD Million) 106
TABLE NO. 44. : Global Tanker Trucks Market Volume & Revenue, By End-user, 2018 – 2023 (Unit) (USD Million) 107
TABLE NO. 45. : Global Tanker Trucks Market Volume & Revenue, By End-user, 2024 – 2032 (Unit) (USD Million) 107
TABLE NO. 46. : Global Tanker Trucks Market Volume & Revenue, By Capacity, 2018 – 2023 (Unit) (USD Million) 108
TABLE NO. 47. : Global Tanker Trucks Market Volume & Revenue, By Capacity, 2024 – 2032 (Unit) (USD Million) 108
TABLE NO. 48. : North America Tanker Trucks Market Volume, By Country, 2018 – 2023 (Unit) 110
TABLE NO. 49. : North America Tanker Trucks Market Volume, By Country, 2024 – 2032 (Unit) 110
TABLE NO. 50. : North America Tanker Trucks Market Revenue, By Country, 2018 – 2023 (USD Million) 111
TABLE NO. 51. : North America Tanker Trucks Market Revenue, By Country, 2024 – 2032 (USD Million) 111
TABLE NO. 52. : North America Tanker Trucks Market Volume, By Product, 2018 – 2023 (Unit) 112
TABLE NO. 53. : North America Tanker Trucks Market Volume, By Product, 2024 – 2032 (Unit) 112
TABLE NO. 54. : North America Tanker Trucks Market Revenue, By Product, 2018 – 2023 (USD Million) 113
TABLE NO. 55. : North America Tanker Trucks Market Revenue, By Product, 2024 – 2032 (USD Million) 113
TABLE NO. 56. : North America Tanker Trucks Market Volume, By Application, 2018 – 2023 (Unit) 114
TABLE NO. 57. : North America Tanker Trucks Market Volume, By Application, 2024 – 2032 (Unit) 114
TABLE NO. 58. : North America Tanker Trucks Market Revenue, By Application, 2018 – 2023 (USD Million) 115
TABLE NO. 59. : North America Tanker Trucks Market Revenue, By Application, 2024 – 2032 (USD Million) 115
TABLE NO. 60. : North America Tanker Trucks Market Volume, By End-user, 2018 – 2023 (Unit) 116
TABLE NO. 61. : North America Tanker Trucks Market Volume, By End-user, 2024 – 2032 (Unit) 116
TABLE NO. 62. : North America Tanker Trucks Market Revenue, By End-user, 2018 – 2023 (USD Million) 117
TABLE NO. 63. : North America Tanker Trucks Market Revenue, By End-user, 2024 – 2032 (USD Million) 117
TABLE NO. 64. : North America Tanker Trucks Market Volume, By Capacity, 2018 – 2023 (Unit) 118
TABLE NO. 65. : North America Tanker Trucks Market Volume, By Capacity, 2024 – 2032 (Unit) 118
TABLE NO. 66. : North America Tanker Trucks Market Revenue, By Capacity, 2018 – 2023 (USD Million) 119
TABLE NO. 67. : North America Tanker Trucks Market Revenue, By Capacity, 2024 – 2032 (USD Million) 119
TABLE NO. 68. : Europe Tanker Trucks Market Volume, By Country, 2018 – 2023 (Unit) 122
TABLE NO. 69. : Europe Tanker Trucks Market Volume, By Country, 2024 – 2032 (Unit) 122
TABLE NO. 70. : Europe Tanker Trucks Market Revenue, By Country, 2018 – 2023 (USD Million) 123
TABLE NO. 71. : Europe Tanker Trucks Market Revenue, By Country, 2024 – 2032 (USD Million) 123
TABLE NO. 72. : Europe Tanker Trucks Market Volume, By Product, 2018 – 2023 (Unit) 124
TABLE NO. 73. : Europe Tanker Trucks Market Volume, By Product, 2024 – 2032 (Unit) 124
TABLE NO. 74. : Europe Tanker Trucks Market Revenue, By Product, 2018 – 2023 (USD Million) 125
TABLE NO. 75. : Europe Tanker Trucks Market Revenue, By Product, 2024 – 2032 (USD Million) 125
TABLE NO. 76. : Europe Tanker Trucks Market Volume, By Application, 2018 – 2023 (Unit) 126
TABLE NO. 77. : Europe Tanker Trucks Market Volume, By Application, 2024 – 2032 (Unit) 126
TABLE NO. 78. : Europe Tanker Trucks Market Revenue, By Application, 2018 – 2023 (USD Million) 127
TABLE NO. 79. : Europe Tanker Trucks Market Revenue, By Application, 2024 – 2032 (USD Million) 127
TABLE NO. 80. : Europe Tanker Trucks Market Volume, By End-user, 2018 – 2023 (Unit) 128
TABLE NO. 81. : Europe Tanker Trucks Market Volume, By End-user, 2024 – 2032 (Unit) 128
TABLE NO. 82. : Europe Tanker Trucks Market Revenue, By End-user, 2018 – 2023 (USD Million) 129
TABLE NO. 83. : Europe Tanker Trucks Market Revenue, By End-user, 2024 – 2032 (USD Million) 129
TABLE NO. 84. : Europe Tanker Trucks Market Volume, By Capacity, 2018 – 2023 (Unit) 130
TABLE NO. 85. : Europe Tanker Trucks Market Volume, By Capacity, 2024 – 2032 (Unit) 130
TABLE NO. 86. : Europe Tanker Trucks Market Revenue, By Capacity, 2018 – 2023 (USD Million) 131
TABLE NO. 87. : Europe Tanker Trucks Market Revenue, By Capacity, 2024 – 2032 (USD Million) 131
TABLE NO. 88. : Asia Pacific Tanker Trucks Market Volume, By Country, 2018 – 2023 (Unit) 134
TABLE NO. 89. : Asia Pacific Tanker Trucks Market Volume, By Country, 2024 – 2032 (Unit) 134
TABLE NO. 90. : Asia Pacific Tanker Trucks Market Revenue, By Country, 2018 – 2023 (USD Million) 135
TABLE NO. 91. : Asia Pacific Tanker Trucks Market Revenue, By Country, 2024 – 2032 (USD Million) 135
TABLE NO. 92. : Asia Pacific Tanker Trucks Market Volume, By Product, 2018 – 2023 (Unit) 136
TABLE NO. 93. : Asia Pacific Tanker Trucks Market Volume, By Product, 2024 – 2032 (Unit) 136
TABLE NO. 94. : Asia Pacific Tanker Trucks Market Revenue, By Product, 2018 – 2023 (USD Million) 137
TABLE NO. 95. : Asia Pacific Tanker Trucks Market Revenue, By Product, 2024 – 2032 (USD Million) 137
TABLE NO. 96. : Asia Pacific Tanker Trucks Market Volume, By Application, 2018 – 2023 (Unit) 138
TABLE NO. 97. : Asia Pacific Tanker Trucks Market Volume, By Application, 2024 – 2032 (Unit) 138
TABLE NO. 98. : Asia Pacific Tanker Trucks Market Revenue, By Application, 2018 – 2023 (USD Million) 139
TABLE NO. 99. : Asia Pacific Tanker Trucks Market Revenue, By Application, 2024 – 2032 (USD Million) 139
TABLE NO. 100. : Asia Pacific Tanker Trucks Market Volume, By End-user, 2018 – 2023 (Unit) 140
TABLE NO. 101. : Asia Pacific Tanker Trucks Market Volume, By End-user, 2024 – 2032 (Unit) 140
TABLE NO. 102. : Asia Pacific Tanker Trucks Market Revenue, By End-user, 2018 – 2023 (USD Million) 141
TABLE NO. 103. : Asia Pacific Tanker Trucks Market Revenue, By End-user, 2024 – 2032 (USD Million) 141
TABLE NO. 104. : Asia Pacific Tanker Trucks Market Volume, By Capacity, 2018 – 2023 (Unit) 142
TABLE NO. 105. : Asia Pacific Tanker Trucks Market Volume, By Capacity, 2024 – 2032 (Unit) 142
TABLE NO. 106. : Asia Pacific Tanker Trucks Market Revenue, By Capacity, 2018 – 2023 (USD Million) 143
TABLE NO. 107. : Asia Pacific Tanker Trucks Market Revenue, By Capacity, 2024 – 2032 (USD Million) 143
TABLE NO. 108. : Latin America Tanker Trucks Market Volume, By Country, 2018 – 2023 (Unit) 146
TABLE NO. 109. : Latin America Tanker Trucks Market Volume, By Country, 2024 – 2032 (Unit) 146
TABLE NO. 110. : Latin America Tanker Trucks Market Revenue, By Country, 2018 – 2023 (USD Million) 147
TABLE NO. 111. : Latin America Tanker Trucks Market Revenue, By Country, 2024 – 2032 (USD Million) 147
TABLE NO. 112. : Latin America Tanker Trucks Market Volume, By Product, 2018 – 2023 (Unit) 148
TABLE NO. 113. : Latin America Tanker Trucks Market Volume, By Product, 2024 – 2032 (Unit) 148
TABLE NO. 114. : Latin America Tanker Trucks Market Revenue, By Product, 2018 – 2023 (USD Million) 149
TABLE NO. 115. : Latin America Tanker Trucks Market Revenue, By Product, 2024 – 2032 (USD Million) 149
TABLE NO. 116. : Latin America Tanker Trucks Market Volume, By Application, 2018 – 2023 (Unit) 150
TABLE NO. 117. : Latin America Tanker Trucks Market Volume, By Application, 2024 – 2032 (Unit) 150
TABLE NO. 118. : Latin America Tanker Trucks Market Revenue, By Application, 2018 – 2023 (USD Million) 151
TABLE NO. 119. : Latin America Tanker Trucks Market Revenue, By Application, 2024 – 2032 (USD Million) 151
TABLE NO. 120. : Latin America Tanker Trucks Market Volume, By End-user, 2018 – 2023 (Unit) 152
TABLE NO. 121. : Latin America Tanker Trucks Market Volume, By End-user, 2024 – 2032 (Unit) 152
TABLE NO. 122. : Latin America Tanker Trucks Market Revenue, By End-user, 2018 – 2023 (USD Million) 153
TABLE NO. 123. : Latin America Tanker Trucks Market Revenue, By End-user, 2024 – 2032 (USD Million) 153
TABLE NO. 124. : Latin America Tanker Trucks Market Volume, By Capacity, 2018 – 2023 (Unit) 154
TABLE NO. 125. : Latin America Tanker Trucks Market Volume, By Capacity, 2024 – 2032 (Unit) 154
TABLE NO. 126. : Latin America Tanker Trucks Market Revenue, By Capacity, 2018 – 2023 (USD Million) 155
TABLE NO. 127. : Latin America Tanker Trucks Market Revenue, By Capacity, 2024 – 2032 (USD Million) 155
TABLE NO. 128. : Middle East Tanker Trucks Market Volume, By Country, 2018 – 2023 (Unit) 158
TABLE NO. 129. : Middle East Tanker Trucks Market Volume, By Country, 2024 – 2032 (Unit) 158
TABLE NO. 130. : Middle East Tanker Trucks Market Revenue, By Country, 2018 – 2023 (USD Million) 159
TABLE NO. 131. : Middle East Tanker Trucks Market Revenue, By Country, 2024 – 2032 (USD Million) 159
TABLE NO. 132. : Middle East Tanker Trucks Market Volume, By Product, 2018 – 2023 (Unit) 160
TABLE NO. 133. : Middle East Tanker Trucks Market Volume, By Product, 2024 – 2032 (Unit) 160
TABLE NO. 134. : Middle East Tanker Trucks Market Revenue, By Product, 2018 – 2023 (USD Million) 161
TABLE NO. 135. : Middle East Tanker Trucks Market Revenue, By Product, 2024 – 2032 (USD Million) 161
TABLE NO. 136. : Middle East Tanker Trucks Market Volume, By Application, 2018 – 2023 (Unit) 162
TABLE NO. 137. : Middle East Tanker Trucks Market Volume, By Application, 2024 – 2032 (Unit) 162
TABLE NO. 138. : Middle East Tanker Trucks Market Revenue, By Application, 2018 – 2023 (USD Million) 163
TABLE NO. 139. : Middle East Tanker Trucks Market Revenue, By Application, 2024 – 2032 (USD Million) 163
TABLE NO. 140. : Middle East Tanker Trucks Market Volume, By End-user, 2018 – 2023 (Unit) 164
TABLE NO. 141. : Middle East Tanker Trucks Market Volume, By End-user, 2024 – 2032 (Unit) 164
TABLE NO. 142. : Middle East Tanker Trucks Market Revenue, By End-user, 2018 – 2023 (USD Million) 165
TABLE NO. 143. : Middle East Tanker Trucks Market Revenue, By End-user, 2024 – 2032 (USD Million) 165
TABLE NO. 144. : Middle East Tanker Trucks Market Volume, By Capacity, 2018 – 2023 (Unit) 166
TABLE NO. 145. : Middle East Tanker Trucks Market Volume, By Capacity, 2024 – 2032 (Unit) 166
TABLE NO. 146. : Middle East Tanker Trucks Market Revenue, By Capacity, 2018 – 2023 (USD Million) 167
TABLE NO. 147. : Middle East Tanker Trucks Market Revenue, By Capacity, 2024 – 2032 (USD Million) 167
TABLE NO. 148. : Africa Tanker Trucks Market Volume, By Country, 2018 – 2023 (Unit) 170
TABLE NO. 149. : Africa Tanker Trucks Market Volume, By Country, 2024 – 2032 (Unit) 170
TABLE NO. 150. : Africa Tanker Trucks Market Revenue, By Country, 2018 – 2023 (USD Million) 171
TABLE NO. 151. : Africa Tanker Trucks Market Revenue, By Country, 2024 – 2032 (USD Million) 171
TABLE NO. 152. : Africa Tanker Trucks Market Volume, By Product, 2018 – 2023 (Unit) 172
TABLE NO. 153. : Africa Tanker Trucks Market Volume, By Product, 2024 – 2032 (Unit) 172
TABLE NO. 154. : Africa Tanker Trucks Market Revenue, By Product, 2018 – 2023 (USD Million) 173
TABLE NO. 155. : Africa Tanker Trucks Market Revenue, By Product, 2024 – 2032 (USD Million) 173
TABLE NO. 156. : Africa Tanker Trucks Market Volume, By Application, 2018 – 2023 (Unit) 174
TABLE NO. 157. : Africa Tanker Trucks Market Volume, By Application, 2024 – 2032 (Unit) 174
TABLE NO. 158. : Africa Tanker Trucks Market Revenue, By Application, 2018 – 2023 (USD Million) 175
TABLE NO. 159. : Africa Tanker Trucks Market Revenue, By Application, 2024 – 2032 (USD Million) 175
TABLE NO. 160. : Africa Tanker Trucks Market Volume, By End-user, 2018 – 2023 (Unit) 176
TABLE NO. 161. : Africa Tanker Trucks Market Volume, By End-user, 2024 – 2032 (Unit) 176
TABLE NO. 162. : Africa Tanker Trucks Market Revenue, By End-user, 2018 – 2023 (USD Million) 177
TABLE NO. 163. : Africa Tanker Trucks Market Revenue, By End-user, 2024 – 2032 (USD Million) 177
TABLE NO. 164. : Africa Tanker Trucks Market Volume, By Capacity, 2018 – 2023 (Unit) 178
TABLE NO. 165. : Africa Tanker Trucks Market Volume, By Capacity, 2024 – 2032 (Unit) 178
TABLE NO. 166. : Africa Tanker Trucks Market Revenue, By Capacity, 2018 – 2023 (USD Million) 179
TABLE NO. 167. : Africa Tanker Trucks Market Revenue, By Capacity, 2024 – 2032 (USD Million) 179

Frequently Asked Questions:

What is the market size of the tanker trucks market in 2023 and 2032?

The tanker trucks market is valued at USD 106,572.93 million in 2023 and is projected to reach USD 187,050.08 million by 2032, with a CAGR of 6.45% from 2024 to 2032.

What are the main drivers of growth in the tanker trucks market?

The main drivers include industrial growth in emerging markets, increasing demand for energy and chemicals, and advancements in tanker truck technology focused on safety, fuel efficiency, and environmental impact.

Which regions are expected to dominate the tanker trucks market?

North America and Europe currently dominate the market due to strong infrastructure and regulatory frameworks, while the Asia-Pacific region is expected to experience the highest growth rate due to rapid industrialization.

What technological advancements are shaping the tanker trucks market?

Key technological advancements include the integration of IoT, GPS tracking, fuel-efficient engines, and hybrid/electric vehicles, improving operational efficiency, safety, and environmental performance.

Who are the key players in the tanker trucks market?

Key players include Volvo Group, Daimler AG, MAN SE, Scania AB, and Navistar International Corporation, all of which are advancing innovations in safety, fuel efficiency, and technology integration.

Chemical Tanker Market

Published:
Report ID: 57121

Marine Internal Combustion Engines Market

Published:
Report ID: 11183

Shipbuilding Market

Published:
Report ID: 49813

Bunker Fuel Market

Published:
Report ID: 3884

Marine Pressure Accumulator Market

Published:
Report ID: 33320

LNG Bunkering Market

Published:
Report ID: 16248

Micro Perforation Machines Market

Published:
Report ID: 75590

Garage and Service Station Market

Published:
Report ID: 75368

Aircraft Tube and Duct Assemblies Market

Published:
Report ID: 75338

Decorative Car Accessories Market

Published:
Report ID: 74937

Classic Cars Market

Published:
Report ID: 3045

Freight Management Systems market

Published:
Report ID: 74878

Automotive Fuel Delivery System Market

Published:
Report ID: 74827

Automotive Trailer Drawbar Market

Published:
Report ID: 74656

Automotive Torque Rod Bush Market

Published:
Report ID: 74648

Automotive Grade Inductors Market

Published:
Report ID: 74642

Automotive Exhaust Headers Market

Published:
Report ID: 74639

Automotive Convertible Top Market

Published:
Report ID: 74629

Purchase Options

The report comes as a view-only PDF document, optimized for individual clients. This version is recommended for personal digital use and does not allow printing.
$4699

To meet the needs of modern corporate teams, our report comes in two formats: a printable PDF and a data-rich Excel sheet. This package is optimized for internal analysis and multi-location access, making it an excellent choice for organizations with distributed workforce.
$5699

The report will be delivered in printable PDF format along with the report’s data Excel sheet. This license offers 100 Free Analyst hours where the client can utilize Credence Research Inc.’s research team. It is highly recommended for organizations seeking to execute short, customized research projects related to the scope of the purchased report.
$7699

Smallform of Sample request

Have a question?

User Profile

Don’t settle for less – trust Mitul to help you find the best solution.

Report delivery within 24 to 48 hours

– Other Info –

What people say?-

User Review

I am very impressed with the information in this report. The author clearly did their research when they came up with this product and it has already given me a lot of ideas.

Jana Schmidt
CEDAR CX Technologies

– Connect with us –

Phone

+91 6232 49 3207


support

24/7 Research Support


sales@credenceresearch.com

– Research Methodology –

Going beyond the basics: advanced techniques in research methodology

– Trusted By –

Pepshi, LG, Nestle
Motorola, Honeywell, Johnson and johnson
LG Chem, SIEMENS, Pfizer
Unilever, Samsonite, QIAGEN