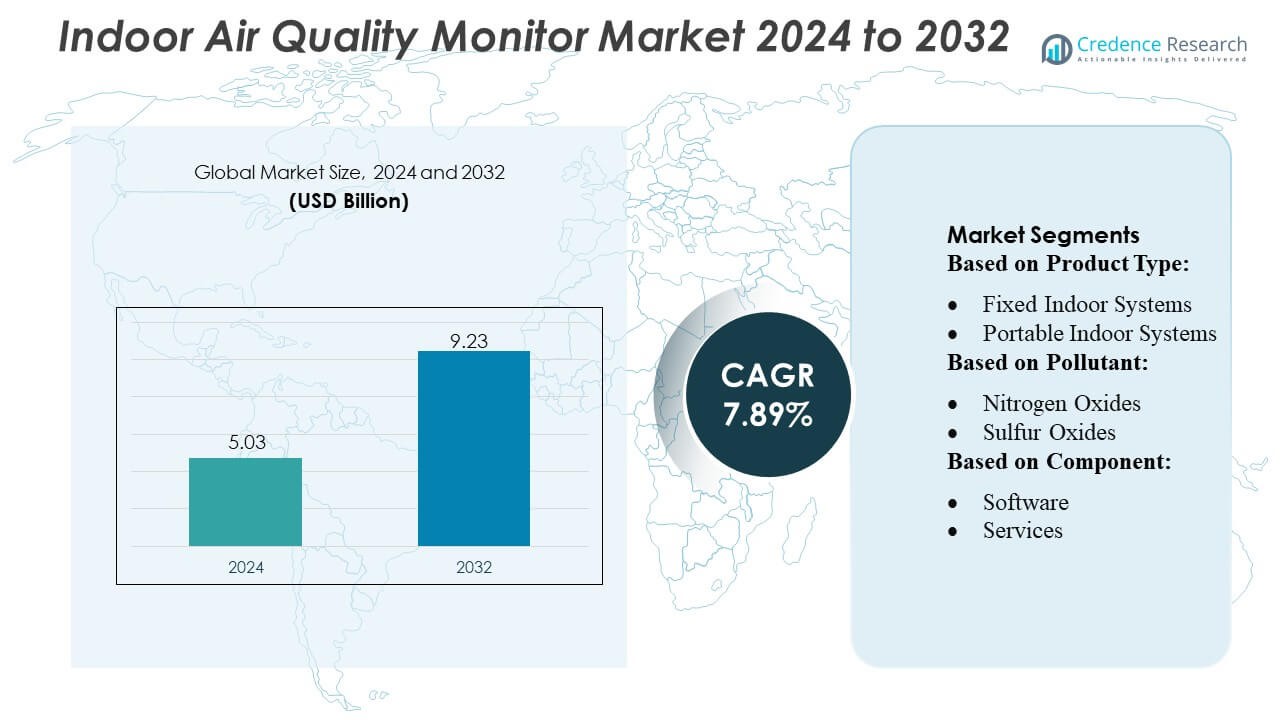
Home » Semiconductor & Electronics » Indoor Air Quality Monitor Market

Indoor Air Quality Monitor Market By Type of IAQ Monitor (Chemical Sensors, Particulate Matter (PM) Monitors, Biological Sensors, Multi-Parameter Monitors) By Technology (Wired IAQ Monitors, Wireless IAQ Monitors, Portable IAQ Monitor)-Growth, Future Prospects & Competitive Analysis, 2022 – 2030

Price: $4699

Published: | Report ID: 23467 | Report Format : PDF

Market Insights

  • The global demand for indoor air quality monitors was valued at USD 4684.5 Million in 2022 and is expected to reach USD 9063.6 Million in 2030, growing at a CAGR of 8.6% between 2023 and 2030.
  • The chemical sensors segment is the market leader by type of IAQ monitor, accounting for more than 34% of total value in 2022, while the multi-parameter monitor segment is anticipated to grow rapidly over the projection period.
  • The wireless IAQ monitors technology category is expected to expand quickly in the forecast period, while the fixed IAQ monitors segment has the largest market share in 2022.
  • The homeowner end-users dominate the global need for indoor air quality monitors, accounting for more than 30% in 2022, and are predicted to expand at a high CAGR.
  • The particulate matter (PM) category dominated the market with 32% of the total revenue share by parameter measured. In contrast, the temperature and humidity categories will expand fastest over the projected time frame.
  • The residential category dominated the market with 28% of the total revenue share by the application segment.
  • North America is propelling the growth of the indoor air quality monitor industry, accounting for more than one-third of the market in 2022, while Asia Pacific and Europe account for just under 54% of the market in 2022. In 2022, Europe held more than 20% of the market.
  • Increasing awareness about indoor air pollution and its health impacts mainly drives the global demand for indoor air quality monitors.
  • The integration of indoor air quality monitors with smart home systems is gaining traction, allowing homeowners to monitor and control air quality through smartphones and other devices.
  • Growing concerns about respiratory diseases, allergies, and asthma due to poor indoor air quality are boosting the market growth, especially in residential applications.

Indoor Air Quality Monitor Market (1)

Executive Summary

Market Definition

Indoor air quality monitors are devices or systems designed to assess and manage air quality inside buildings and enclosed spaces. They measure various factors such as levels of pollutants, temperature, humidity, and ventilation to ensure a healthy and safe indoor environment. These monitors play a significant role in identifying and mitigating potential health hazards related to indoor air, including allergens, particulate matter, volatile organic compounds (VOCs), carbon dioxide (CO2), and other contaminants.

Design Element 2

Access crucial information at unmatched prices!

Request your free sample report today & start making informed decisions powered by Credence Research!

Download Free Sample

CTA Design Element 3

Market Overview

The global indoor air quality monitor market has witnessed rapid growth in recent years and is expected to grow at a CAGR of 8.6% between 2023 and 2030. The market was valued at USD 4684.5 million in 2022 and is expected to reach USD 9063.6 million in 2030.

Air quality monitoring entails systematic inspection and evaluation of air quality in a specific location or region. It includes the measurement and assessment of numerous pollutants and contaminants found in the air, including volatile organic compounds (VOCs), particulate matter (PM), nitrogen dioxide (NO2), sulfur dioxide (SO2), and ozone (O3). It employs specialized tools and sensors to gather real-time data and identify air quality variations and potential health problems.

The increased need for fresh air to lower the risk of various health issues among individuals is fueling market expansion. In accordance with this, the growing emphasis on resolving climate change challenges and decreasing emissions contributes to the growth of the global market. Furthermore, the increasing popularity of environmental sustainability is generating profitable growth potential for industry investors. In addition, government agencies in various countries are setting severe air quality requirements, encouraging businesses to employ monitoring solutions, and supporting the market’s expansion. Aside from that, the increased frequency of air pollution-related disorders among the general population worldwide has supported the growth of the indoor air quality monitor market.

Segmentation by Type of IAQ Monitor

  • The multi-parameter IAQ monitors are expected to exhibit the highest CAGR in the projected period. These monitors offer a comprehensive indoor air quality monitoring approach by measuring multiple parameters simultaneously.
  • Chemical sensors, such as those for detecting VOCs (volatile organic compounds), are the leading segment by type of IAQ monitor, accounting for over 34% of the market share in 2022. These sensors are vital for identifying specific pollutants in indoor environments.

Segmentation by Technology

  • Wireless IAQ monitors are expected to post the highest CAGR in the forecasted period. The wireless technology allows for real-time data collection and remote monitoring, enhancing the convenience of indoor air quality assessment.
  • Fixed IAQ monitors, often integrated into building management systems, lead the market share, comprising over 36% in 2022. These monitors provide continuous monitoring in a stationary location, making them ideal for facilities with stable air quality requirements.

Segmentation by End-User

  • Homeowners dominate the end-user category, representing more than 30% of the global demand for indoor air quality monitoring in 2022. This significant share is driven by the increasing awareness of residential indoor air quality and the desire for healthier living environments.
  • Industrial facility managers fulfill the remaining demand for indoor air quality monitors. These professionals rely on IAQ monitors to ensure safe and healthy working conditions in factories, warehouses, and other industrial settings.

Segmentation by Parameter Measured

  • The temperature and humidity segment is expected to experience rapid growth in the forecast period. Monitoring temperature and humidity is crucial for maintaining a comfortable and healthy indoor environment, particularly in residential and commercial spaces.
  • The particulate matter (PM) category leads with a substantial market share of nearly 32% in 2022. This segment is essential for detecting airborne particles like dust, pollen, and pollutants directly impacting respiratory health.

Segmentation by Application

  • The healthcare segment will exhibit the highest CAGR in the projection period. IAQ monitoring in healthcare facilities is critical for maintaining air quality standards and preventing the spread of infections.
  • Residential applications dominate the global demand for indoor air quality monitors, comprising more than 28% in 2022. With increasing health consciousness, homeowners seek ways to ensure the air quality in their living spaces is optimal for their well-being.

Segmentation by Region

  • North America presents highly profitable opportunities for industry players in the indoor air quality monitor market, holding a significant share of over one-third in 2022. The stringent regulations and growing health awareness drive the regional adoption of IAQ monitors.
  • Asia Pacific and Europe collectively contributed to just under 54% of the market share in 2022, with Europe accounting for over 20% in the same year. With its expanding urbanization and increasing industrialization, Asia Pacific has substantial growth potential.
  • The rest of the world, encompassing regions like Latin America, the Middle East, and Africa, contributes to the remaining demand for indoor air quality monitoring, as these areas gradually recognize the importance of IAQ in various applications.

Indoor Air Quality Monitor Market R (1)

Expanding demand for IoT-enabled air quality systems, increasing concern about the harmful impacts of poor air quality, and rising pollution levels due to industrialization are some of the primary factors propelling the global indoor air quality monitor market’s development.

North America leads the global indoor air quality monitor market. The region strongly emphasizes public health and environmental concerns, promoting the adoption of indoor air quality monitoring systems to ensure safe and healthy living environments. Besides, stringent government regulations and standards, particularly in the United States, mandate the use of air quality monitoring systems, further propelling the market growth. The presence of major industry players and innovative startups in North America has led to the development of advanced and diverse monitoring solutions catering to the varying needs of residential, commercial, and industrial users. The robust regional infrastructure, technological advancements, and higher consumer awareness of indoor air quality issues also contribute to its dominant position in the global market.

Asia Pacific is projected to emerge as the fastest-growing region in the global indoor air quality monitor market over the forecast period. This regional growth is attributed to the rapidly expanding industrial and commercial sectors, which have led to increased concerns about indoor air pollution. Governments in countries like Japan, China, South Korea, and India are implementing stricter regulations to address air quality issues, fueling the demand for monitoring solutions. The strong regional manufacturing base and the presence of major electronics and technology companies are contributing to the development of advanced monitoring technologies, making these solutions more accessible and affordable. The market’s potential growth in this region is also fueled by urbanization, increasing pollution levels, and a proactive approach to ensuring healthier indoor environments.

Key Highlights of the Report

The global indoor air quality monitor market is segmented by type of IAQ monitor, application, technology, parameter measured, end-user, and region. Multi-parameter monitors are expected to exhibit robust growth, offering a wide range of monitoring capabilities. At the same time, chemical sensors lead the type of IAQ monitor segment due to their widespread use and versatility. The adoption of wireless IAQ monitors is projected to surge as they offer remote monitoring capabilities and flexibility. In contrast, fixed IAQ monitors hold the largest market share due to their extensive use in industrial and commercial settings. Homeowners constitute a significant portion of the end-user category, reflecting the growing awareness and concern about indoor air quality, particularly in residential settings. Temperature & humidity monitoring is poised for rapid expansion, with particulate matter (PM) monitoring currently dominating the parameter-measured segment. Healthcare applications are expected to grow substantially, with the residential sector leading in indoor air quality monitor demand.

The global indoor air quality monitor market growth is primarily driven by the growing awareness of air pollution and its health impacts, leading to an increasing demand for effective monitoring solutions. Implementing stringent government regulations and standards regarding indoor air quality across various industries, further fuels the market’s growth. Moreover, the rising adoption of smart and connected indoor air quality monitoring devices and the surge in construction activities contribute to market expansion. However, market growth faces challenges due to the high initial costs associated with advanced monitoring systems and the limited consumer awareness about the benefits of air quality monitoring.

North America, with a prominent market share of over one-third, demonstrates a high level of market maturity in the indoor air quality monitor segment, driven by a growing emphasis on health & wellness, stringent regulations, and an advanced technological landscape. On the other hand, the Asia Pacific region showcases significant growth potential. Comprising countries like India, China, and Southeast Asian nations, this region experiences rapid urbanization, industrial expansion, and an increasing awareness of the importance of indoor air quality. As a result, the Asia Pacific region presents robust opportunities for market growth, with escalating demand for indoor air quality monitoring solutions across residential, commercial, and industrial applications.

What Are The Main Drivers Of The Global Indoor Air Quality Monitor Market?

The main drivers of the global indoor air quality monitor market growth are growing awareness and concerns regarding the health effects of poor indoor air quality, increased focus on creating healthier indoor environments in residential and commercial spaces, stringent air quality regulations and standards, the rise in urbanization and industrialization, and the adoption of smart building technologies. Besides, the ongoing COVID-19 pandemic has further emphasized the importance of monitoring indoor air quality to prevent the spread of airborne diseases, leading to a surge in demand for these monitoring systems.

What Are The Major Challenges Faced By The Global Indoor Air Quality Monitor Market?

The global indoor air quality monitor market faces several challenges, including affordability constraints for some consumers, especially in developing regions, which may limit widespread adoption. Calibration and maintenance requirements for accurate monitoring can be complex, and ensuring the reliability and precision of sensors remains an ongoing challenge. Moreover, navigating varying international standards and regulations for indoor air quality poses a challenge for manufacturers and businesses operating in multiple regions. Also, the lack of comprehensive awareness and education regarding indoor air quality in some areas may hinder the market’s growth, as consumers and businesses may need to fully understand the potential health risks associated with poor indoor air quality.

What Are The Growth Opportunities In The Global Indoor Air Quality Monitor Market?

The global indoor air quality monitor market offers promising growth opportunities due to increasing awareness about the health impacts of indoor air pollution and the growing emphasis on creating healthier living and working environments. With rising concerns about respiratory diseases and allergies, there is an increasing demand for accurate and efficient air quality monitoring systems in residential, commercial, and industrial spaces. Emerging technological advancements, especially in sensor technologies, data analytics, and IoT integration, are driving the development of innovative and user-friendly indoor air quality monitoring devices. In addition, stringent regulations and standards related to indoor air quality set by governments and environmental organizations worldwide are compelling businesses and institutions to invest in advanced monitoring solutions.

Market Drivers

Several factors drive the global indoor air quality monitor market. The following are the key drivers of the global indoor air quality monitor market:

Stringent Regulations and Standards

Governments and regulatory bodies worldwide are implementing strict guidelines and standards for indoor air quality. Compliance with these regulations is mandatory for various sectors, including commercial, industrial, and residential buildings. Indoor air quality monitors play a crucial role in helping businesses and institutions adhere to these standards. Besides, green building initiatives and certifications, such as LEED (Leadership in Energy & Environmental Design), emphasize indoor air quality, further propelling the demand for monitoring devices.

The regional governments, non-governmental organizations, and the commercial sector are implementing several positive initiatives to reduce air pollution through public awareness programs and campaigns. For example, in November 2021, the Pune Municipal Corporation (PMC) in India began activities under the Union government’s National Clean Air Programme (NCAP). This project intends to produce a stringent execution of measures for reducing, preventing, and controlling air pollution levels and to improve and expand the air quality monitoring infrastructure throughout the country by raising public awareness.

Market Restraints

The global indoor air quality monitor market faces challenges that may hinder its growth. These include the following:

Higher Initial Costs

One primary constraint is the relatively high initial costs of purchasing and installing indoor air quality monitoring systems. These systems are equipped with advanced sensors, data analytics capabilities, and sometimes even real-time reporting features, making them expensive. This can be a major barrier, especially for small businesses, educational institutions, and residential users with limited budgets. The cost includes purchasing monitoring devices, installation, and potential recurring maintenance and sensor calibration expenses. While the long-term benefits in terms of health and productivity are significant, the initial investment can deter some potential customers from adopting these systems.

Opportunities

The global indoor air quality monitor market offers significant growth opportunities. These include the following:

Growing Demands for IoT-Enabled Air Quality Systems

The ongoing trend of smart buildings and the integration of Internet of Things (IoT) technology present substantial opportunities for the indoor air quality monitor market expansion. As building automation systems become more prevalent, there is an increasing need for sensors and monitors that seamlessly integrate with these systems. IoT-based indoor air quality monitors offer real-time data collection and analysis, enabling automated responses to maintain optimal air quality. The shift toward sustainable and energy-efficient buildings also drives the adoption of smart systems for air quality management. Indoor air quality monitor manufacturers can leverage this trend to develop innovative, connected solutions that can be seamlessly integrated into smart building ecosystems.

Competitive Landscape

Indoor Air Quality Monitor Market C (1)

Key Players

The competitive landscape of the global indoor air quality monitor market is marked by intense competition among key players striving to innovate and expand their product offerings. The following are some of the top market players and their market shares:

  • 3M Company
  • Agilent Technologies Inc
  • Acoem Group
  • Bacharach Inc
  • Aeroqual Limited
  • Ambient Weather
  • Awair Inc
  • Airboxlab SA (Foobot)
  • Airveda Technologies Pvt Ltd
  • Alpha Controls & Instrumentation Inc
  • Autotronic Enterprise Co. Ltd
  • AZ Instrument Corp.
  • Airthings
  • Aircuity Inc
  • AMETEK MOCON
  • Others

These leading companies focus on product development and launching advanced indoor air quality monitoring solutions to gain a competitive edge. They improve sensor accuracy, data collection methodologies, and real-time processing capabilities. Moreover, strategic collaborations, partnerships, and mergers & acquisitions are common strategies for companies looking to expand their market presence.

The market also witnesses the entry of new and innovative startups specializing in cutting-edge sensor technologies and IoT integration, adding dynamism to the competition. Government regulations and standards play a crucial role in shaping the competitive landscape by encouraging companies to adhere to indoor air quality guidelines. Key players are increasingly investing in R&D activities to offer comprehensive solutions catering to residential and commercial segments, providing end-users a wide range of choices.

In March 2023, Siemens developed the Connect Box, an innovative IoT solution for managing small buildings. It is an effective tool for tracking building performance, optimizing energy efficiency, and enhancing indoor air quality in small to medium-sized facilities like schools, retail stores, residences, or small workplaces.

In July 2020, Airthings ASA, a manufacturer of indoor air quality digital radon detectors, introduced the Wave Mini quality monitor at the 2019 Consumer Electronics Show (CES) in Las Vegas, Nevada. Wave Mini is a home automation solution designed to detect air quality and improve indoor air quality.

Shape Your Report to Specific Countries or Regions & Enjoy 30% Off!

Summary of Key Findings

  • Public awareness campaigns, government initiatives, and educational programs regarding indoor air quality’s importance encourage consumers and businesses to invest in monitoring solutions.
  • Market segmented by type of IAQ monitor, application, technology, parameter measured, end-user, and region.
  • Advancements in sensor technologies, including chemical and particulate matter sensors, are enhancing the accuracy and efficiency of indoor air quality monitors.
  • Integration with HVAC systems for real-time adjustments based on air quality measurements is becoming a standard feature, especially in commercial buildings.
  • Hospitals, clinics, and healthcare facilities are investing in high-quality air monitoring systems to maintain sterile and healthy environments for patients and staff.
  • The boosting awareness of the importance of indoor air quality among homeowners and renters drives consumer demand for compact, user-friendly monitors built for domestic use.
  • Industrial facilities are adopting air quality monitors to ensure the safety and well-being of workers exposed to various pollutants, dust, and chemicals.

Future Outlook

  • There is a specific focus on monitoring particulate matter (PM2.5 and PM10) due to their direct impact on respiratory health, leading to the development of specialized monitors.
  • The Asia-Pacific region is witnessing substantial market growth owing to rapid urbanization, industrialization, and increasing awareness about the importance of indoor air quality.
  • Indoor air quality monitoring systems increasingly offer data analytics and cloud-based services, enabling users to access historical data and trends for informed decision-making.
  • Integration of air quality monitoring capabilities in consumer electronics like smartphones, wearables, and smart speakers is becoming more common, providing on-the-go air quality information.

Segmentation

  • By Type of IAQ Monitor
    • Chemical Sensors
    • Particulate Matter (PM) Monitors
    • Biological Sensors
    • Multi-Parameter Monitors
  • By Technology
    • Wired IAQ Monitors
    • Wireless IAQ Monitors
    • Portable IAQ Monitors
    • Fixed IAQ Monitors
  • By End-User
    • Homeowners
    • Building Owners and Managers
    • Industrial Facility Managers
    • Healthcare Administrators
    • Government and Regulatory Bodies
    • Research and Laboratory Professionals
  • By Parameter Measured
    • Chemical Pollutants
    • Particulate Matter (PM)
    • Biological Contaminants
    • Temperature and Humidity
    • Multiple Parameters
  • By Application
    • Residential
    • Commercial
    • Industrial
    • Healthcare
    • Transportation
    • Research and Laboratory
    • Others
  • By Region
    • North America
      • The U.S.
      • Canada
      • Mexico
    • Europe
      • Germany
      • France
      • The U.K.
      • Italy
      • Spain
      • Rest of Europe
    • Asia Pacific
      • China
      • Japan
      • India
      • South Korea
      • South-east Asia
      • Rest of Asia Pacific
    • Latin America
      • Brazil
      • Argentina
      • Rest of Latin America
    • Middle East & Africa
      • GCC Countries
      • South Africa
      • Rest of the Middle East and Africa

Adjacent Markets

Several adjacent markets have high revenue growth opportunities in the indoor air quality monitor market. The key adjacent markets for indoor air quality monitor market –

Indoor Air Quality Monitor Market A (1)

1. Preface

1.1. Report Description

1.1.1. Purpose of the Report

1.1.2. Target Audience

1.1.3. USP and Key Offerings

1.2. Research Scope

1.3. Market Introduction


2. Executive Summary

2.1. Market Snapshot: Global Indoor Air Quality Monitor Market

2.1.1. Global Indoor Air Quality Monitor Market, By Type of IAQ Monitor

2.1.2. Global Indoor Air Quality Monitor Market, By Technology

2.1.3. Global Indoor Air Quality Monitor Market, By End-User

2.1.4. Global Indoor Air Quality Monitor Market, By Parameter Measured

2.1.5. Global Indoor Air Quality Monitor Market, By Application

2.1.6. Global Indoor Air Quality Monitor Market, By Region

2.2. Insights from Primary Respondents


3. Market Dynamics & Factors Analysis

3.1. Introduction

3.1.1. Global Indoor Air Quality Monitor Market Value, 2017-2030, (US$ Mn)

3.1.2. Y-o-Y Growth Trend Analysis

3.2. Market Dynamics

3.2.1. Indoor Air Quality Monitor Market Drivers

3.2.2. Indoor Air Quality Monitor Market Restraints

3.2.3. Indoor Air Quality Monitor Market Opportunities

3.2.4. Major Indoor Air Quality Monitor Industry Challenges

3.3. Growth and Development Patterns

3.4. Investment Feasibility Analysis

3.5. Market Opportunity Analysis

3.5.1. Type of IAQ Monitor

3.5.2. Technology

3.5.3. End-User

3.5.4. Parameter Measured

3.5.5. Application

3.5.6. Geography


4. Market Competitive Landscape Analysis

4.1. Company Market Share Analysis, 2022

4.1.1. Global Indoor Air Quality Monitor Market: Company Market Share, Value 2022

4.1.2. Global Indoor Air Quality Monitor Market: Top 6 Company Market Share, Value 2022

4.1.3. Global Indoor Air Quality Monitor Market: Top 3 Company Market Share, Value 2022

4.2. Global Indoor Air Quality Monitor Market: Company Revenue Share Analysis, 2022

4.3. Company Assessment Metrics, 2022

4.3.1. Stars

4.3.2. Emerging Leaders

4.3.3. Pervasive Players

4.3.4. Participants

4.4. Startups/SMEs Assessment Metrics, 2022

4.4.1. Progressive Companies

4.4.2. Responsive Companies

4.4.3. Dynamic Companies

4.4.4. Starting Blocks

4.5. Strategic Development

4.5.1. Acquisition and Mergers

4.5.2. New Product Launch

4.5.3. Regional Expansion

4.5.4. Partnerships

4.6. Key Player Product Matrix

4.7. Potential for New Players in the Global Indoor Air Quality Monitor Market


5. Premium Insights

5.1. STAR (Situation, Task, Action, Results) Analysis

5.2. Porter’s Five Forces Analysis

5.2.1. Threat of New Entrants

5.2.2. Bargaining Power of Buyers/Consumers

5.2.3. Bargaining Power of Suppliers

5.2.4. Threat of Substitute Types

5.2.5. Intensity of Competitive Rivalry

5.3. PESTEL Analysis

5.3.1. Political Factors

5.3.2. Economic Factors

5.3.3. Social Factors

5.3.4. Technological Factors

5.3.5. Environmental Factors

5.3.6. Legal Factors

5.4. Key Market Trends

5.4.1. Demand Side Trends

5.4.2. Supply Side Trends

5.5. Value Chain Analysis

5.6. Technology Analysis

5.6.1. Research and development in the global market

5.6.2. Patent Analysis

5.6.3. Emerging technologies and their potential disruption to the market

5.7. Consumer Behaviour Analysis

5.7.1. Consumer Preferences and Expectations

5.7.2. Factors Influencing Consumer Buying Decisions

5.7.2.1. North America

5.7.2.2. Europe

5.7.2.3. Asia Pacific

5.7.2.4. Latin America

5.7.2.5. Middle East and Africa

5.7.3. Consumer Pain Points

5.8. Analysis and Recommendations

5.9. Adjacent Market Analysis


6. Market Positioning of Key Players, 2022

6.1. Company market share of key players, 2022

6.2. Competitive Benchmarking

6.3. Market Positioning of Key Vendors

6.4. Geographical Presence Analysis

6.5. Major Strategies Adopted by Key Players

6.5.1. Key Strategies Analysis

6.5.2. Mergers and Acquisitions

6.5.3. Partnerships

6.5.4. Product Launch

6.5.5. Geographical Expansion

6.5.6. Others


7. Impact Analysis of COVID-19 and Russia – Ukraine War on Indoor Air Quality Monitor Market

7.1. Ukraine-Russia War Impact

7.1.1. Uncertainty and Economic Instability

7.1.2. Supply chain disruptions

7.1.3. Regional market shifts

7.1.4. Shift in government priorities

7.2. COVID-19 Impact Analysis

7.2.1. Supply Chain Disruptions

7.2.2. Demand Fluctuations

7.2.3. Shift in Product Mix

7.2.4. Reduced Industrial Activity

7.2.5. Regional Impact Analysis

7.2.5.1. North America

7.2.5.2. Europe

7.2.5.3. Asia Pacific

7.2.5.4. Latin America

7.2.5.5. Middle East and Africa


8. Global Indoor Air Quality Monitor Market, By Type of IAQ Monitor

8.1. Global Indoor Air Quality Monitor Market Overview, by Type of IAQ Monitor

8.1.1. Global Indoor Air Quality Monitor Market Revenue Share, By Type of IAQ Monitor, 2022 Vs 2030 (in %)

8.2. Chemical Sensors

8.2.1. Global Indoor Air Quality Monitor Market, By Chemical Sensors, By Region, 2017-2030 (US$ Mn)

8.2.2. Market Dynamics for Chemical Sensors

8.2.2.1. Drivers

8.2.2.2. Restraints

8.2.2.3. Opportunities

8.2.2.4. Trends

8.3. Particulate Matter (PM) Monitors

8.3.1. Global Indoor Air Quality Monitor Market, By Particulate Matter (PM) Monitors, By Region, 2017-2030 (US$ Mn)

8.3.2. Market Dynamics for Particulate Matter (PM) Monitors

8.3.2.1. Drivers

8.3.2.2. Restraints

8.3.2.3. Opportunities

8.3.2.4. Trends

8.4. Biological Sensors

8.4.1. Global Indoor Air Quality Monitor Market, By Biological Sensors, By Region, 2017-2030 (US$ Mn)

8.4.2. Market Dynamics for Biological Sensors

8.4.2.1. Drivers

8.4.2.2. Restraints

8.4.2.3. Opportunities

8.4.2.4. Trends

8.5. Multi-Parameter Monitors

8.5.1. Global Indoor Air Quality Monitor Market, By Multi-Parameter Monitors, By Region, 2017-2030 (US$ Mn)

8.5.2. Market Dynamics for Multi-Parameter Monitors

8.5.2.1. Drivers

8.5.2.2. Restraints

8.5.2.3. Opportunities

8.5.2.4. Trends


9. Global Indoor Air Quality Monitor Market, By Technology

9.1. Global Indoor Air Quality Monitor Market Overview, by Technology

9.1.1. Global Indoor Air Quality Monitor Market Revenue Share, By Technology, 2022 Vs 2030 (in %)

9.2. Wired IAQ Monitors

9.2.1. Global Indoor Air Quality Monitor Market, By Wired IAQ Monitors, By Region, 2017-2030 (US$ Mn)

9.2.2. Market Dynamics for Wired IAQ Monitors

9.2.2.1. Drivers

9.2.2.2. Restraints

9.2.2.3. Opportunities

9.2.2.4. Trends

9.3. Wireless IAQ Monitors

9.3.1. Global Indoor Air Quality Monitor Market, By Wireless IAQ Monitors, By Region, 2017-2030 (US$ Mn)

9.3.2. Market Dynamics for Wireless IAQ Monitors

9.3.2.1. Drivers

9.3.2.2. Restraints

9.3.2.3. Opportunities

9.3.2.4. Trends

9.4. Portable IAQ Monitors

9.4.1. Global Indoor Air Quality Monitor Market, By Portable IAQ Monitors, By Region, 2017-2030 (US$ Mn)

9.4.2. Market Dynamics for Portable IAQ Monitors

9.4.2.1. Drivers

9.4.2.2. Restraints

9.4.2.3. Opportunities

9.4.2.4. Trends

9.5. Fixed IAQ Monitors

9.5.1. Global Indoor Air Quality Monitor Market, By Fixed IAQ Monitors, By Region, 2017-2030 (US$ Mn)

9.5.2. Market Dynamics for Fixed IAQ Monitors

9.5.2.1. Drivers

9.5.2.2. Restraints

9.5.2.3. Opportunities

9.5.2.4. Trends


10. Global Indoor Air Quality Monitor Market, By End-User

10.1. Global Indoor Air Quality Monitor Market Overview, by End-User

10.1.1. Global Indoor Air Quality Monitor Market Revenue Share, By End-User, 2022 Vs 2030 (in %)

10.2. Homeowners

10.2.1. Global Indoor Air Quality Monitor Market, By Homeowners, By Region, 2017-2030 (US$ Mn)

10.2.2. Market Dynamics for Homeowners

10.2.2.1. Drivers

10.2.2.2. Restraints

10.2.2.3. Opportunities

10.2.2.4. Trends

10.3. Building Owners and Managers

10.3.1. Global Indoor Air Quality Monitor Market, By Building Owners and Managers, By Region, 2017-2030 (US$ Mn)

10.3.2. Market Dynamics for Building Owners and Managers

10.3.2.1. Drivers

10.3.2.2. Restraints

10.3.2.3. Opportunities

10.3.2.4. Trends

10.4. Industrial Facility Managers

10.4.1. Global Indoor Air Quality Monitor Market, By Industrial Facility Managers, By Region, 2017-2030 (US$ Mn)

10.4.2. Market Dynamics for Industrial Facility Managers

10.4.2.1. Drivers

10.4.2.2. Restraints

10.4.2.3. Opportunities

10.4.2.4. Trends

10.5. Healthcare Administrators

10.5.1. Global Indoor Air Quality Monitor Market, By Healthcare Administrators, By Region, 2017-2030 (US$ Mn)

10.5.2. Market Dynamics for Healthcare Administrators

10.5.2.1. Drivers

10.5.2.2. Restraints

10.5.2.3. Opportunities

10.5.2.4. Trends

10.6. Government and Regulatory Bodies

10.6.1. Global Indoor Air Quality Monitor Market, By Government and Regulatory Bodies, By Region, 2017-2030 (US$ Mn)

10.6.2. Market Dynamics for Government and Regulatory Bodies

10.6.2.1. Drivers

10.6.2.2. Restraints

10.6.2.3. Opportunities

10.6.2.4. Trends

10.7. Research and Laboratory Professionals

10.7.1. Global Indoor Air Quality Monitor Market, By Research and Laboratory Professionals, By Region, 2017-2030 (US$ Mn)

10.7.2. Market Dynamics for Research and Laboratory Professionals

10.7.2.1. Drivers

10.7.2.2. Restraints

10.7.2.3. Opportunities

10.7.2.4. Trends


11. Global Indoor Air Quality Monitor Market, By Parameter Measured

11.1. Global Indoor Air Quality Monitor Market Overview, by Parameter Measured

11.1.1. Global Indoor Air Quality Monitor Market Revenue Share, By Parameter Measured, 2022 Vs 2030 (in %)

11.2. Chemical Pollutants

11.2.1. Global Indoor Air Quality Monitor Market, By Chemical Pollutants, By Region, 2017-2030 (US$ Mn)

11.2.2. Market Dynamics for Chemical Pollutants

11.2.2.1. Drivers

11.2.2.2. Restraints

11.2.2.3. Opportunities

11.2.2.4. Trends

11.3. Particulate Matter (PM)

11.3.1. Global Indoor Air Quality Monitor Market, By Particulate Matter (PM), By Region, 2017-2030 (US$ Mn)

11.3.2. Market Dynamics for Particulate Matter (PM)

11.3.2.1. Drivers

11.3.2.2. Restraints

11.3.2.3. Opportunities

11.3.2.4. Trends

11.4. Biological Contaminants

11.4.1. Global Indoor Air Quality Monitor Market, By Biological Contaminants, By Region, 2017-2030 (US$ Mn)

11.4.2. Market Dynamics for Biological Contaminants

11.4.2.1. Drivers

11.4.2.2. Restraints

11.4.2.3. Opportunities

11.4.2.4. Trends

11.5. Temperature and Humidity

11.5.1. Global Indoor Air Quality Monitor Market, By Temperature and Humidity, By Region, 2017-2030 (US$ Mn)

11.5.2. Market Dynamics for Temperature and Humidity

11.5.2.1. Drivers

11.5.2.2. Restraints

11.5.2.3. Opportunities

11.5.2.4. Trends

11.6. Multiple Parameters

11.6.1. Global Indoor Air Quality Monitor Market, By Multiple Parameters, By Region, 2017-2030 (US$ Mn)

11.6.2. Market Dynamics for Multiple Parameters

11.6.2.1. Drivers

11.6.2.2. Restraints

11.6.2.3. Opportunities

11.6.2.4. Trends


12. Global Indoor Air Quality Monitor Market, By Application

12.1. Global Indoor Air Quality Monitor Market Overview, by Application

12.1.1. Global Indoor Air Quality Monitor Market Revenue Share, By Application, 2022 Vs 2030 (in %)

12.2. Residential

12.2.1. Global Indoor Air Quality Monitor Market, By Residential, By Region, 2017-2030 (US$ Mn)

12.2.2. Market Dynamics for Residential

12.2.2.1. Drivers

12.2.2.2. Restraints

12.2.2.3. Opportunities

12.2.2.4. Trends

12.3. Commercial

12.3.1. Global Indoor Air Quality Monitor Market, By Commercial, By Region, 2017-2030 (US$ Mn)

12.3.2. Market Dynamics for Commercial

12.3.2.1. Drivers

12.3.2.2. Restraints

12.3.2.3. Opportunities

12.3.2.4. Trends

12.4. Industrial

12.4.1. Global Indoor Air Quality Monitor Market, By Industrial, By Region, 2017-2030 (US$ Mn)

12.4.2. Market Dynamics for Industrial

12.4.2.1. Drivers

12.4.2.2. Restraints

12.4.2.3. Opportunities

12.4.2.4. Trends

12.5. Healthcare

12.5.1. Global Indoor Air Quality Monitor Market, By Healthcare, By Region, 2017-2030 (US$ Mn)

12.5.2. Market Dynamics for Healthcare

12.5.2.1. Drivers

12.5.2.2. Restraints

12.5.2.3. Opportunities

12.5.2.4. Trends

12.6. Transportation

12.6.1. Global Indoor Air Quality Monitor Market, By Transportation, By Region, 2017-2030 (US$ Mn)

12.6.2. Market Dynamics for Transportation

12.6.2.1. Drivers

12.6.2.2. Restraints

12.6.2.3. Opportunities

12.6.2.4. Trends

12.7. Research and Laboratory

12.7.1. Global Indoor Air Quality Monitor Market, By Research and Laboratory, By Region, 2017-2030 (US$ Mn)

12.7.2. Market Dynamics for Research and Laboratory

12.7.2.1. Drivers

12.7.2.2. Restraints

12.7.2.3. Opportunities

12.7.2.4. Trends

12.8. Others

12.8.1. Global Indoor Air Quality Monitor Market, By Others, By Region, 2017-2030 (US$ Mn)

12.8.2. Market Dynamics for Others

12.8.2.1. Drivers

12.8.2.2. Restraints

12.8.2.3. Opportunities

12.8.2.4. Trends


13. Global Indoor Air Quality Monitor Market, By Region

13.1. Global Indoor Air Quality Monitor Market Overview, by Region

13.1.1. Global Indoor Air Quality Monitor Market, By Region, 2022 vs 2030 (in%)

13.2. Type of IAQ Monitor

13.2.1. Global Indoor Air Quality Monitor Market, By Type of IAQ Monitor, 2017-2030 (US$ Mn)

13.3. Technology

13.3.1. Global Indoor Air Quality Monitor Market, By Technology, 2017-2030 (US$ Mn)

13.4. End-User

13.4.1. Global Indoor Air Quality Monitor Market, By End-User, 2017-2030 (US$ Mn)

13.5. Parameter Measured

13.5.1. Global Indoor Air Quality Monitor Market, By Parameter Measured, 2017-2030 (US$ Mn)

13.6. Application

13.6.1. Global Indoor Air Quality Monitor Market, By Application, 2017-2030 (US$ Mn)


14. North America Indoor Air Quality Monitor Market Analysis

14.1. Overview

14.1.1. Market Dynamics for North America

14.1.1.1. Drivers

14.1.1.2. Restraints

14.1.1.3. Opportunities

14.1.1.4. Trends

14.2. North America Indoor Air Quality Monitor Market, by Type of IAQ Monitor, 2017-2030(US$ Mn)

14.2.1. Overview

14.2.2. SRC Analysis

14.3. North America Indoor Air Quality Monitor Market, by Technology, 2017-2030(US$ Mn)

14.3.1. Overview

14.3.2. SRC Analysis

14.4. North America Indoor Air Quality Monitor Market, by End-User, 2017-2030(US$ Mn)

14.4.1. Overview

14.4.2. SRC Analysis

14.5. North America Indoor Air Quality Monitor Market, by Parameter Measured, 2017-2030(US$ Mn)

14.5.1. Overview

14.5.2. SRC Analysis

14.6. North America Indoor Air Quality Monitor Market, by Application, 2017-2030(US$ Mn)

14.6.1. Overview

14.6.2. SRC Analysis

14.7. North America Indoor Air Quality Monitor Market, by Country, 2017-2030 (US$ Mn)

14.7.1. North America Indoor Air Quality Monitor Market, by Country, 2022 Vs 2030 (in%)

14.7.2. U.S.

14.7.3. Canada

14.7.4. Mexico


15. Europe Indoor Air Quality Monitor Market Analysis

15.1. Overview

15.1.1. Market Dynamics for North America

15.1.1.1. Drivers

15.1.1.2. Restraints

15.1.1.3. Opportunities

15.1.1.4. Trends

15.2. Europe Indoor Air Quality Monitor Market, by Type of IAQ Monitor, 2017-2030(US$ Mn)

15.2.1. Overview

15.2.2. SRC Analysis

15.3. Europe Indoor Air Quality Monitor Market, by Technology, 2017-2030(US$ Mn)

15.3.1. Overview

15.3.2. SRC Analysis

15.4. Europe Indoor Air Quality Monitor Market, by End-User, 2017-2030(US$ Mn)

15.4.1. Overview

15.4.2. SRC Analysis

15.5. Europe Indoor Air Quality Monitor Market, by Parameter Measured, 2017-2030(US$ Mn)

15.5.1. Overview

15.5.2. SRC Analysis

15.6. Europe Indoor Air Quality Monitor Market, by Application, 2017-2030(US$ Mn)

15.6.1. Overview

15.6.2. SRC Analysis

15.7. Europe Indoor Air Quality Monitor Market, by Country, 2017-2030 (US$ Mn)

15.7.1. Europe Indoor Air Quality Monitor Market, by Country, 2022 Vs 2030 (in%)

15.7.2. UK

15.7.3. France

15.7.4. Germany

15.7.5. Italy

15.7.6. Spain

15.7.7. Benelux

15.7.8. Russia

15.7.9. Rest of Europe


16. Asia Pacific Indoor Air Quality Monitor Market Analysis

16.1. Overview

16.1.1. Market Dynamics for North America

16.1.1.1. Drivers

16.1.1.2. Restraints

16.1.1.3. Opportunities

16.1.1.4. Trends

16.2. Asia Pacific Indoor Air Quality Monitor Market, by Type of IAQ Monitor, 2017-2030(US$ Mn)

16.2.1. Overview

16.2.2. SRC Analysis

16.3. Asia Pacific Indoor Air Quality Monitor Market, by Technology, 2017-2030(US$ Mn)

16.3.1. Overview

16.3.2. SRC Analysis

16.4. Asia Pacific Indoor Air Quality Monitor Market, by End-User, 2017-2030(US$ Mn)

16.4.1. Overview

16.4.2. SRC Analysis

16.5. Asia Pacific Indoor Air Quality Monitor Market, by Parameter Measured, 2017-2030(US$ Mn)

16.5.1. Overview

16.5.2. SRC Analysis

16.6. Asia Pacific Indoor Air Quality Monitor Market, by Application, 2017-2030(US$ Mn)

16.6.1. Overview

16.6.2. SRC Analysis

16.7. Asia Pacific Indoor Air Quality Monitor Market, by Country, 2017-2030 (US$ Mn)

16.7.1. Asia Pacific Indoor Air Quality Monitor Market, by Country, 2022 Vs 2030 (in%)

16.7.2. China

16.7.3. Japan

16.7.4. India

16.7.5. South Korea

16.7.6. South East Asia

16.7.7. Rest of Asia Pacific


17. Latin America Indoor Air Quality Monitor Market Analysis

17.1. Overview

17.1.1. Market Dynamics for North America

17.1.1.1. Drivers

17.1.1.2. Restraints

17.1.1.3. Opportunities

17.1.1.4. Trends

17.2. Latin America Indoor Air Quality Monitor Market, by Type of IAQ Monitor, 2017-2030(US$ Mn)

17.2.1. Overview

17.2.2. SRC Analysis

17.3. Latin America Indoor Air Quality Monitor Market, by Technology, 2017-2030(US$ Mn)

17.3.1. Overview

17.3.2. SRC Analysis

17.4. Latin America Indoor Air Quality Monitor Market, by End-User, 2017-2030(US$ Mn)

17.4.1. Overview

17.4.2. SRC Analysis

17.5. Latin America Indoor Air Quality Monitor Market, by Parameter Measured, 2017-2030(US$ Mn)

17.5.1. Overview

17.5.2. SRC Analysis

17.6. Latin America Indoor Air Quality Monitor Market, by Application, 2017-2030(US$ Mn)

17.6.1. Overview

17.6.2. SRC Analysis

17.7. Latin America Indoor Air Quality Monitor Market, by Country, 2017-2030 (US$ Mn)

17.7.1. Latin America Indoor Air Quality Monitor Market, by Country, 2022 Vs 2030 (in%)

17.7.2. Brazil

17.7.3. Argentina

17.7.4. Rest of Latin America


18. Middle East Indoor Air Quality Monitor Market Analysis

18.1. Overview

18.1.1. Market Dynamics for North America

18.1.1.1. Drivers

18.1.1.2. Restraints

18.1.1.3. Opportunities

18.1.1.4. Trends

18.2. Middle East Indoor Air Quality Monitor Market, by Type of IAQ Monitor, 2017-2030(US$ Mn)

18.2.1. Overview

18.2.2. SRC Analysis

18.3. Middle East Indoor Air Quality Monitor Market, by Technology, 2017-2030(US$ Mn)

18.3.1. Overview

18.3.2. SRC Analysis

18.4. Middle East Indoor Air Quality Monitor Market, by End-User, 2017-2030(US$ Mn)

18.4.1. Overview

18.4.2. SRC Analysis

18.5. Middle East Indoor Air Quality Monitor Market, by Parameter Measured, 2017-2030(US$ Mn)

18.5.1. Overview

18.5.2. SRC Analysis

18.6. Middle East Indoor Air Quality Monitor Market, by Application, 2017-2030(US$ Mn)

18.6.1. Overview

18.6.2. SRC Analysis

18.7. Middle East Indoor Air Quality Monitor Market, by Country, 2017-2030 (US$ Mn)

18.7.1. Middle East Indoor Air Quality Monitor Market, by Country, 2022 Vs 2030 (in%)

18.7.2. UAE

18.7.3. Saudi Arabia

18.7.4. Rest of Middle East


19. Africa Indoor Air Quality Monitor Market Analysis

19.1. Overview

19.1.1. Market Dynamics for North America

19.1.1.1. Drivers

19.1.1.2. Restraints

19.1.1.3. Opportunities

19.1.1.4. Trends

19.2. Africa Indoor Air Quality Monitor Market, by Type of IAQ Monitor, 2017-2030(US$ Mn)

19.2.1. Overview

19.2.2. SRC Analysis

19.3. Africa Indoor Air Quality Monitor Market, by Technology, 2017-2030(US$ Mn)

19.3.1. Overview

19.3.2. SRC Analysis

19.4. Africa Indoor Air Quality Monitor Market, by End-User, 2017-2030(US$ Mn)

19.4.1. Overview

19.4.2. SRC Analysis

19.5. Africa Indoor Air Quality Monitor Market, by Parameter Measured, 2017-2030(US$ Mn)

19.5.1. Overview

19.5.2. SRC Analysis

19.6. Africa Indoor Air Quality Monitor Market, by Application, 2017-2030(US$ Mn)

19.6.1. Overview

19.6.2. SRC Analysis

19.7. Africa Indoor Air Quality Monitor Market, by Country, 2017-2030 (US$ Mn)

19.7.1. Middle East Indoor Air Quality Monitor Market, by Country, 2022 Vs 2030 (in%)

19.7.2. South Africa

19.7.3. Egypt

19.7.4. Rest of Africa


20. Company Profiles

20.1. 3M Company

20.1.1. Company Overview

20.1.2. Products/Services Portfolio

20.1.3. Geographical Presence

20.1.4. SWOT Analysis

20.1.5. Financial Summary

20.1.5.1. Market Revenue and Net Profit (2019-2022)

20.1.5.2. Business Segment Revenue Analysis

20.1.5.3. Geographical Revenue Analysis

20.2. Agilent Technologies Inc

20.3. Acoem Group

20.4. Bacharach Inc

20.5. Aeroqual Limited

20.6. Ambient Weather

20.7. Awair Inc

20.8. Airboxlab SA (Foobot)

20.9. Airveda Technologies Pvt Ltd

20.10. Alpha Controls & Instrumentation Inc

20.11. Autotronic Enterprise Co. Ltd

20.12. AZ Instrument Corp.

20.13. Airthings

20.14. Aircuity Inc

20.15. AMETEK MOCON

20.16. Others


21. Research Methodology

21.1. Research Methodology

21.2. Phase I – Secondary Research

21.3. Phase II – Data Modelling

21.3.1. Company Share Analysis Model

21.3.2. Revenue Based Modelling

21.4. Phase III – Primary Research

21.5. Research Limitations

21.5.1. Assumptions


List of Figures

FIG. 1 Global Indoor Air Quality Monitor Market: Research Methodology

FIG. 2 Market Size Estimation – Top Down & Bottom Up Approach

FIG. 3 Global Indoor Air Quality Monitor Market Segmentation

FIG. 4 Global Indoor Air Quality Monitor Market, by Type of IAQ Monitor, 2022 (US$ Mn)

FIG. 5 Global Indoor Air Quality Monitor Market, by Technology, 2022 (US$ Mn)

FIG. 6 Global Indoor Air Quality Monitor Market, by End-User, 2022 (US$ Mn)

FIG. 7 Global Indoor Air Quality Monitor Market, by Parameter Measured, 2022 (US$ Mn)

FIG. 8 Global Indoor Air Quality Monitor Market, by Application, 2022 (US$ Mn)

FIG. 9 Global Indoor Air Quality Monitor Market, by Geography, 2022 (US$ Mn)

FIG. 10 Attractive Investment Proposition, by Type of IAQ Monitor, 2022

FIG. 11 Attractive Investment Proposition, by Technology, 2022

FIG. 12 Attractive Investment Proposition, by End-User, 2022

FIG. 13 Attractive Investment Proposition, by Parameter Measured, 2022

FIG. 14 Attractive Investment Proposition, by Application, 2022

FIG. 15 Attractive Investment Proposition, by Geography, 2022

FIG. 16 Global Market Share Analysis of Key Indoor Air Quality Monitor Market Manufacturers, 2022

FIG. 17 Global Market Positioning of Key Indoor Air Quality Monitor Market Manufacturers, 2022

FIG. 18 Global Indoor Air Quality Monitor Market Value Contribution, By Type of IAQ Monitor, 2022 & 2030 (Value %)

FIG. 19 Global Indoor Air Quality Monitor Market, by Chemical Sensors, Value, 2017-2030 (US$ Mn)

FIG. 20 Global Indoor Air Quality Monitor Market, by Particulate Matter (PM) Monitors, Value, 2017-2030 (US$ Mn)

FIG. 21 Global Indoor Air Quality Monitor Market, by Biological Sensors, Value, 2017-2030 (US$ Mn)

FIG. 22 Global Indoor Air Quality Monitor Market, by Multi-Parameter Monitors, Value, 2017-2030 (US$ Mn)

FIG. 23 Global Indoor Air Quality Monitor Market Value Contribution, By Technology, 2022 & 2030 (Value %)

FIG. 24 Global Indoor Air Quality Monitor Market, by Wired IAQ Monitors, Value, 2017-2030 (US$ Mn)

FIG. 25 Global Indoor Air Quality Monitor Market, by Wireless IAQ Monitors, Value, 2017-2030 (US$ Mn)

FIG. 26 Global Indoor Air Quality Monitor Market, by Portable IAQ Monitors, Value, 2017-2030 (US$ Mn)

FIG. 27 Global Indoor Air Quality Monitor Market, by Fixed IAQ Monitors, Value, 2017-2030 (US$ Mn)

FIG. 28 Global Indoor Air Quality Monitor Market Value Contribution, By End-User, 2022 & 2030 (Value %)

FIG. 29 Global Indoor Air Quality Monitor Market, by Homeowners, Value, 2017-2030 (US$ Mn)

FIG. 30 Global Indoor Air Quality Monitor Market, by Building Owners and Managers, Value, 2017-2030 (US$ Mn)

FIG. 31 Global Indoor Air Quality Monitor Market, by Industrial Facility Managers, Value, 2017-2030 (US$ Mn)

FIG. 32 Global Indoor Air Quality Monitor Market, by Healthcare Administrators, Value, 2017-2030 (US$ Mn)

FIG. 33 Global Indoor Air Quality Monitor Market, by Government and Regulatory Bodies, Value, 2017-2030 (US$ Mn)

FIG. 34 Global Indoor Air Quality Monitor Market, by Research and Laboratory Professionals, Value, 2017-2030 (US$ Mn)

FIG. 35 Global Indoor Air Quality Monitor Market Value Contribution, By Parameter Measured, 2022 & 2030 (Value %)

FIG. 36 Global Indoor Air Quality Monitor Market, by Chemical Pollutants, Value, 2017-2030 (US$ Mn)

FIG. 37 Global Indoor Air Quality Monitor Market, by Particulate Matter (PM), Value, 2017-2030 (US$ Mn)

FIG. 38 Global Indoor Air Quality Monitor Market, by Biological Contaminants, Value, 2017-2030 (US$ Mn)

FIG. 39 Global Indoor Air Quality Monitor Market, by Temperature and Humidity, Value, 2017-2030 (US$ Mn)

FIG. 40 Global Indoor Air Quality Monitor Market, by Multiple Parameters, Value, 2017-2030 (US$ Mn)

FIG. 41 Global Indoor Air Quality Monitor Market Value Contribution, By Application, 2022 & 2030 (Value %)

FIG. 42 Global Indoor Air Quality Monitor Market, by Residential, Value, 2017-2030 (US$ Mn)

FIG. 43 Global Indoor Air Quality Monitor Market, by Commercial, Value, 2017-2030 (US$ Mn)

FIG. 44 Global Indoor Air Quality Monitor Market, by Industrial, Value, 2017-2030 (US$ Mn)

FIG. 45 Global Indoor Air Quality Monitor Market, by Healthcare, Value, 2017-2030 (US$ Mn)

FIG. 46 Global Indoor Air Quality Monitor Market, by Transportation, Value, 2017-2030 (US$ Mn)

FIG. 47 Global Indoor Air Quality Monitor Market, by Research and Laboratory, Value, 2017-2030 (US$ Mn)

FIG. 48 Global Indoor Air Quality Monitor Market, by Others, Value, 2017-2030 (US$ Mn)

FIG. 49 North America Indoor Air Quality Monitor Market, 2017-2030 (US$ Mn)

FIG. 50 U.S. Indoor Air Quality Monitor Market, 2017-2030 (US$ Mn)

FIG. 51 Canada Indoor Air Quality Monitor Market, 2017-2030 (US$ Mn)

FIG. 52 Mexico Indoor Air Quality Monitor Market, 2017-2030 (US$ Mn)

FIG. 53 Europe Indoor Air Quality Monitor Market, 2017-2030 (US$ Mn)

FIG. 54 Germany Indoor Air Quality Monitor Market, 2017-2030 (US$ Mn)

FIG. 55 France Indoor Air Quality Monitor Market, 2017-2030 (US$ Mn)

FIG. 56 U.K. Indoor Air Quality Monitor Market, 2017-2030 (US$ Mn)

FIG. 57 Italy Indoor Air Quality Monitor Market, 2017-2030 (US$ Mn)

FIG. 58 Spain Indoor Air Quality Monitor Market, 2017-2030 (US$ Mn)

FIG. 59 Benelux Indoor Air Quality Monitor Market, 2017-2030 (US$ Mn)

FIG. 60 Russia Indoor Air Quality Monitor Market, 2017-2030 (US$ Mn)

FIG. 61 Rest of Europe Indoor Air Quality Monitor Market, 2017-2030 (US$ Mn)

FIG. 62 Asia Pacific Indoor Air Quality Monitor Market, 2017-2030 (US$ Mn)

FIG. 63 China Indoor Air Quality Monitor Market, 2017-2030 (US$ Mn)

FIG. 64 Japan Indoor Air Quality Monitor Market, 2017-2030 (US$ Mn)

FIG. 65 India Indoor Air Quality Monitor Market, 2017-2030 (US$ Mn)

FIG. 66 South Korea Indoor Air Quality Monitor Market, 2017-2030 (US$ Mn)

FIG. 67 South-East Asia Indoor Air Quality Monitor Market, 2017-2030 (US$ Mn)

FIG. 68 Rest of Asia Pacific Indoor Air Quality Monitor Market, 2017-2030 (US$ Mn)

FIG. 69 Latin America Indoor Air Quality Monitor Market, 2017-2030 (US$ Mn)

FIG. 70 Brazil Indoor Air Quality Monitor Market, 2017-2030 (US$ Mn)

FIG. 71 Argentina Indoor Air Quality Monitor Market, 2017-2030 (US$ Mn)

FIG. 72 Rest of Latin America Indoor Air Quality Monitor Market, 2017-2030 (US$ Mn)

FIG. 73 Middle East Indoor Air Quality Monitor Market, 2017-2030 (US$ Mn)

FIG. 74 UAE Indoor Air Quality Monitor Market, 2017-2030 (US$ Mn)

FIG. 75 Saudi Arabia Indoor Air Quality Monitor Market, 2017-2030 (US$ Mn)

FIG. 76 Rest of Middle East Indoor Air Quality Monitor Market, 2017-2030 (US$ Mn)

FIG. 77 Africa Indoor Air Quality Monitor Market, 2017-2030 (US$ Mn)

FIG. 78 South Africa Indoor Air Quality Monitor Market, 2017-2030 (US$ Mn)

FIG. 79 Egypt Indoor Air Quality Monitor Market, 2017-2030 (US$ Mn)

FIG. 80 Rest of Africa Indoor Air Quality Monitor Market, 2017-2030 (US$ Mn)


List of Tables

TABLE 1 Market Snapshot: Global Indoor Air Quality Monitor Market

TABLE 2 Global Indoor Air Quality Monitor Market: Market Drivers Impact Analysis

TABLE 3 Global Indoor Air Quality Monitor Market: Market Restraints Impact Analysis

TABLE 4 Global Indoor Air Quality Monitor Market, by Competitive Benchmarking, 2022

TABLE 5 Global Indoor Air Quality Monitor Market, by Geographical Presence Analysis, 2022

TABLE 6 Global Indoor Air Quality Monitor Market, by Key Strategies Analysis, 2022

TABLE 7 Global Indoor Air Quality Monitor Market, by Chemical Sensors, By Region, 2017-2022 (US$ Mn)

TABLE 8 Global Indoor Air Quality Monitor Market, by Chemical Sensors, By Region, 2023-2030 (US$ Mn)

TABLE 9 Global Indoor Air Quality Monitor Market, by Particulate Matter (PM) Monitors, By Region, 2017-2022 (US$ Mn)

TABLE 10 Global Indoor Air Quality Monitor Market, by Particulate Matter (PM) Monitors, By Region, 2023-2030 (US$ Mn)

TABLE 11 Global Indoor Air Quality Monitor Market, by Biological Sensors, By Region, 2017-2022 (US$ Mn)

TABLE 12 Global Indoor Air Quality Monitor Market, by Biological Sensors, By Region, 2023-2030 (US$ Mn)

TABLE 13 Global Indoor Air Quality Monitor Market, by Multi-Parameter Monitors, By Region, 2017-2022 (US$ Mn)

TABLE 14 Global Indoor Air Quality Monitor Market, by Multi-Parameter Monitors, By Region, 2023-2030 (US$ Mn)

TABLE 15 Global Indoor Air Quality Monitor Market, by Wired IAQ Monitors, By Region, 2017-2022 (US$ Mn)

TABLE 16 Global Indoor Air Quality Monitor Market, by Wired IAQ Monitors, By Region, 2023-2030 (US$ Mn)

TABLE 17 Global Indoor Air Quality Monitor Market, by Wireless IAQ Monitors, By Region, 2017-2022 (US$ Mn)

TABLE 18 Global Indoor Air Quality Monitor Market, by Wireless IAQ Monitors, By Region, 2023-2030 (US$ Mn)

TABLE 19 Global Indoor Air Quality Monitor Market, by Fixed IAQ Monitors, By Region, 2017-2022 (US$ Mn)

TABLE 20 Global Indoor Air Quality Monitor Market, by Fixed IAQ Monitors, By Region, 2023-2030 (US$ Mn)

TABLE 21 Global Indoor Air Quality Monitor Market, by Portable IAQ Monitors, By Region, 2017-2022 (US$ Mn)

TABLE 22 Global Indoor Air Quality Monitor Market, by Portable IAQ Monitors, By Region, 2023-2030 (US$ Mn)

TABLE 23 Global Indoor Air Quality Monitor Market, by Homeowners, By Region, 2017-2022 (US$ Mn)

TABLE 24 Global Indoor Air Quality Monitor Market, by Homeowners, By Region, 2023-2030 (US$ Mn)

TABLE 25 Global Indoor Air Quality Monitor Market, by Building Owners and Managers, By Region, 2017-2022 (US$ Mn)

TABLE 26 Global Indoor Air Quality Monitor Market, by Building Owners and Managers, By Region, 2023-2030 (US$ Mn)

TABLE 27 Global Indoor Air Quality Monitor Market, by Industrial Facility Managers, By Region, 2017-2022 (US$ Mn)

TABLE 28 Global Indoor Air Quality Monitor Market, by Industrial Facility Managers, By Region, 2023-2030 (US$ Mn)

TABLE 29 Global Indoor Air Quality Monitor Market, by Healthcare Administrators, By Region, 2017-2022 (US$ Mn)

TABLE 30 Global Indoor Air Quality Monitor Market, by Healthcare Administrators, By Region, 2023-2030 (US$ Mn)

TABLE 31 Global Indoor Air Quality Monitor Market, by Government and Regulatory Bodies, By Region, 2017-2022 (US$ Mn)

TABLE 32 Global Indoor Air Quality Monitor Market, by Government and Regulatory Bodies, By Region, 2023-2030 (US$ Mn)

TABLE 33 Global Indoor Air Quality Monitor Market, by Research and Laboratory Professionals, By Region, 2017-2022 (US$ Mn)

TABLE 34 Global Indoor Air Quality Monitor Market, by Research and Laboratory Professionals, By Region, 2023-2030 (US$ Mn)

TABLE 35 Global Indoor Air Quality Monitor Market, by Chemical Pollutants, By Region, 2017-2022 (US$ Mn)

TABLE 36 Global Indoor Air Quality Monitor Market, by Chemical Pollutants, By Region, 2023-2030 (US$ Mn)

TABLE 37 Global Indoor Air Quality Monitor Market, by Particulate Matter (PM), By Region, 2017-2022 (US$ Mn)

TABLE 38 Global Indoor Air Quality Monitor Market, by Particulate Matter (PM), By Region, 2023-2030 (US$ Mn)

TABLE 39 Global Indoor Air Quality Monitor Market, by Biological Contaminants, By Region, 2017-2022 (US$ Mn)

TABLE 40 Global Indoor Air Quality Monitor Market, by Biological Contaminants, By Region, 2023-2030 (US$ Mn)

TABLE 41 Global Indoor Air Quality Monitor Market, by Temperature and Humidity, By Region, 2017-2022 (US$ Mn)

TABLE 42 Global Indoor Air Quality Monitor Market, by Temperature and Humidity, By Region, 2023-2030 (US$ Mn)

TABLE 43 Global Indoor Air Quality Monitor Market, by Multiple Parameters, By Region, 2017-2022 (US$ Mn)

TABLE 44 Global Indoor Air Quality Monitor Market, by Multiple Parameters, By Region, 2023-2030 (US$ Mn)

TABLE 45 Global Indoor Air Quality Monitor Market, by Residential, By Region, 2017-2022 (US$ Mn)

TABLE 46 Global Indoor Air Quality Monitor Market, by Residential, By Region, 2023-2030 (US$ Mn)

TABLE 47 Global Indoor Air Quality Monitor Market, by Commercial, By Region, 2017-2022 (US$ Mn)

TABLE 48 Global Indoor Air Quality Monitor Market, by Commercial, By Region, 2023-2030 (US$ Mn)

TABLE 49 Global Indoor Air Quality Monitor Market, by Industrial, By Region, 2017-2022 (US$ Mn)

TABLE 50 Global Indoor Air Quality Monitor Market, by Industrial, By Region, 2023-2030 (US$ Mn)

TABLE 51 Global Indoor Air Quality Monitor Market, by Healthcare, By Region, 2017-2022 (US$ Mn)

TABLE 52 Global Indoor Air Quality Monitor Market, by Healthcare, By Region, 2023-2030 (US$ Mn)

TABLE 53 Global Indoor Air Quality Monitor Market, by Transportation, By Region, 2017-2022 (US$ Mn)

TABLE 54 Global Indoor Air Quality Monitor Market, by Transportation, By Region, 2023-2030 (US$ Mn)

TABLE 55 Global Indoor Air Quality Monitor Market, by Research and Laboratory, By Region, 2017-2022 (US$ Mn)

TABLE 56 Global Indoor Air Quality Monitor Market, by Research and Laboratory, By Region, 2023-2030 (US$ Mn)

TABLE 57 Global Indoor Air Quality Monitor Market, by Others, By Region, 2017-2022 (US$ Mn)

TABLE 58 Global Indoor Air Quality Monitor Market, by Others, By Region, 2023-2030 (US$ Mn)

TABLE 59 Global Indoor Air Quality Monitor Market, by Type of IAQ Monitor, 2017-2022 (US$ Mn)

TABLE 60 Global Indoor Air Quality Monitor Market, by Type of IAQ Monitor, 2023-2030 (US$ Mn)

TABLE 61 Global Indoor Air Quality Monitor Market, by Technology, 2017-2022 (US$ Mn)

TABLE 62 Global Indoor Air Quality Monitor Market, by Technology, 2023-2030 (US$ Mn)

TABLE 63 Global Indoor Air Quality Monitor Market, by End-User, 2017-2022 (US$ Mn)

TABLE 64 Global Indoor Air Quality Monitor Market, by End-User, 2023-2030 (US$ Mn)

TABLE 65 Global Indoor Air Quality Monitor Market, by Parameter Measured, 2017-2022 (US$ Mn)

TABLE 66 Global Indoor Air Quality Monitor Market, by Parameter Measured, 2023-2030 (US$ Mn)

TABLE 67 Global Indoor Air Quality Monitor Market, by Application, 2017-2022 (US$ Mn)

TABLE 68 Global Indoor Air Quality Monitor Market, by Application, 2023-2030 (US$ Mn)

TABLE 69 Global Indoor Air Quality Monitor Market, by Region, 2017-2022 (US$ Mn)

TABLE 70 Global Indoor Air Quality Monitor Market, by Region, 2023-2030 (US$ Mn)

TABLE 71 North America Indoor Air Quality Monitor Market, by Type of IAQ Monitor, 2017-2022 (US$ Mn)

TABLE 72 North America Indoor Air Quality Monitor Market, by Type of IAQ Monitor, 2023-2030 (US$ Mn)

TABLE 73 North America Indoor Air Quality Monitor Market, by Technology, 2017-2022 (US$ Mn)

TABLE 74 North America Indoor Air Quality Monitor Market, by Technology, 2023-2030 (US$ Mn)

TABLE 75 North America Indoor Air Quality Monitor Market, by End-User, 2017-2022 (US$ Mn)

TABLE 76 North America Indoor Air Quality Monitor Market, by End-User, 2023-2030 (US$ Mn)

TABLE 77 North America Indoor Air Quality Monitor Market, by Parameter Measured, 2017-2022 (US$ Mn)

TABLE 78 North America Indoor Air Quality Monitor Market, by Parameter Measured, 2023-2030 (US$ Mn)

TABLE 79 North America Indoor Air Quality Monitor Market, by Application, 2017-2022 (US$ Mn)

TABLE 80 North America Indoor Air Quality Monitor Market, by Application, 2023-2030 (US$ Mn)

TABLE 81 North America Indoor Air Quality Monitor Market, by Country, 2017-2022 (US$ Mn)

TABLE 82 North America Indoor Air Quality Monitor Market, by Country, 2023-2030 (US$ Mn)

TABLE 83 United States Indoor Air Quality Monitor Market, by Type of IAQ Monitor, 2017-2022 (US$ Mn)

TABLE 84 United States Indoor Air Quality Monitor Market, by Type of IAQ Monitor, 2023-2030 (US$ Mn)

TABLE 85 United States Indoor Air Quality Monitor Market, by Technology, 2017-2022 (US$ Mn)

TABLE 86 United States Indoor Air Quality Monitor Market, by Technology, 2023-2030 (US$ Mn)

TABLE 87 United States Indoor Air Quality Monitor Market, by End-User, 2017-2022 (US$ Mn)

TABLE 88 United States Indoor Air Quality Monitor Market, by End-User, 2023-2030 (US$ Mn)

TABLE 89 United States Indoor Air Quality Monitor Market, by Parameter Measured, 2017-2022 (US$ Mn)

TABLE 90 United States Indoor Air Quality Monitor Market, by Parameter Measured, 2023-2030 (US$ Mn)

TABLE 91 United States Indoor Air Quality Monitor Market, by Application, 2017-2022 (US$ Mn)

TABLE 92 United States Indoor Air Quality Monitor Market, by Application, 2023-2030 (US$ Mn)

TABLE 93 Canada Indoor Air Quality Monitor Market, by Type of IAQ Monitor, 2017-2022 (US$ Mn)

TABLE 94 Canada Indoor Air Quality Monitor Market, by Type of IAQ Monitor, 2023-2030 (US$ Mn)

TABLE 95 Canada Indoor Air Quality Monitor Market, by Technology, 2017-2022 (US$ Mn)

TABLE 96 Canada Indoor Air Quality Monitor Market, by Technology, 2023-2030 (US$ Mn)

TABLE 97 Canada Indoor Air Quality Monitor Market, by End-User, 2017-2022 (US$ Mn)

TABLE 98 Canada Indoor Air Quality Monitor Market, by End-User, 2023-2030 (US$ Mn)

TABLE 99 Canada Indoor Air Quality Monitor Market, by Parameter Measured, 2017-2022 (US$ Mn)

TABLE 100 Canada Indoor Air Quality Monitor Market, by Parameter Measured, 2023-2030 (US$ Mn)

TABLE 101 Canada Indoor Air Quality Monitor Market, by Application, 2017-2022 (US$ Mn)

TABLE 102 Canada Indoor Air Quality Monitor Market, by Application, 2023-2030 (US$ Mn)

TABLE 103 Mexico Indoor Air Quality Monitor Market, by Type of IAQ Monitor, 2017-2022 (US$ Mn)

TABLE 104 Mexico Indoor Air Quality Monitor Market, by Type of IAQ Monitor, 2023-2030 (US$ Mn)

TABLE 105 Mexico Indoor Air Quality Monitor Market, by Technology, 2017-2022 (US$ Mn)

TABLE 106 Mexico Indoor Air Quality Monitor Market, by Technology, 2023-2030 (US$ Mn)

TABLE 107 Mexico Indoor Air Quality Monitor Market, by End-User, 2017-2022 (US$ Mn)

TABLE 108 Mexico Indoor Air Quality Monitor Market, by End-User, 2023-2030 (US$ Mn)

TABLE 109 Mexico Indoor Air Quality Monitor Market, by Parameter Measured, 2017-2022 (US$ Mn)

TABLE 110 Mexico Indoor Air Quality Monitor Market, by Parameter Measured, 2023-2030 (US$ Mn)

TABLE 111 Mexico Indoor Air Quality Monitor Market, by Application, 2017-2022 (US$ Mn)

TABLE 112 Mexico Indoor Air Quality Monitor Market, by Application, 2023-2030 (US$ Mn)

TABLE 113 Europe Indoor Air Quality Monitor Market, by Type of IAQ Monitor, 2017-2022 (US$ Mn)

TABLE 114 Europe Indoor Air Quality Monitor Market, by Type of IAQ Monitor, 2023-2030 (US$ Mn)

TABLE 115 Europe Indoor Air Quality Monitor Market, by Technology, 2017-2022 (US$ Mn)

TABLE 116 Europe Indoor Air Quality Monitor Market, by Technology, 2023-2030 (US$ Mn)

TABLE 117 Europe Indoor Air Quality Monitor Market, by End-User, 2017-2022 (US$ Mn)

TABLE 118 Europe Indoor Air Quality Monitor Market, by End-User, 2023-2030 (US$ Mn)

TABLE 119 Europe Indoor Air Quality Monitor Market, by Parameter Measured, 2017-2022 (US$ Mn)

TABLE 120 Europe Indoor Air Quality Monitor Market, by Parameter Measured, 2023-2030 (US$ Mn)

TABLE 121 Europe Indoor Air Quality Monitor Market, by Application, 2017-2022 (US$ Mn)

TABLE 122 Europe Indoor Air Quality Monitor Market, by Application, 2023-2030 (US$ Mn)

TABLE 123 Europe Indoor Air Quality Monitor Market, by Country, 2017-2022 (US$ Mn)

TABLE 124 Europe Indoor Air Quality Monitor Market, by Country, 2023-2030 (US$ Mn)

TABLE 125 Germany Indoor Air Quality Monitor Market, by Type of IAQ Monitor, 2017-2022 (US$ Mn)

TABLE 126 Germany Indoor Air Quality Monitor Market, by Type of IAQ Monitor, 2023-2030 (US$ Mn)

TABLE 127 Germany Indoor Air Quality Monitor Market, by Technology, 2017-2022 (US$ Mn)

TABLE 128 Germany Indoor Air Quality Monitor Market, by Technology, 2023-2030 (US$ Mn)

TABLE 129 Germany Indoor Air Quality Monitor Market, by End-User, 2017-2022 (US$ Mn)

TABLE 130 Germany Indoor Air Quality Monitor Market, by End-User, 2023-2030 (US$ Mn)

TABLE 131 Germany Indoor Air Quality Monitor Market, by Parameter Measured, 2017-2022 (US$ Mn)

TABLE 132 Germany Indoor Air Quality Monitor Market, by Parameter Measured, 2023-2030 (US$ Mn)

TABLE 133 Germany Indoor Air Quality Monitor Market, by Application, 2017-2022 (US$ Mn)

TABLE 134 Germany Indoor Air Quality Monitor Market, by Application, 2023-2030 (US$ Mn)

TABLE 135 France Indoor Air Quality Monitor Market, by Type of IAQ Monitor, 2017-2022 (US$ Mn)

TABLE 136 France Indoor Air Quality Monitor Market, by Type of IAQ Monitor, 2023-2030 (US$ Mn)

TABLE 137 France Indoor Air Quality Monitor Market, by Technology, 2017-2022 (US$ Mn)

TABLE 138 France Indoor Air Quality Monitor Market, by Technology, 2023-2030 (US$ Mn)

TABLE 139 France Indoor Air Quality Monitor Market, by End-User, 2017-2022 (US$ Mn)

TABLE 140 France Indoor Air Quality Monitor Market, by End-User, 2023-2030 (US$ Mn)

TABLE 141 France Indoor Air Quality Monitor Market, by Parameter Measured, 2017-2022 (US$ Mn)

TABLE 142 France Indoor Air Quality Monitor Market, by Parameter Measured, 2023-2030 (US$ Mn)

TABLE 143 France Indoor Air Quality Monitor Market, by Application, 2017-2022 (US$ Mn)

TABLE 144 France Indoor Air Quality Monitor Market, by Application, 2023-2030 (US$ Mn)

TABLE 145 United Kingdom Indoor Air Quality Monitor Market, by Type of IAQ Monitor, 2017-2022 (US$ Mn)

TABLE 146 United Kingdom Indoor Air Quality Monitor Market, by Type of IAQ Monitor, 2023-2030 (US$ Mn)

TABLE 147 United Kingdom Indoor Air Quality Monitor Market, by Technology, 2017-2022 (US$ Mn)

TABLE 148 United Kingdom Indoor Air Quality Monitor Market, by Technology, 2023-2030 (US$ Mn)

TABLE 149 United Kingdom Indoor Air Quality Monitor Market, by End-User, 2017-2022 (US$ Mn)

TABLE 150 United Kingdom Indoor Air Quality Monitor Market, by End-User, 2023-2030 (US$ Mn)

TABLE 151 United Kingdom Indoor Air Quality Monitor Market, by Parameter Measured, 2017-2022 (US$ Mn)

TABLE 152 United Kingdom Indoor Air Quality Monitor Market, by Parameter Measured, 2023-2030 (US$ Mn)

TABLE 153 United Kingdom Indoor Air Quality Monitor Market, by Application, 2017-2022 (US$ Mn)

TABLE 154 United Kingdom Indoor Air Quality Monitor Market, by Application, 2023-2030 (US$ Mn)

TABLE 155 Italy Indoor Air Quality Monitor Market, by Type of IAQ Monitor, 2017-2022 (US$ Mn)

TABLE 156 Italy Indoor Air Quality Monitor Market, by Type of IAQ Monitor, 2023-2030 (US$ Mn)

TABLE 157 Italy Indoor Air Quality Monitor Market, by Technology, 2017-2022 (US$ Mn)

TABLE 158 Italy Indoor Air Quality Monitor Market, by Technology, 2023-2030 (US$ Mn)

TABLE 159 Italy Indoor Air Quality Monitor Market, by End-User, 2017-2022 (US$ Mn)

TABLE 160 Italy Indoor Air Quality Monitor Market, by End-User, 2023-2030 (US$ Mn)

TABLE 161 Italy Indoor Air Quality Monitor Market, by Parameter Measured, 2017-2022 (US$ Mn)

TABLE 162 Italy Indoor Air Quality Monitor Market, by Parameter Measured, 2023-2030 (US$ Mn)

TABLE 163 Italy Indoor Air Quality Monitor Market, by Application, 2017-2022 (US$ Mn)

TABLE 164 Italy Indoor Air Quality Monitor Market, by Application, 2023-2030 (US$ Mn)

TABLE 165 Spain Indoor Air Quality Monitor Market, by Type of IAQ Monitor, 2017-2022 (US$ Mn)

TABLE 166 Spain Indoor Air Quality Monitor Market, by Type of IAQ Monitor, 2023-2030 (US$ Mn)

TABLE 167 Spain Indoor Air Quality Monitor Market, by Technology, 2017-2022 (US$ Mn)

TABLE 168 Spain Indoor Air Quality Monitor Market, by Technology, 2023-2030 (US$ Mn)

TABLE 169 Spain Indoor Air Quality Monitor Market, by End-User, 2017-2022 (US$ Mn)

TABLE 170 Spain Indoor Air Quality Monitor Market, by End-User, 2023-2030 (US$ Mn)

TABLE 171 Spain Indoor Air Quality Monitor Market, by Parameter Measured, 2017-2022 (US$ Mn)

TABLE 172 Spain Indoor Air Quality Monitor Market, by Parameter Measured, 2023-2030 (US$ Mn)

TABLE 173 Spain Indoor Air Quality Monitor Market, by Application, 2017-2022 (US$ Mn)

TABLE 174 Spain Indoor Air Quality Monitor Market, by Application, 2023-2030 (US$ Mn)

TABLE 175 Benelux Indoor Air Quality Monitor Market, by Type of IAQ Monitor, 2017-2022 (US$ Mn)

TABLE 176 Benelux Indoor Air Quality Monitor Market, by Type of IAQ Monitor, 2023-2030 (US$ Mn)

TABLE 177 Benelux Indoor Air Quality Monitor Market, by Technology, 2017-2022 (US$ Mn)

TABLE 178 Benelux Indoor Air Quality Monitor Market, by Technology, 2023-2030 (US$ Mn)

TABLE 179 Benelux Indoor Air Quality Monitor Market, by End-User, 2017-2022 (US$ Mn)

TABLE 180 Benelux Indoor Air Quality Monitor Market, by End-User, 2023-2030 (US$ Mn)

TABLE 181 Benelux Indoor Air Quality Monitor Market, by Parameter Measured, 2017-2022 (US$ Mn)

TABLE 182 Benelux Indoor Air Quality Monitor Market, by Parameter Measured, 2023-2030 (US$ Mn)

TABLE 183 Benelux Indoor Air Quality Monitor Market, by Application, 2017-2022 (US$ Mn)

TABLE 184 Benelux Indoor Air Quality Monitor Market, by Application, 2023-2030 (US$ Mn)

TABLE 185 Russia Indoor Air Quality Monitor Market, by Type of IAQ Monitor, 2017-2022 (US$ Mn)

TABLE 186 Russia Indoor Air Quality Monitor Market, by Type of IAQ Monitor, 2023-2030 (US$ Mn)

TABLE 187 Russia Indoor Air Quality Monitor Market, by Technology, 2017-2022 (US$ Mn)

TABLE 188 Russia Indoor Air Quality Monitor Market, by Technology, 2023-2030 (US$ Mn)

TABLE 189 Russia Indoor Air Quality Monitor Market, by End-User, 2017-2022 (US$ Mn)

TABLE 190 Russia Indoor Air Quality Monitor Market, by End-User, 2023-2030 (US$ Mn)

TABLE 191 Russia Indoor Air Quality Monitor Market, by Parameter Measured, 2017-2022 (US$ Mn)

TABLE 192 Russia Indoor Air Quality Monitor Market, by Parameter Measured, 2023-2030 (US$ Mn)

TABLE 193 Russia Indoor Air Quality Monitor Market, by Application, 2017-2022 (US$ Mn)

TABLE 194 Russia Indoor Air Quality Monitor Market, by Application, 2023-2030 (US$ Mn)

TABLE 195 Rest of Europe Indoor Air Quality Monitor Market, by Type of IAQ Monitor, 2017-2022 (US$ Mn)

TABLE 196 Rest of Europe Indoor Air Quality Monitor Market, by Type of IAQ Monitor, 2023-2030 (US$ Mn)

TABLE 197 Rest of Europe Indoor Air Quality Monitor Market, by Technology, 2017-2022 (US$ Mn)

TABLE 198 Rest of Europe Indoor Air Quality Monitor Market, by Technology, 2023-2030 (US$ Mn)

TABLE 199 Rest of Europe Indoor Air Quality Monitor Market, by End-User, 2017-2022 (US$ Mn)

TABLE 200 Rest of Europe Indoor Air Quality Monitor Market, by End-User, 2023-2030 (US$ Mn)

TABLE 201 Rest of Europe Indoor Air Quality Monitor Market, by Parameter Measured, 2017-2022 (US$ Mn)

TABLE 202 Rest of Europe Indoor Air Quality Monitor Market, by Parameter Measured, 2023-2030 (US$ Mn)

TABLE 203 Rest of Europe Indoor Air Quality Monitor Market, by Application, 2017-2022 (US$ Mn)

TABLE 204 Rest of Europe Indoor Air Quality Monitor Market, by Application, 2023-2030 (US$ Mn)

TABLE 205 Asia Pacific Indoor Air Quality Monitor Market, by Type of IAQ Monitor, 2017-2022 (US$ Mn)

TABLE 206 Asia Pacific Indoor Air Quality Monitor Market, by Type of IAQ Monitor, 2023-2030 (US$ Mn)

TABLE 207 Asia Pacific Indoor Air Quality Monitor Market, by Technology, 2017-2022 (US$ Mn)

TABLE 208 Asia Pacific Indoor Air Quality Monitor Market, by Technology, 2023-2030 (US$ Mn)

TABLE 209 Asia Pacific Indoor Air Quality Monitor Market, by End-User, 2017-2022 (US$ Mn)

TABLE 210 Asia Pacific Indoor Air Quality Monitor Market, by End-User, 2023-2030 (US$ Mn)

TABLE 211 Asia Pacific Indoor Air Quality Monitor Market, by Parameter Measured, 2017-2022 (US$ Mn)

TABLE 212 Asia Pacific Indoor Air Quality Monitor Market, by Parameter Measured, 2023-2030 (US$ Mn)

TABLE 213 Asia Pacific Indoor Air Quality Monitor Market, by Application, 2017-2022 (US$ Mn)

TABLE 214 Asia Pacific Indoor Air Quality Monitor Market, by Application, 2023-2030 (US$ Mn)

TABLE 215 China Indoor Air Quality Monitor Market, by Type of IAQ Monitor, 2017-2022 (US$ Mn)

TABLE 216 China Indoor Air Quality Monitor Market, by Type of IAQ Monitor, 2023-2030 (US$ Mn)

TABLE 217 China Indoor Air Quality Monitor Market, by Technology, 2017-2022 (US$ Mn)

TABLE 218 China Indoor Air Quality Monitor Market, by Technology, 2023-2030 (US$ Mn)

TABLE 219 China Indoor Air Quality Monitor Market, by End-User, 2017-2022 (US$ Mn)

TABLE 220 China Indoor Air Quality Monitor Market, by End-User, 2023-2030 (US$ Mn)

TABLE 221 China Indoor Air Quality Monitor Market, by Parameter Measured, 2017-2022 (US$ Mn)

TABLE 222 China Indoor Air Quality Monitor Market, by Parameter Measured, 2023-2030 (US$ Mn)

TABLE 223 China Indoor Air Quality Monitor Market, by Application, 2017-2022 (US$ Mn)

TABLE 224 China Indoor Air Quality Monitor Market, by Application, 2023-2030 (US$ Mn)

TABLE 225 Japan Indoor Air Quality Monitor Market, by Type of IAQ Monitor, 2017-2022 (US$ Mn)

TABLE 226 Japan Indoor Air Quality Monitor Market, by Type of IAQ Monitor, 2023-2030 (US$ Mn)

TABLE 227 Japan Indoor Air Quality Monitor Market, by Technology, 2017-2022 (US$ Mn)

TABLE 228 Japan Indoor Air Quality Monitor Market, by Technology, 2023-2030 (US$ Mn)

TABLE 229 Japan Indoor Air Quality Monitor Market, by End-User, 2017-2022 (US$ Mn)

TABLE 230 Japan Indoor Air Quality Monitor Market, by End-User, 2023-2030 (US$ Mn)

TABLE 231 Japan Indoor Air Quality Monitor Market, by Parameter Measured, 2017-2022 (US$ Mn)

TABLE 232 Japan Indoor Air Quality Monitor Market, by Parameter Measured, 2023-2030 (US$ Mn)

TABLE 233 Japan Indoor Air Quality Monitor Market, by Application, 2017-2022 (US$ Mn)

TABLE 234 Japan Indoor Air Quality Monitor Market, by Application, 2023-2030 (US$ Mn)

TABLE 235 India Indoor Air Quality Monitor Market, by Type of IAQ Monitor, 2017-2022 (US$ Mn)

TABLE 236 India Indoor Air Quality Monitor Market, by Type of IAQ Monitor, 2023-2030 (US$ Mn)

TABLE 237 India Indoor Air Quality Monitor Market, by Technology, 2017-2022 (US$ Mn)

TABLE 238 India Indoor Air Quality Monitor Market, by Technology, 2023-2030 (US$ Mn)

TABLE 239 India Indoor Air Quality Monitor Market, by End-User, 2017-2022 (US$ Mn)

TABLE 240 India Indoor Air Quality Monitor Market, by End-User, 2023-2030 (US$ Mn)

TABLE 241 India Indoor Air Quality Monitor Market, by Parameter Measured, 2017-2022 (US$ Mn)

TABLE 242 India Indoor Air Quality Monitor Market, by Parameter Measured, 2023-2030 (US$ Mn)

TABLE 243 India Indoor Air Quality Monitor Market, by Application, 2017-2022 (US$ Mn)

TABLE 244 India Indoor Air Quality Monitor Market, by Application, 2023-2030 (US$ Mn)

TABLE 245 South Korea Indoor Air Quality Monitor Market, by Type of IAQ Monitor, 2017-2022 (US$ Mn)

TABLE 246 South Korea Indoor Air Quality Monitor Market, by Type of IAQ Monitor, 2023-2030 (US$ Mn)

TABLE 247 South Korea Indoor Air Quality Monitor Market, by Technology, 2017-2022 (US$ Mn)

TABLE 248 South Korea Indoor Air Quality Monitor Market, by Technology, 2023-2030 (US$ Mn)

TABLE 249 South Korea Indoor Air Quality Monitor Market, by End-User, 2017-2022 (US$ Mn)

TABLE 250 South Korea Indoor Air Quality Monitor Market, by End-User, 2023-2030 (US$ Mn)

TABLE 251 South Korea Indoor Air Quality Monitor Market, by Parameter Measured, 2017-2022 (US$ Mn)

TABLE 252 South Korea Indoor Air Quality Monitor Market, by Parameter Measured, 2023-2030 (US$ Mn)

TABLE 253 South Korea Indoor Air Quality Monitor Market, by Application, 2017-2022 (US$ Mn)

TABLE 254 South Korea Indoor Air Quality Monitor Market, by Application, 2023-2030 (US$ Mn)

TABLE 255 South-East Asia Indoor Air Quality Monitor Market, by Type of IAQ Monitor, 2017-2022 (US$ Mn)

TABLE 256 South-East Asia Indoor Air Quality Monitor Market, by Type of IAQ Monitor, 2023-2030 (US$ Mn)

TABLE 257 South-East Asia Indoor Air Quality Monitor Market, by Technology, 2017-2022 (US$ Mn)

TABLE 258 South-East Asia Indoor Air Quality Monitor Market, by Technology, 2023-2030 (US$ Mn)

TABLE 259 South-East Asia Indoor Air Quality Monitor Market, by End-User, 2017-2022 (US$ Mn)

TABLE 260 South-East Asia Indoor Air Quality Monitor Market, by End-User, 2023-2030 (US$ Mn)

TABLE 261 South-East Asia Indoor Air Quality Monitor Market, by Parameter Measured, 2017-2022 (US$ Mn)

TABLE 262 South-East Asia Indoor Air Quality Monitor Market, by Parameter Measured, 2023-2030 (US$ Mn)

TABLE 263 South-East Asia Indoor Air Quality Monitor Market, by Application, 2017-2022 (US$ Mn)

TABLE 264 South-East Asia Indoor Air Quality Monitor Market, by Application, 2023-2030 (US$ Mn)

TABLE 265 Rest of Asia Pacific Indoor Air Quality Monitor Market, by Type of IAQ Monitor, 2017-2022 (US$ Mn)

TABLE 266 Rest of Asia Pacific Indoor Air Quality Monitor Market, by Type of IAQ Monitor, 2023-2030 (US$ Mn)

TABLE 267 Rest of Asia Pacific Indoor Air Quality Monitor Market, by Technology, 2017-2022 (US$ Mn)

TABLE 268 Rest of Asia Pacific Indoor Air Quality Monitor Market, by Technology, 2023-2030 (US$ Mn)

TABLE 269 Rest of Asia Pacific Indoor Air Quality Monitor Market, by End-User, 2017-2022 (US$ Mn)

TABLE 270 Rest of Asia Pacific Indoor Air Quality Monitor Market, by End-User, 2023-2030 (US$ Mn)

TABLE 271 Rest of Asia Pacific Indoor Air Quality Monitor Market, by Parameter Measured, 2017-2022 (US$ Mn)

TABLE 272 Rest of Asia Pacific Indoor Air Quality Monitor Market, by Parameter Measured, 2023-2030 (US$ Mn)

TABLE 273 Rest of Asia Pacific Indoor Air Quality Monitor Market, by Application, 2017-2022 (US$ Mn)

TABLE 274 Rest of Asia Pacific Indoor Air Quality Monitor Market, by Application, 2023-2030 (US$ Mn)

TABLE 275 Latin America Indoor Air Quality Monitor Market, by Type of IAQ Monitor, 2017-2022 (US$ Mn)

TABLE 276 Latin America Indoor Air Quality Monitor Market, by Type of IAQ Monitor, 2023-2030 (US$ Mn)

TABLE 277 Latin America Indoor Air Quality Monitor Market, by Technology, 2017-2022 (US$ Mn)

TABLE 278 Latin America Indoor Air Quality Monitor Market, by Technology, 2023-2030 (US$ Mn)

TABLE 279 Latin America Indoor Air Quality Monitor Market, by End-User, 2017-2022 (US$ Mn)

TABLE 280 Latin America Indoor Air Quality Monitor Market, by End-User, 2023-2030 (US$ Mn)

TABLE 281 Latin America Indoor Air Quality Monitor Market, by Parameter Measured, 2017-2022 (US$ Mn)

TABLE 282 Latin America Indoor Air Quality Monitor Market, by Parameter Measured, 2023-2030 (US$ Mn)

TABLE 283 Latin America Indoor Air Quality Monitor Market, by Application, 2017-2022 (US$ Mn)

TABLE 284 Latin America Indoor Air Quality Monitor Market, by Application, 2023-2030 (US$ Mn)

TABLE 285 Brazil Indoor Air Quality Monitor Market, by Type of IAQ Monitor, 2017-2022 (US$ Mn)

TABLE 286 Brazil Indoor Air Quality Monitor Market, by Type of IAQ Monitor, 2023-2030 (US$ Mn)

TABLE 287 Brazil Indoor Air Quality Monitor Market, by Technology, 2017-2022 (US$ Mn)

TABLE 288 Brazil Indoor Air Quality Monitor Market, by Technology, 2023-2030 (US$ Mn)

TABLE 289 Brazil Indoor Air Quality Monitor Market, by End-User, 2017-2022 (US$ Mn)

TABLE 290 Brazil Indoor Air Quality Monitor Market, by End-User, 2023-2030 (US$ Mn)

TABLE 291 Brazil Indoor Air Quality Monitor Market, by Parameter Measured, 2017-2022 (US$ Mn)

TABLE 292 Brazil Indoor Air Quality Monitor Market, by Parameter Measured, 2023-2030 (US$ Mn)

TABLE 293 Brazil Indoor Air Quality Monitor Market, by Application, 2017-2022 (US$ Mn)

TABLE 294 Brazil Indoor Air Quality Monitor Market, by Application, 2023-2030 (US$ Mn)

TABLE 295 Argentina Indoor Air Quality Monitor Market, by Type of IAQ Monitor, 2017-2022 (US$ Mn)

TABLE 296 Argentina Indoor Air Quality Monitor Market, by Type of IAQ Monitor, 2023-2030 (US$ Mn)

TABLE 297 Argentina Indoor Air Quality Monitor Market, by Technology, 2017-2022 (US$ Mn)

TABLE 298 Argentina Indoor Air Quality Monitor Market, by Technology, 2023-2030 (US$ Mn)

TABLE 299 Argentina Indoor Air Quality Monitor Market, by End-User, 2017-2022 (US$ Mn)

TABLE 300 Argentina Indoor Air Quality Monitor Market, by End-User, 2023-2030 (US$ Mn)

TABLE 301 Argentina Indoor Air Quality Monitor Market, by Parameter Measured, 2017-2022 (US$ Mn)

TABLE 302 Argentina Indoor Air Quality Monitor Market, by Parameter Measured, 2023-2030 (US$ Mn)

TABLE 303 Argentina Indoor Air Quality Monitor Market, by Application, 2017-2022 (US$ Mn)

TABLE 304 Argentina Indoor Air Quality Monitor Market, by Application, 2023-2030 (US$ Mn)

TABLE 305 Rest of Latin America Indoor Air Quality Monitor Market, by Type of IAQ Monitor, 2017-2022 (US$ Mn)

TABLE 306 Rest of Latin America Indoor Air Quality Monitor Market, by Type of IAQ Monitor, 2023-2030 (US$ Mn)

TABLE 307 Rest of Latin America Indoor Air Quality Monitor Market, by Technology, 2017-2022 (US$ Mn)

TABLE 308 Rest of Latin America Indoor Air Quality Monitor Market, by Technology, 2023-2030 (US$ Mn)

TABLE 309 Rest of Latin America Indoor Air Quality Monitor Market, by End-User, 2017-2022 (US$ Mn)

TABLE 310 Rest of Latin America Indoor Air Quality Monitor Market, by End-User, 2023-2030 (US$ Mn)

TABLE 311 Rest of Latin America Indoor Air Quality Monitor Market, by Parameter Measured, 2017-2022 (US$ Mn)

TABLE 312 Rest of Latin America Indoor Air Quality Monitor Market, by Parameter Measured, 2023-2030 (US$ Mn)

TABLE 313 Rest of Latin America Indoor Air Quality Monitor Market, by Application, 2017-2022 (US$ Mn)

TABLE 314 Rest of Latin America Indoor Air Quality Monitor Market, by Application, 2023-2030 (US$ Mn)

TABLE 315 Middle East Indoor Air Quality Monitor Market, by Type of IAQ Monitor, 2017-2022 (US$ Mn)

TABLE 316 Middle East Indoor Air Quality Monitor Market, by Type of IAQ Monitor, 2023-2030 (US$ Mn)

TABLE 317 Middle East Indoor Air Quality Monitor Market, by Technology, 2017-2022 (US$ Mn)

TABLE 318 Middle East Indoor Air Quality Monitor Market, by Technology, 2023-2030 (US$ Mn)

TABLE 319 Middle East Indoor Air Quality Monitor Market, by End-User, 2017-2022 (US$ Mn)

TABLE 320 Middle East Indoor Air Quality Monitor Market, by End-User, 2023-2030 (US$ Mn)

TABLE 321 Middle East Indoor Air Quality Monitor Market, by Parameter Measured, 2017-2022 (US$ Mn)

TABLE 322 Middle East Indoor Air Quality Monitor Market, by Parameter Measured, 2023-2030 (US$ Mn)

TABLE 323 Middle East Indoor Air Quality Monitor Market, by Application, 2017-2022 (US$ Mn)

TABLE 324 Middle East Indoor Air Quality Monitor Market, by Application, 2023-2030 (US$ Mn)

TABLE 325 UAE Indoor Air Quality Monitor Market, by Type of IAQ Monitor, 2017-2022 (US$ Mn)

TABLE 326 UAE Indoor Air Quality Monitor Market, by Type of IAQ Monitor, 2023-2030 (US$ Mn)

TABLE 327 UAE Indoor Air Quality Monitor Market, by Technology, 2017-2022 (US$ Mn)

TABLE 328 UAE Indoor Air Quality Monitor Market, by Technology, 2023-2030 (US$ Mn)

TABLE 329 UAE Indoor Air Quality Monitor Market, by End-User, 2017-2022 (US$ Mn)

TABLE 330 UAE Indoor Air Quality Monitor Market, by End-User, 2023-2030 (US$ Mn)

TABLE 331 UAE Indoor Air Quality Monitor Market, by Parameter Measured, 2017-2022 (US$ Mn)

TABLE 332 UAE Indoor Air Quality Monitor Market, by Parameter Measured, 2023-2030 (US$ Mn)

TABLE 333 UAE Indoor Air Quality Monitor Market, by Application, 2017-2022 (US$ Mn)

TABLE 334 UAE Indoor Air Quality Monitor Market, by Application, 2023-2030 (US$ Mn)

TABLE 335 Saudi Arabia Indoor Air Quality Monitor Market, by Type of IAQ Monitor, 2017-2022 (US$ Mn)

TABLE 336 Saudi Arabia Indoor Air Quality Monitor Market, by Type of IAQ Monitor, 2023-2030 (US$ Mn)

TABLE 337 Saudi Arabia Indoor Air Quality Monitor Market, by Technology, 2017-2022 (US$ Mn)

TABLE 338 Saudi Arabia Indoor Air Quality Monitor Market, by Technology, 2023-2030 (US$ Mn)

TABLE 339 Saudi Arabia Indoor Air Quality Monitor Market, by End-User, 2017-2022 (US$ Mn)

TABLE 340 Saudi Arabia Indoor Air Quality Monitor Market, by End-User, 2023-2030 (US$ Mn)

TABLE 341 Saudi Arabia Indoor Air Quality Monitor Market, by Parameter Measured, 2017-2022 (US$ Mn)

TABLE 342 Saudi Arabia Indoor Air Quality Monitor Market, by Parameter Measured, 2023-2030 (US$ Mn)

TABLE 343 Saudi Arabia Indoor Air Quality Monitor Market, by Application, 2017-2022 (US$ Mn)

TABLE 344 Saudi Arabia Indoor Air Quality Monitor Market, by Application, 2023-2030 (US$ Mn)

TABLE 345 Rest of Middle East Indoor Air Quality Monitor Market, by Type of IAQ Monitor, 2017-2022 (US$ Mn)

TABLE 346 Rest of Middle East Indoor Air Quality Monitor Market, by Type of IAQ Monitor, 2023-2030 (US$ Mn)

TABLE 347 Rest of Middle East Indoor Air Quality Monitor Market, by Technology, 2017-2022 (US$ Mn)

TABLE 348 Rest of Middle East Indoor Air Quality Monitor Market, by Technology, 2023-2030 (US$ Mn)

TABLE 349 Rest of Middle East Indoor Air Quality Monitor Market, by End-User, 2017-2022 (US$ Mn)

TABLE 350 Rest of Middle East Indoor Air Quality Monitor Market, by End-User, 2023-2030 (US$ Mn)

TABLE 351 Rest of Middle East Indoor Air Quality Monitor Market, by Parameter Measured, 2017-2022 (US$ Mn)

TABLE 352 Rest of Middle East Indoor Air Quality Monitor Market, by Parameter Measured, 2023-2030 (US$ Mn)

TABLE 353 Rest of Middle East Indoor Air Quality Monitor Market, by Application, 2017-2022 (US$ Mn)

TABLE 354 Rest of Middle East Indoor Air Quality Monitor Market, by Application, 2023-2030 (US$ Mn)

TABLE 355 Africa Indoor Air Quality Monitor Market, by Type of IAQ Monitor, 2017-2022 (US$ Mn)

TABLE 356 Africa Indoor Air Quality Monitor Market, by Type of IAQ Monitor, 2023-2030 (US$ Mn)

TABLE 357 Africa Indoor Air Quality Monitor Market, by Technology, 2017-2022 (US$ Mn)

TABLE 358 Africa Indoor Air Quality Monitor Market, by Technology, 2023-2030 (US$ Mn)

TABLE 359 Africa Indoor Air Quality Monitor Market, by End-User, 2017-2022 (US$ Mn)

TABLE 360 Africa Indoor Air Quality Monitor Market, by End-User, 2023-2030 (US$ Mn)

TABLE 361 Africa Indoor Air Quality Monitor Market, by Parameter Measured, 2017-2022 (US$ Mn)

TABLE 362 Africa Indoor Air Quality Monitor Market, by Parameter Measured, 2023-2030 (US$ Mn)

TABLE 363 Africa Indoor Air Quality Monitor Market, by Application, 2017-2022 (US$ Mn)

TABLE 364 Africa Indoor Air Quality Monitor Market, by Application, 2023-2030 (US$ Mn)

TABLE 365 South Africa Indoor Air Quality Monitor Market, by Type of IAQ Monitor, 2017-2022 (US$ Mn)

TABLE 366 South Africa Indoor Air Quality Monitor Market, by Type of IAQ Monitor, 2023-2030 (US$ Mn)

TABLE 367 South Africa Indoor Air Quality Monitor Market, by Technology, 2017-2022 (US$ Mn)

TABLE 368 South Africa Indoor Air Quality Monitor Market, by Technology, 2023-2030 (US$ Mn)

TABLE 369 South Africa Indoor Air Quality Monitor Market, by End-User, 2017-2022 (US$ Mn)

TABLE 370 South Africa Indoor Air Quality Monitor Market, by End-User, 2023-2030 (US$ Mn)

TABLE 371 South Africa Indoor Air Quality Monitor Market, by Parameter Measured, 2017-2022 (US$ Mn)

TABLE 372 South Africa Indoor Air Quality Monitor Market, by Parameter Measured, 2023-2030 (US$ Mn)

TABLE 373 South Africa Indoor Air Quality Monitor Market, by Application, 2017-2022 (US$ Mn)

TABLE 374 South Africa Indoor Air Quality Monitor Market, by Application, 2023-2030 (US$ Mn)

TABLE 375 Egypt Indoor Air Quality Monitor Market, by Type of IAQ Monitor, 2017-2022 (US$ Mn)

TABLE 376 Egypt Indoor Air Quality Monitor Market, by Type of IAQ Monitor, 2023-2030 (US$ Mn)

TABLE 377 Egypt Indoor Air Quality Monitor Market, by Technology, 2017-2022 (US$ Mn)

TABLE 378 Egypt Indoor Air Quality Monitor Market, by Technology, 2023-2030 (US$ Mn)

TABLE 379 Egypt Indoor Air Quality Monitor Market, by End-User, 2017-2022 (US$ Mn)

TABLE 380 Egypt Indoor Air Quality Monitor Market, by End-User, 2023-2030 (US$ Mn)

TABLE 381 Egypt Indoor Air Quality Monitor Market, by Parameter Measured, 2017-2022 (US$ Mn)

TABLE 382 Egypt Indoor Air Quality Monitor Market, by Parameter Measured, 2023-2030 (US$ Mn)

TABLE 383 Egypt Indoor Air Quality Monitor Market, by Application, 2017-2022 (US$ Mn)

TABLE 384 Egypt Indoor Air Quality Monitor Market, by Application, 2023-2030 (US$ Mn)

TABLE 385 Rest of Africa Indoor Air Quality Monitor Market, by Type of IAQ Monitor, 2017-2022 (US$ Mn)

TABLE 386 Rest of Africa Indoor Air Quality Monitor Market, by Type of IAQ Monitor, 2023-2030 (US$ Mn)

TABLE 387 Rest of Africa Indoor Air Quality Monitor Market, by Technology, 2017-2022 (US$ Mn)

TABLE 388 Rest of Africa Indoor Air Quality Monitor Market, by Technology, 2023-2030 (US$ Mn)

TABLE 389 Rest of Africa Indoor Air Quality Monitor Market, by End-User, 2017-2022 (US$ Mn)

TABLE 390 Rest of Africa Indoor Air Quality Monitor Market, by End-User, 2023-2030 (US$ Mn)

TABLE 391 Rest of Africa Indoor Air Quality Monitor Market, by Parameter Measured, 2017-2022 (US$ Mn)

TABLE 392 Rest of Africa Indoor Air Quality Monitor Market, by Parameter Measured, 2023-2030 (US$ Mn)

TABLE 393 Rest of Africa Indoor Air Quality Monitor Market, by Application, 2017-2022 (US$ Mn)

TABLE 394 Rest of Africa Indoor Air Quality Monitor Market, by Application, 2023-2030 (US$ Mn)

Frequently asked questions

What is the current size of the global indoor air quality monitor market?

The global indoor air quality monitor market was valued at USD 4684.5 Million in 2022.

What is the expected growth rate of the indoor air quality monitor market between 2023 and 2030?

The indoor air quality monitor market is expected to grow at a CAGR of 8.6% between 2023 and 2030, reaching USD 9063.6 Million in 2030.

Which segment is leading the market share in terms of the type of IAQ monitor?

Chemical sensors are the leading segment by type of IAQ monitor, holding over 34% share in value in 2022.

Which technology segment governs the demand for indoor air quality monitors worldwide?

The fixed IAQ monitors segment governs the global demand for indoor air quality monitors, holding a massive share of over 36% in 2022.

Which application segment will post the highest CAGR in the forecast period?

The healthcare application segment will post the highest CAGR over the projection period.

Which region is fueling the growth of the indoor air quality monitoring industry?

With more than one-third of the market in 2022, North America is driving the expansion of the indoor air quality monitor industry.

Who are the major players in the global indoor air quality monitor market?

The top players include 3M Company, Agilent Technologies Inc, Acoem Group, Bacharach Inc, Aeroqual Limited, Ambient Weather, Awair Inc, Airboxlab SA (Foobot), Airveda Technologies Pvt Ltd, Alpha Controls & Instrumentation Inc, Autotronic Enterprise Co. Ltd, AZ Instrument Corp., Airthings, Aircuity Inc, AMETEK MOCON, and Others.

What are the major market drivers of the indoor air quality monitor industry?

Major market drivers of the indoor air quality monitoring industry include increasing health & wellness awareness, regulatory initiatives for air quality standards, and the rise of smart buildings with IoT integration.

What are the major market restraints of the indoor air quality monitor industry?

Major market restraints of the indoor air quality monitoring industry comprise the high cost of advanced monitoring solutions, limited consumer awareness, and a lack of stringent air quality regulations in some regions.

What are the major market opportunities of the indoor air quality monitor industry?

Major market opportunities for the indoor air quality monitoring industry are driven by the growing focus on healthy indoor environments and the integration of IoT technology into smart buildings to enable real-time monitoring and automated air quality improvements.

Indoor Smokehouses And Pig Roasters Market

Published:
Report ID: 68678

Indoor Farming Market

Published:
Report ID: 37634

Indoor Humidifier Market

Published:
Report ID: 35388

Indoor Location Market

Published:
Report ID: 24094

Industrial Condensing Units Market

Published:
Report ID: 75084

Digital Signage System Market

Published:
Report ID: 74839

APAC Commercial Glazing System Market

Published:
Report ID: 74169

Connected Lighting Platform Market

Published:
Report ID: 71579

Food and Beverage Air Filtration Market

Published:
Report ID: 68292

Continuous Emission Monitoring System Market

Published:
Report ID: 75604

Commercial Electric Restaurant Ranges Market

Published:
Report ID: 75549

Brazil AC-DC Power Supply in Data Center Market

Published:
Report ID: 75523

Memory Integrated Circuits Market

Published:
Report ID: 75430

Industrial Robotic Motors Market

Published:
Report ID: 75392

Hall Effect Current Sensor Market

Published:
Report ID: 75375

Flame Ionization Detectors Market

Published:
Report ID: 75356

Italy Data Center Uninterruptable Power Supply (UPS) Market

Published:
Report ID: 75246

Europe AC-DC Power Supply in Data Center Market

Published:
Report ID: 75202

Insulated Wires and Cables Market

Published:
Report ID: 75150

Fully Integrated Dishwasher Market

Published:
Report ID: 74921

Digital Signage System Market

Published:
Report ID: 74839

Purchase Options

The report comes as a view-only PDF document, optimized for individual clients. This version is recommended for personal digital use and does not allow printing.
$4699

To meet the needs of modern corporate teams, our report comes in two formats: a printable PDF and a data-rich Excel sheet. This package is optimized for internal analysis and multi-location access, making it an excellent choice for organizations with distributed workforce.
$5699

The report will be delivered in printable PDF format along with the report’s data Excel sheet. This license offers 100 Free Analyst hours where the client can utilize Credence Research Inc.’s research team. It is highly recommended for organizations seeking to execute short, customized research projects related to the scope of the purchased report.
$7699

Smallform of Sample request

Have a question?

User Profile

Don’t settle for less – trust Mitul to help you find the best solution.

Report delivery within 24 to 48 hours

– Other Info –

What people say?-

User Review

I am very impressed with the information in this report. The author clearly did their research when they came up with this product and it has already given me a lot of ideas.

Jana Schmidt
CEDAR CX Technologies

– Connect with us –

Phone

+91 6232 49 3207


support

24/7 Research Support


sales@credenceresearch.com

– Research Methodology –

Going beyond the basics: advanced techniques in research methodology

– Trusted By –

Pepshi, LG, Nestle
Motorola, Honeywell, Johnson and johnson
LG Chem, SIEMENS, Pfizer
Unilever, Samsonite, QIAGEN