Market Overview
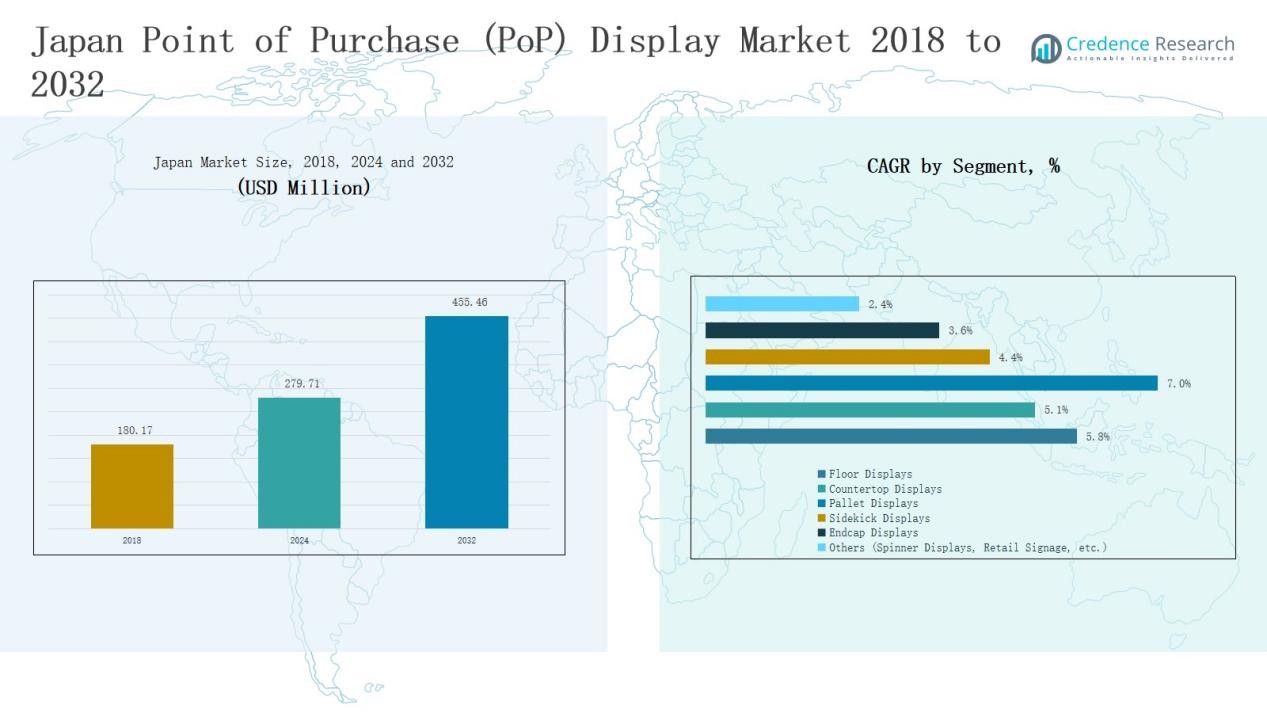
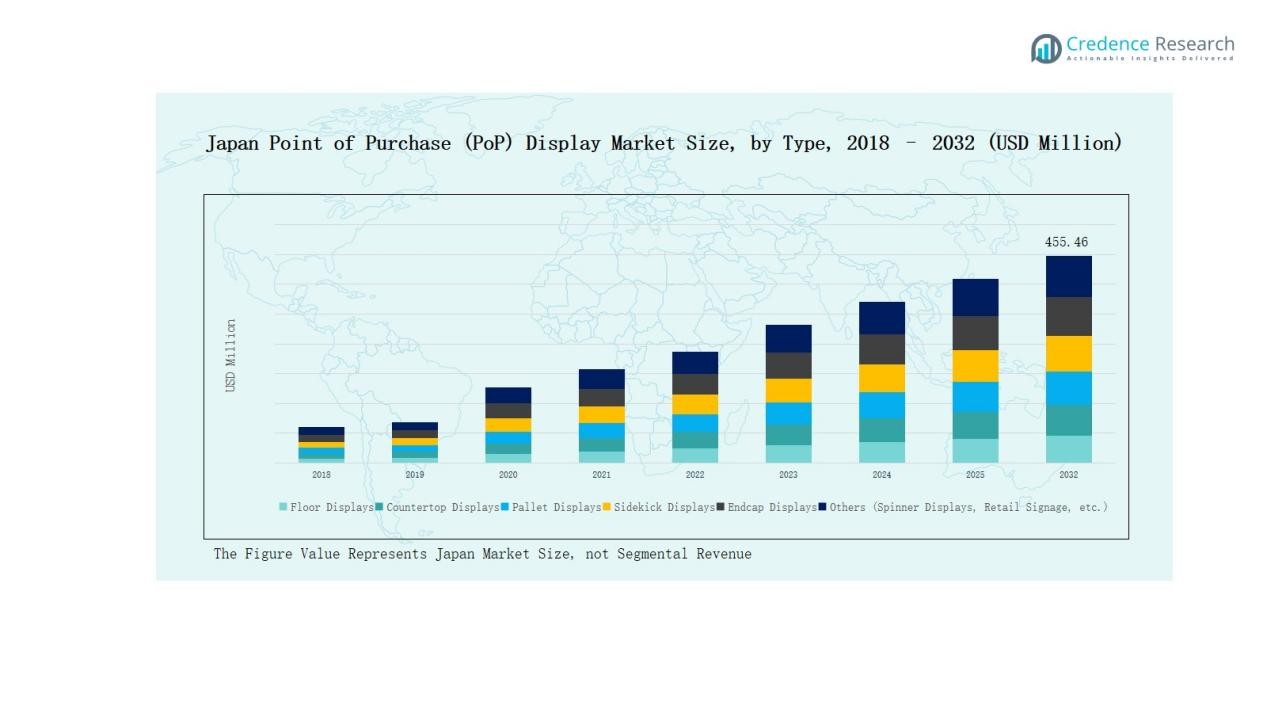
Japan Point of Purchase (PoP) Display Market size was valued at USD 180.17 million in 2018 to USD 279.71 million in 2024 and is anticipated to reach USD 455.46 million by 2032, at a CAGR of 5.85% during the forecast period.
| REPORT ATTRIBUTE |
DETAILS |
| Historical Period |
2020-2023 |
| Base Year |
2024 |
| Forecast Period |
2025-2032 |
| Japan Point of Purchase (PoP) Display Market Size 2024 |
USD 279.71 Million |
| Japan Point of Purchase (PoP) Display Market, CAGR |
5.85% |
| Japan Point of Purchase (PoP) Display Market Size 2032 |
USD 455.46 Million |
The Japan Point of Purchase (PoP) Display Market is driven by leading companies such as Toppan Printing Co., Ltd., Dai Nippon Printing Co., Ltd. (DNP), Mitsubishi Paper Mills Limited, Seiko Epson Corporation, Nippon Paper Industries Co., Ltd., Sumitomo Chemical Co., Ltd., Japan Display Inc., OSAKA Sealing Printing (OSP), Takeda Printing Co., Ltd., and Kuresha Display Co., Ltd. These players compete through advanced printing technologies, sustainable material innovations, and strong partnerships with FMCG, cosmetics, and electronics brands. Regional firms emphasize customization and cost-effective solutions to capture niche demand. Kanto emerged as the leading region with 42% share in 2024, supported by Tokyo and Yokohama’s dense retail infrastructure, high consumer spending, and strong demand for innovative display formats. This leadership is reinforced by sustainability initiatives and advanced retail networks, making Kanto the primary hub for market growth.
Access crucial information at unmatched prices!
Request your sample report today & start making informed decisions powered by Credence Research Inc.!
Download Sample
Market Insights
- Japan Point of Purchase (PoP) Display Market grew from USD 17 million in 2018 to USD 279.71 million in 2024 and will reach USD 455.46 million by 2032.
- Floor displays led with 34% share in 2024, supported by strong use in supermarkets and hypermarkets, while countertop displays followed with 22% driven by impulse purchases.
- Food and beverage applications dominated with 38% share, boosted by FMCG expansion, new product launches, and promotional activities across convenience stores and supermarkets.
- Temporary PoP displays held 62% share, favored for seasonal campaigns and FMCG turnover, while permanent displays captured 38% through cosmetics and electronics retail adoption.
- Kanto commanded 42% share in 2024, followed by Kansai at 25%, Chubu at 18%, and other regions together contributing 15% supported by tourism and regional retail networks.
Market Segment Insights
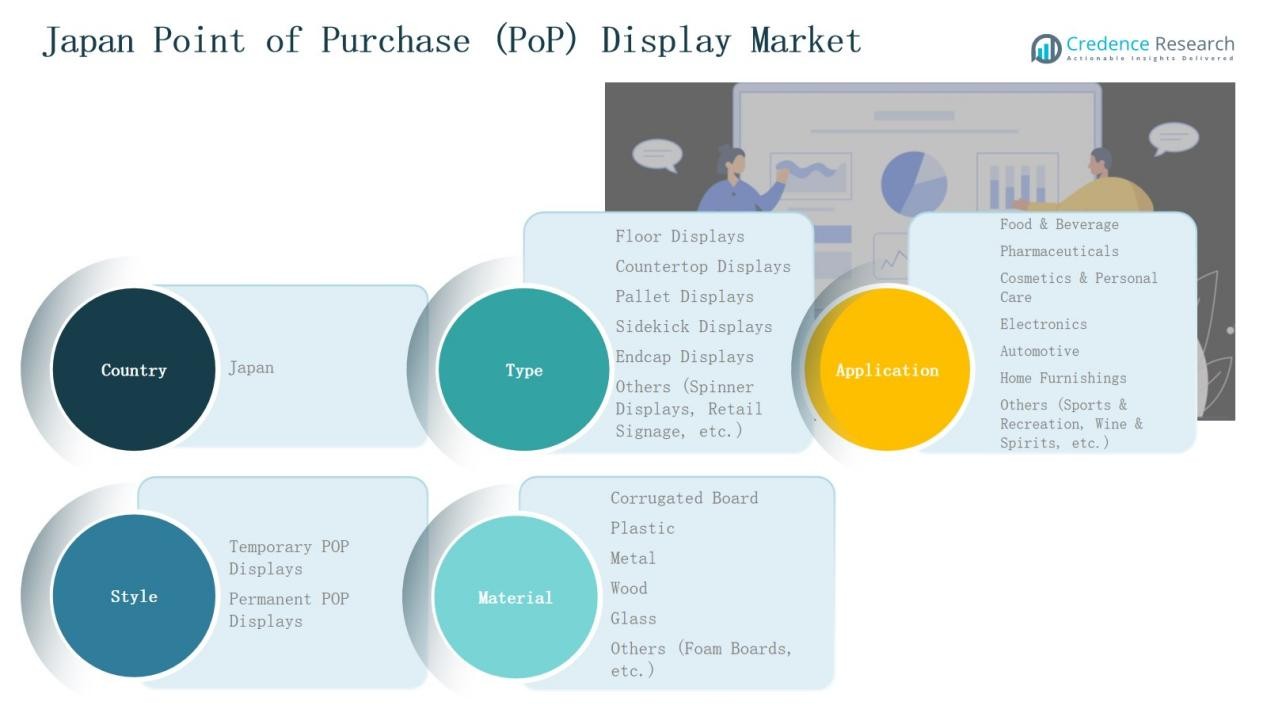
By Type
Floor displays accounted for the largest share at 34% in the Japan PoP display market. Their dominance is driven by high visibility, large surface area for branding, and strong adoption in supermarkets and hypermarkets. Countertop displays followed with 22%, supported by rising use in pharmacies and convenience stores for impulse purchases. Pallet displays represented 16%, mainly used in bulk retail formats. Sidekick displays held 12%, appealing to retailers for compact placement near aisles. Endcap displays captured 10%, leveraged for premium promotions at aisle ends. Other formats, including spinner displays and retail signage, contributed 6%, often applied in specialty and seasonal promotions.
By Application
The food and beverage segment dominated with 38% share of the Japan PoP display market. Demand is supported by strong FMCG sales, new product launches, and heavy promotional activities in supermarkets and convenience stores. Pharmaceuticals accounted for 15%, reflecting the expanding role of pharmacies in consumer healthcare and OTC promotions. Cosmetics and personal care held 20%, boosted by premium beauty brands and trial-driven displays. Electronics captured 10%, where displays enhance visibility of accessories and gadgets. Automotive applications stood at 7%, supported by aftermarket and retail parts promotions. Home furnishings contributed 5%, driven by lifestyle retail chains. Other applications, including sports, recreation, and wine & spirits, held 5%, reflecting niche but growing adoption.
- For instance, Toppan Printing Co., Ltd. launched eco-friendly PoP displays using recyclable materials for beverage promotions in major Japanese supermarkets, aligning with sustainability trends.
By Style
Temporary PoP displays led the market with 62% share in Japan, owing to high turnover of FMCG and seasonal products. Their lower cost, ease of customization, and suitability for promotional campaigns strengthen adoption. Permanent PoP displays captured 38%, primarily used by electronics, cosmetics, and premium retailers aiming for long-term brand positioning. Demand for durable materials and sustainability also supports investment in permanent display structures.
- For instance, Panasonic implemented modular wooden PoP displays in appliance showrooms to underline durability and sustainability as part of its Green Impact initiative.
Key Growth Drivers
Rising FMCG and Convenience Store Expansion
The Japan PoP display market benefits from the rapid expansion of FMCG and convenience stores, which heavily rely on effective in-store promotions. With Japan’s dense retail network, floor and countertop displays drive high consumer engagement and impulse buying. Continuous product launches in food and beverages further boost demand for customized, temporary displays. Retailers increasingly favor displays that maximize space efficiency while enhancing brand visibility. This consistent retail expansion acts as a critical growth engine for PoP display adoption across both urban and semi-urban markets.
- For instance, 7-Eleven Japan reported over 21,000 stores nationwide, leveraging tailored PoP displays to promote seasonal ready meals, significantly boosting impulse buying during peak hours.
Growing Cosmetics and Personal Care Promotions
Cosmetics and personal care brands contribute significantly to the growth of the Japan PoP display market. Japanese consumers place high importance on brand image, packaging, and product trial opportunities. As a result, PoP displays, especially permanent and endcap formats, are widely used to highlight premium and seasonal beauty products. Retailers focus on interactive and visually appealing displays to strengthen customer engagement. The increasing presence of international cosmetic brands in Japan further supports display demand, positioning this segment as one of the most attractive growth drivers.
- For instance, Kao Corporation launched the SENSAI TOTAL FORM EXPERT CREAM internationally with accompanying premium PoP displays emphasizing anti-aging benefits to attract the aging consumer demographic.
Advancements in Display Design and Materials
The market is driven by innovation in display design and the use of sustainable materials. Manufacturers increasingly adopt corrugated board, recycled plastic, and eco-friendly inks to meet rising environmental regulations and consumer expectations. Technological integration, including LED lighting and digital signage, enhances product visibility and brand messaging in crowded retail environments. Retailers value displays that balance durability with sustainability, ensuring long-term use without environmental compromise. These advancements allow brands to differentiate themselves, attract consumer attention, and comply with Japan’s stringent environmental standards, accelerating market penetration.
Key Trends & Opportunities
Shift Toward Sustainable POP Solutions
Sustainability has emerged as a key trend in the Japan PoP display market. Companies prioritize recyclable, biodegradable, and lightweight materials, aligning with the country’s green consumption movement. Brands actively promote their eco-friendly image by using corrugated board and reusable display structures. This trend creates opportunities for suppliers offering innovative, sustainable display solutions that meet both regulatory demands and consumer expectations. With environmental awareness gaining traction, sustainable PoP displays are expected to become standard practice in Japan’s retail sector, providing a strong growth opportunity for manufacturers.
- For instance, Smurfit Kappa Group has invested in biodegradable inks and minimalist designs that reduce material use, enhancing the sustainability of their POP solutions.
Integration of Digital and Smart Displays
Digital transformation in retail is creating opportunities for advanced PoP displays in Japan. Retailers are integrating LED lighting, motion sensors, and digital screens into traditional displays to enhance interactivity and capture shopper attention. Smart displays provide real-time promotions and improve consumer engagement through dynamic visuals. The combination of digital content and physical display structures enables retailers to differentiate products in competitive spaces. As Japanese consumers embrace technology-driven experiences, digital PoP solutions present a strong opportunity for retailers seeking innovative methods to drive sales and strengthen brand presence.
- For instance, in June 2024, Digital Signage Japan 2024 event showcased collaborations including LG Electronics and Crestron Electronics, demonstrating advanced interactive display solutions combined with digital content management for retailers seeking enhanced customer engagement.
Key Challenges
High Cost of Permanent Displays
One of the major challenges in the Japan PoP display market is the high cost associated with permanent displays. Durable materials such as metal, wood, and glass significantly increase production and installation expenses. Small and medium-sized retailers often find it difficult to justify such investments, particularly when focused on short-term promotions. This restricts adoption to larger brands and premium retailers, limiting market expansion. Balancing cost with durability remains a key hurdle for suppliers aiming to expand permanent PoP display penetration across wider retail formats in Japan.
Limited Retail Space in Urban Areas
Japan’s dense urban structure presents a challenge for the deployment of larger PoP displays. Retailers often operate in small, space-constrained stores, particularly in metropolitan areas like Tokyo and Osaka. This restricts the use of bulkier floor and pallet displays, pushing demand toward compact solutions. While smaller displays meet basic needs, they limit promotional impact for large-scale product launches. Manufacturers must focus on designing compact yet impactful display formats to address space limitations, making efficient use of limited retail areas while maintaining consumer engagement.
Rising Competition from E-Commerce
The growing popularity of e-commerce is a significant challenge for the Japan PoP display market. Online platforms increasingly attract consumers with convenience, competitive pricing, and diverse product offerings. This shift reduces foot traffic in physical stores, directly impacting the effectiveness of in-store promotional displays. Retailers must adopt hybrid strategies, integrating online and offline promotions to maintain engagement. The challenge lies in ensuring PoP displays remain relevant in a retail landscape where consumer behavior is rapidly moving toward digital shopping channels.
Regional Analysis
Kanto
Kanto accounted for 42% share of the Japan Point of Purchase (PoP) Display Market, making it the leading region. Tokyo and Yokohama drive this dominance with their dense concentration of retail outlets, department stores, and supermarkets. The region’s strong consumer spending and brand competition ensure high adoption of both temporary and permanent displays. FMCG, cosmetics, and electronics sectors invest heavily in innovative display formats to capture attention in crowded urban retail environments. It is supported by strong infrastructure and advanced retail formats that boost demand for floor and countertop displays. Sustainability trends also push companies to adopt eco-friendly display solutions in Kanto’s competitive retail landscape.
Kansai
Kansai held 25% share of the Japan Point of Purchase (PoP) Display Market. Osaka, Kyoto, and Kobe play a central role in driving regional demand with their mix of traditional retail and modern shopping complexes. Strong consumer culture and frequent product launches fuel growth in cosmetics, pharmaceuticals, and food sectors. It benefits from high tourist inflows, which boost sales of promotional and seasonal goods supported by eye-catching PoP displays. Retailers prioritize compact solutions, such as countertop and sidekick displays, to maximize limited store space. Kansai also reflects growing interest in digital and interactive displays, particularly in electronics and lifestyle retail.
Chubu
Chubu contributed 18% share of the Japan Point of Purchase (PoP) Display Market. Nagoya and surrounding industrial hubs provide strong demand from automotive and electronics sectors, where permanent displays are gaining traction. Food and beverage manufacturers in this region use pallet and endcap displays to highlight products in wholesale and retail formats. It benefits from the presence of logistics and distribution hubs that support widespread retail penetration. Seasonal and event-driven promotions also support temporary displays across large retail stores. Increasing emphasis on sustainability further pushes demand for recyclable corrugated board and plastic-based displays in Chubu.
Other Regions
Other regions together accounted for 15% share of the Japan Point of Purchase (PoP) Display Market. Hokkaido, Tohoku, Chugoku, Shikoku, and Kyushu contribute steadily, with demand concentrated in regional supermarkets and local specialty stores. These markets rely strongly on temporary displays due to lower investment costs and faster turnover of consumer goods. It is driven by rising interest in cosmetics, food, and alcoholic beverages, particularly wine and spirits. Growth remains supported by regional tourism and expanding retail chains. Permanent displays are less common, but their adoption is gradually increasing in electronics and lifestyle sectors. Manufacturers focus on providing cost-effective and customizable solutions to match regional preferences.
Market Segmentations:
By Type
- Floor Displays
- Countertop Displays
- Pallet Displays
- Sidekick Displays
- Endcap Displays
- Others (Spinner Displays, Retail Signage, etc.)
By Application
- Food & Beverage
- Pharmaceuticals
- Cosmetics & Personal Care
- Electronics
- Automotive
- Home Furnishings
- Others (Sports & Recreation, Wine & Spirits, etc.)
By Style
- Temporary POP Displays
- Permanent POP Displays
By Material
- Corrugated Board
- Plastic
- Metal
- Wood
- Glass
- Others (Foam Boards, etc.)
By Region
- Kanto
- Kansai
- Chubu
- Others
Competitive Landscape
The competitive landscape of the Japan Point of Purchase (PoP) Display Market is shaped by a mix of large printing companies, material suppliers, and specialized display manufacturers. Leading players such as Toppan Printing Co., Ltd. and Dai Nippon Printing Co., Ltd. command significant market share with extensive product portfolios, advanced printing technologies, and nationwide retail partnerships. Companies like Seiko Epson Corporation and Japan Display Inc. contribute through digital and innovative display solutions, supporting the integration of smart and interactive formats. Nippon Paper Industries Co., Ltd. and Mitsubishi Paper Mills Limited strengthen the market with sustainable material innovations, reflecting Japan’s growing demand for eco-friendly solutions. Regional firms, including OSAKA Sealing Printing and Kuresha Display Co., Ltd., focus on customized, cost-effective displays to serve local retailers and niche markets. Intense competition drives continuous investment in design, sustainability, and digital integration, while partnerships with FMCG, cosmetics, and electronics brands reinforce long-term market positioning.
Shape Your Report to Specific Countries or Regions & Enjoy 30% Off!
Key Players
- Toppan Printing Co., Ltd.
- Dai Nippon Printing Co., Ltd. (DNP)
- Mitsubishi Paper Mills Limited
- Seiko Epson Corporation
- Nippon Paper Industries Co., Ltd.
- Sumitomo Chemical Co., Ltd.
- Japan Display Inc.
- OSAKA Sealing Printing (OSP)
- Takeda Printing Co., Ltd.
- Kuresha Display Co., Ltd.
Recent Developments
- In December 2024, Japan Display Inc. partnered with Obsidian Sensors Inc. to develop high-resolution glass-based microbolometers, enhancing advanced display applications in the Japan Point of Purchase (PoP) Display Market.
- In August 2024, Toppan Printing Co., Ltd. and Dai Nippon Printing Co., Ltd. (DNP) were highlighted as key innovators, focusing on sustainable materials and interactive digital PoP displays for retail, reflecting ongoing product development efforts.
- In February 2025, Japan Display Inc. made a strategic investment in OLEDWorks, acquiring a 6.69% stake in the company.
Report Coverage
The research report offers an in-depth analysis based on Type, Application, Style, Material and Region. It details leading market players, providing an overview of their business, product offerings, investments, revenue streams, and key applications. Additionally, the report includes insights into the competitive environment, SWOT analysis, current market trends, as well as the primary drivers and constraints. Furthermore, it discusses various factors that have driven market expansion in recent years. The report also explores market dynamics, regulatory scenarios, and technological advancements that are shaping the industry. It assesses the impact of external factors and global economic changes on market growth. Lastly, it provides strategic recommendations for new entrants and established companies to navigate the complexities of the market.
Future Outlook
- Retailers will increasingly adopt eco-friendly display materials to meet sustainability goals.
- Temporary displays will continue to dominate due to frequent product launches and seasonal campaigns.
- Permanent displays will gain traction in cosmetics and electronics for long-term brand positioning.
- Digital and interactive displays will expand, enhancing consumer engagement in competitive retail spaces.
- Food and beverage displays will remain the leading application supported by strong FMCG growth.
- Cosmetics and personal care displays will see higher demand with rising premium product launches.
- Compact display formats will gain importance due to limited retail space in urban centers.
- Regional expansion of convenience stores will fuel demand for countertop and sidekick displays.
- Local manufacturers will focus on customized and cost-effective solutions to compete with major players.
- Partnerships between display producers and retailers will strengthen integrated promotional strategies.


