
Market Overview
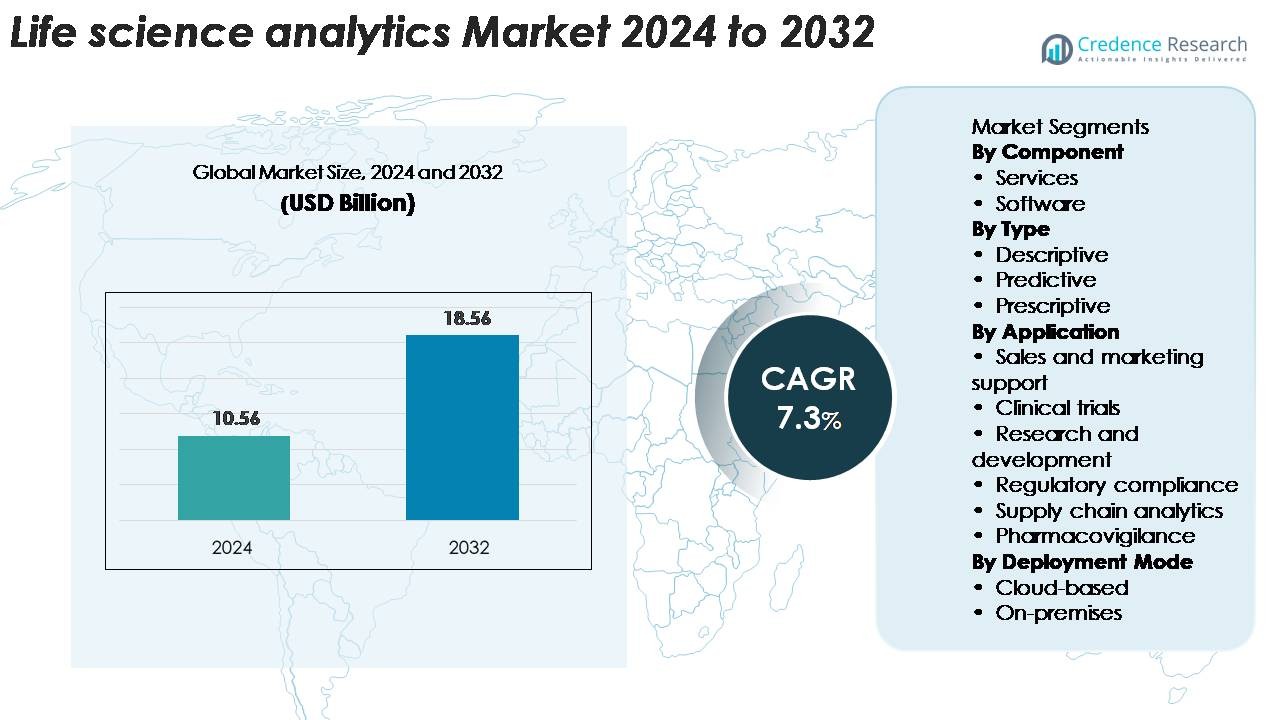
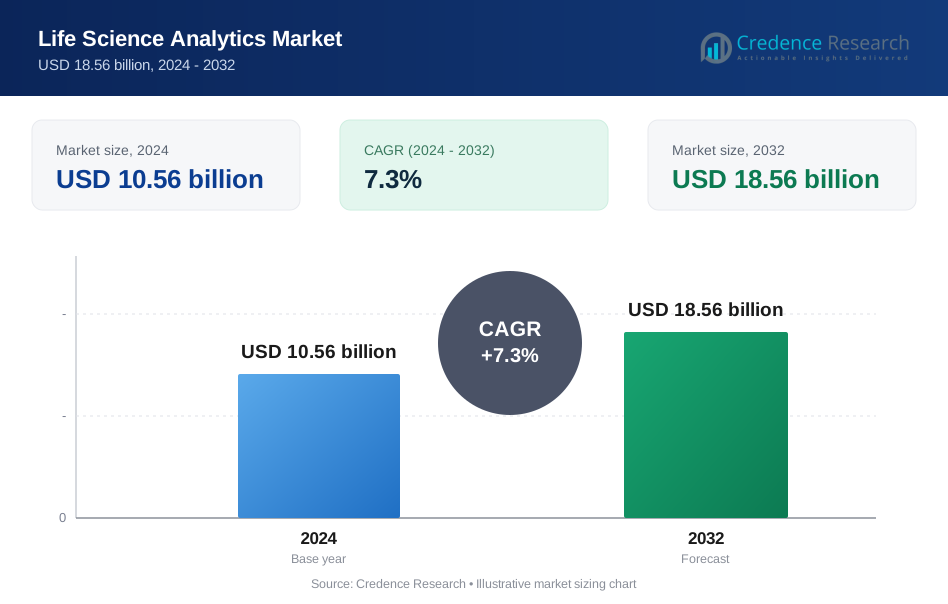
Life science analytics market size was valued at USD 10.56 billion in 2024 and is projected to reach USD 18.56 billion by 2032, growing at a CAGR of 7.3% during the forecast period.
| REPORT ATTRIBUTE | DETAILS |
|---|---|
| Historical Period | 2020-2023 |
| Base Year | 2024 |
| Forecast Period | 2025-2032 |
| Life science analytics Market Size 2024 | USD 10.56 Billion |
| Life science analytics Market, CAGR | 7.3% |
| Life science analytics Market Size 2032 | USD 18.56 Billion |
The Life Science Analytics Market features leading players such as Accenture, SAS Institute, Oracle, IBM, IQVIA, Cognizant, and Microsoft, each advancing analytical capabilities across clinical research, real-world evidence generation, and commercial intelligence. These companies invest in AI-enabled platforms, cloud-based analytics, and integrated data solutions that support faster drug development and stronger regulatory compliance. North America remains the dominant region with a 42.8% market share, supported by strong R&D spending and advanced digital health infrastructure. Europe follows with significant adoption across pharmaceutical hubs, while Asia Pacific grows rapidly as clinical trial activity and digital transformation accelerate across emerging economies.
Market Insights
- The Life Science Analytics Market was valued at USD 10.56 billion in 2024 and is expected to reach USD 18.56 billion by 2032, registering a 7.3% CAGR.
- Rising demand for data-driven insights in clinical trials, real-world evidence studies, and regulatory reporting drives strong adoption, supported by wider use of cloud and AI-enabled analytical platforms.
- Descriptive analytics leads with a 46% share, supported by high demand for historical and real-time visibility across research, compliance, and commercial operations.
- Competition intensifies as major players expand AI, machine learning, and cloud-native tools, while challenges arise from data privacy rules, interoperability gaps, and the shortage of skilled data professionals.
- North America dominates with a 42.8% share, followed by Europe with ~25%, while Asia Pacific grows fastest at ~17%, driven by expanding clinical trials and digital health investments across China, India, and Japan.
Market Segmentation Analysis:
By Component
Services lead the Life Science Analytics Market with a 58% share due to rising demand for advanced analytical support across clinical research, real-world evidence studies, and regulatory reporting. Companies rely on service providers for data integration, workflow automation, and predictive insights to speed decision-making. The service segment benefits from growing outsourcing trends, skill shortages in data science, and the need for continuous compliance updates. Software adoption also grows as life science firms deploy AI-driven platforms, but services remain dominant because organizations seek flexible, scalable expertise to manage complex datasets and specialized analytics tasks.
- For instance, IQVIA, a leading service provider, offers cloud-based analytics platforms, supporting pharmaceutical companies with real-time insights for drug development. Companies utilize these services for data integration, workflow automation, and predictive insights to streamline processes and accelerate decision-making, which helps speed up specific phases of drug development and bring treatments to market more efficiently.
By Type
Descriptive analytics dominates the market with a 46% share as life science organizations use historical and real-time data to improve operational visibility and clinical performance. This segment gains traction because firms need clear insights into trial outcomes, patient behavior, and treatment patterns. Predictive analytics expands as AI and machine learning support forecasting of patient responses and trial risks. Prescriptive analytics also rises with demand for automated recommendations, yet descriptive tools remain the largest due to their wide applicability, ease of integration, and essential role in supporting early-stage analytical maturity across healthcare and pharmaceutical operations.
- For instance, IQVIA’s Analytics Research Accelerator provides access to over 3,700 curated global health-data assets and supports cohort development across more than 250 variables, enabling faster descriptive “what-happened” insights.
By Application
Clinical trials hold the largest share at 32% in the Life Science Analytics Market, driven by the need to optimize trial design, improve patient recruitment, and enhance safety monitoring. Advanced analytics support protocol development, resolve delays, and reduce attrition through real-time insights. Research and development gains momentum as companies use data models to accelerate discovery and reduce failure rates. Sales and marketing support grows with rising demand for omnichannel insights, while pharmacovigilance expands due to strict safety monitoring norms. Regulatory compliance and supply chain analytics continue to advance with stricter global standards and digital transformation initiatives.
Key Growth Driver
Rising Need for Data-Driven Decision Making
Life science firms now depend on analytics to guide core decisions. Companies use structured and unstructured data to improve trial outcomes. Teams apply analytics to refine protocol design and reduce execution risks. This shift boosts adoption across clinical research units. Organizations also deploy analytics to support real-world evidence generation. These insights improve drug positioning and therapy evaluation. Regulators now demand stronger evidence frameworks. Firms respond by increasing data investments. Advanced tools help integrate diverse datasets quickly. This supports faster regulatory submissions and safer product launches. The need for reliable evidence strengthens long-term analytics demand.
- For instance, Flatiron Health’s Oncology Database includes detailed longitudinal data from over 3 million cancer patients across 280+ US cancer clinics, enabling deep evidence generation for drug positioning and therapy evaluation.
Digital Transformation Across Healthcare and Pharma
Healthcare and pharma groups continue shifting toward digital systems. Cloud platforms replace legacy systems across major workflows. This change increases analytics accessibility. More teams can analyze data without infrastructure barriers. Digital tools improve collaboration between clinical, commercial, and regulatory units. Real-time dashboards support better operational visibility. Automation reduces manual errors during reporting. AI models process large datasets faster. These capabilities accelerate discovery phases and safety assessments. Digital transformation expands analytics use cases. Firms achieve stronger productivity and lower operational delays. The ongoing modernization push fuels sustained analytics growth.
- For instance, BioNTech moved its mass-spectrometry search infrastructure onto the cloud and achieved data-processing speed-ups of 50-75%, with parallel workflows running up to 500-fold greater capacity than before.
Growing Emphasis on Personalized and Precision Medicine
Precision medicine relies heavily on analytics to interpret large patient datasets. Genomic platforms generate millions of data points. Analytics tools help decode genetic patterns. These insights improve targeted treatment development. Clinical teams use models to predict patient response groups. This reduces trial failures and speeds approvals. Payers also support precision medicine due to better patient outcomes. Providers use analytics to personalize therapy plans. Real-world patient monitoring strengthens treatment accuracy. Demand rises for tools that manage biomarker-based datasets. The shift toward personalized medicine strengthens analytics’ strategic value.
Key Trend & Opportunity
Expanding Use of AI and Machine Learning
AI and machine learning reshape analytics workflows. These tools handle massive datasets faster than manual systems. Teams use ML models to detect hidden patterns. Predictive engines reduce trial risks. AI tools also improve drug repurposing workflows. Companies explore generative AI for data harmonization. Automated insights support faster regulatory submissions. AI-driven platforms enhance pharmacovigilance reporting. These tools detect safety signals earlier. The rise of automated intelligence creates new efficiency gains. Broad industry interest in AI ensures long-term opportunity growth.
- For instance, IQVIA’s AI-powered modelling increased precision of patient identification by 15 × and HCP-linkage precision by 10 ×, achieving a treatment transition rate of 28% within three months.
Integration of Real-World Data and Real-World Evidence
Real-world data now influences major clinical and commercial decisions. Payers request stronger RWE packages during evaluation. Providers rely on RWE to study treatment outcomes. Firms use real-world datasets to refine label expansions. RWE supports faster market access for new therapies. Advanced platforms process claims, EHR, and patient-reported data. These tools improve post-market surveillance. Companies also use RWE to assess unmet needs. This expands opportunity in chronic disease areas. The growing acceptance of RWE drives analytics investments.
- For instance, Flatiron Health’s oncology RWD network captures longitudinal data from more than 3 million active cancer patients across 280+ U.S. cancer clinics, enabling high-resolution RWE studies for treatment outcomes and therapy performance.
Growth of Cloud-Enabled and Interoperable Platforms
Cloud systems improve scalability for analytics workloads. Life science firms prefer flexible cloud deployment. Cloud tools support collaboration across global teams. Interoperable systems connect clinical, commercial, and supply chain data. This integration reduces data silos. Faster access improves decision accuracy. Cloud adoption supports cost-efficient analytics expansion. Firms avoid hardware investments. Regulatory-compliant cloud tools gain traction. This trend creates new integration and modernization opportunities.
Key Challenge
Data Privacy and Regulatory Compliance Complexity
Life science analytics must align with strict regulations. Firms manage sensitive trial and patient data daily. Privacy laws increase compliance pressure. Global markets follow different data rules. Teams struggle with secure data transfer. Legacy systems complicate compliance audits. Incorrect handling risks legal penalties. Firms must invest in advanced security. Encryption, access controls, and audit trails become essential. Regulatory volatility increases operational strain. Compliance challenges slow analytics deployment speed.
Lack of Skilled Data Professionals in Life Sciences
Analytics adoption grows faster than talent supply. Firms struggle to hire trained specialists. Data scientists with domain expertise remain rare. Teams face skill gaps in AI and ML. This slows digital transformation progress. Training programs require high investment. Upskilling demands significant time. Talent shortages reduce analytics accuracy. Operational workflows become fragmented. Firms must adopt automation to bridge gaps. The talent challenge remains a major barrier.
Regional Analysis
North America:
The North American region accounted for approximately 42.8% of the global market in 2024. A combination of strong R&D investment, advanced healthcare IT infrastructure, and a large presence of major life science firms drives this dominance. Regulatory frameworks in the U.S. and Canada also support analytical solution adoption in clinical trials and drug development. The region benefits from early technology uptake and large-scale data generation, creating sustained demand for analytics tools and services.
Europe:
Europe held an estimated ~25% market share in 2024, positioning it as the second-largest region. The presence of mature pharmaceutical industries, well-developed healthcare systems, and stringent data regulatory standards encourage analytics adoption. Governments across key countries invest in digital health transformation and precision medicine platforms, fostering analytics expansion. However, fragmented regulatory practices and variations in healthcare infrastructure across countries somewhat moderate growth compared to North America.
Asia Pacific:
The Asia Pacific region accounted for about 17% of the market in 2024 and is projected to deliver the fastest growth over the forecast period. Emerging markets such as China, India and Japan expand healthcare infrastructure rapidly and attract clinical trial activity. Multinational life science firms deepen investment in analytics across the region. Government policies promoting digital health, combined with growing research capabilities, enhance regional potential. Infrastructure gaps and regulatory complexity remain as challenges but the growth outlook remains strong.
Latin America & Middle East & Africa (LAMEA):
Together, Latin America and the Middle East & Africa region represented roughly 6.5% of the global market in 2024. Investment in healthcare digitalization and analytics is rising in countries like Brazil, Mexico, UAE and South Africa. This region offers significant untapped opportunity as pharmaceutical activity increases and digital health adoption rises. However, growth is constrained by limited infrastructure, regulatory heterogeneity and slower technology uptake compared to mature markets.
Market Segmentations:
By Component
- Services
- Software
By Type
- Descriptive
- Predictive
- Prescriptive
By Application
- Sales and marketing support
- Clinical trials
- Research and development
- Regulatory compliance
- Supply chain analytics
- Pharmacovigilance
By Deployment Mode
- Cloud-based
- On-premises
By Geography
- North America
- U.S.
- Canada
- Mexico
- Europe
- Germany
- France
- U.K.
- Italy
- Spain
- Rest of Europe
- Asia Pacific
- China
- Japan
- India
- South Korea
- South-east Asia
- Rest of Asia Pacific
- Latin America
- Brazil
- Argentina
- Rest of Latin America
- Middle East & Africa
- GCC Countries
- South Africa
- Rest of the Middle East and Africa
Competitive Landscape
The competitive landscape of the Life Science Analytics Market features global technology leaders, established pharmaceutical service firms, and specialized analytics providers competing to expand advanced data capabilities across the life science value chain. Companies focus on strengthening portfolios with AI-driven platforms, cloud-based analytics, and real-world evidence solutions that support faster clinical development and compliance. Vendors invest in strategic partnerships with biopharma firms to integrate predictive modeling, automation, and interoperable data systems. The market also shows rising activity in mergers and acquisitions as firms seek greater scale and broader analytics depth. Competition intensifies as players enhance capabilities in clinical trial optimization, pharmacovigilance intelligence, and precision medicine analytics. Continuous innovation, regulatory expertise, and high-quality data integration remain the key differentiators shaping market leadership.
Key Player Analysis
- IQVIA Inc.
- Microsoft
- MaxisIT
- Oracle Corporation
- SAS Institute, Inc.
- Cognizant
- Optum, Inc.
- IBM Corporation
- Accenture
- Analytics8
Recent Developments
- In 2025, Microsoft Corporation at its Build 2025 event revealed major developments in AI agents, data stack integrations and enterprise-grade analytics capabilities relevant to life sciences workflows.
- In May 2025, MaxisIT (now branded as Maxis AI) introduced its enterprise-ready Agentic AI Platform, marking a significant push into life-science analytics and clinical trial-oriented AI solutions.
- In 2024, Oracle Corporation launched its “Oracle Analytics Intelligence for Life Sciences” platform, offering an AI-powered cloud analytics solution for life sciences insights.
Report Coverage
The research report offers an in-depth analysis based on Component, Type, Application, Deployment and Geography. It details leading market players, providing an overview of their business, product offerings, investments, revenue streams, and key applications. Additionally, the report includes insights into the competitive environment, SWOT analysis, current market trends, as well as the primary drivers and constraints. Furthermore, it discusses various factors that have driven market expansion in recent years. The report also explores market dynamics, regulatory scenarios, and technological advancements that are shaping the industry. It assesses the impact of external factors and global economic changes on market growth. Lastly, it provides strategic recommendations for new entrants and established companies to navigate the complexities of the market.
Future Outlook
- The market will expand as life science firms increase adoption of AI-driven analytics.
- Clinical trial optimization will rely more on predictive models to reduce delays and risks.
- Real-world evidence will become a core requirement for regulatory submissions and market access.
- Cloud-based analytics platforms will gain stronger traction across global research teams.
- Precision medicine programs will grow due to rising demand for genomic and biomarker analytics.
- Automation will transform pharmacovigilance through faster signal detection and case processing.
- Integrated data platforms will strengthen collaboration between clinical, commercial, and regulatory units.
- Demand for advanced analytics talent will rise, pushing firms to adopt more automated tools.
- Interoperability solutions will evolve to connect EHR, trial, claims, and laboratory datasets.
- Asia Pacific will emerge as a major growth hub as digital health and clinical research activity accelerate.
Request a Free Sample
Fill in your details and we'll send you a free sample report.
- Sample data tables & charts
- Research methodology
Need a Custom Version of This Report?
Tailor the scope, geography, or segments to your exact requirements.
- Custom geography or segment scope
- Direct access to our analyst team
Frequently Asked Questions
What is the current market size for Life Science Analytics Market, and what is its projected size in 2032?
At what Compound Annual Growth Rate is the Life Science Analytics Market projected to grow between 2025 and 2032?
Which Life Science Analytics Market segment held the largest share in 2024?
What are the primary factors fueling the growth of the Life Science Analytics Market?
Who are the leading companies in the Life Science Analytics Market?
Which region commanded the largest share of the Life Science Analytics Market in 2024?
Table of Content
Chapter 1. Report Introduction
- 1.1 Report Description & Purpose
- 1.1.1 Report Title & Market Definition
- 1.1.2 Unique Selling Propositions (USP) & Key Differentiators
- 1.1.3 Value Proposition for Stakeholders
- 1.2 Research Objectives
- 1.2.1 Market Sizing Objectives (Volume & Revenue)
- 1.2.2 Segmentation Objectives
- 1.2.3 Competitive Intelligence Objectives
- 1.2.4 Forecast & Scenario Objectives
- 1.3 Report Scope
- 1.3.1 Life Science Analytics Scope – Types & Subtypes Covered
- 1.3.2 Geographic Scope – Regions & Countries Covered
- 1.3.3 Historical Period, Base Year & Forecast Period (2024; forecast to 2032)
- 1.3.4 Inclusions & Exclusions
- 1.4 HS Code & Classification Framework
- 1.5 Currency, Units & Pricing Basis
- 1.6 Target Stakeholders
- 1.7 Limitations & Assumptions
Chapter 2. Executive Summary
- 2.1 Global Life Science Analytics Market Snapshot
- 2.1.1 Market Size – Historical (2024) & Forecast (2024-2032) (2024: USD 10.56 billion → 2032: USD 18.56 billion)
- 2.1.2 Volume & Revenue – Global Totals
- 2.1.3 Key Market Highlights – Top Five Facts
- 2.2 Life Science Analytics Market Segmentation Snapshot
- 2.2.1 Market Split by Region – 2024 vs. 2032
- 2.3 Competitive Snapshot
- 2.3.1 Top 10 Players by Revenue Share – 2024
- 2.3.2 Top 10 Players by Volume Share – 2024
- 2.3.3 Recent Strategic Developments (18-Month Summary)
- 2.4 Key Investment Highlights & Strategic Conclusions
Chapter 3. Life Science Analytics Market Dynamics & Industry Analysis
- 3.1 Market Overview & Context
- 3.1.1 Life Science Analytics Market Position in the Broader Automotive Value Chain
- 3.1.2 OEM vs. Replacement Market Dynamics
- 3.1.3 Market Maturity & Development Stage by Region
- 3.2 Life Science Analytics Market Drivers
- 3.3 Life Science Analytics Market Restraints & Challenges
- 3.4 Life Science Analytics Market Opportunities
- 3.5 Porter's Five Forces Analysis
- 3.5.1 Threat of New Entrants
- 3.5.2 Bargaining Power of Suppliers
- 3.5.3 Bargaining Power of Buyers
- 3.5.4 Threat of Substitutes
- 3.5.5 Competitive Rivalry – Intensity Assessment
- 3.6 Life Science Analytics Value Chain Analysis
- 3.6.1 Upstream – Raw Material/Input Suppliers
- 3.6.1.1 Raw Material/Input 1
- 3.6.1.2 Raw Material/Input 2
- 3.6.1.3 Raw Material/Input 3
- 3.6.2 Midstream – Production/Manufacturing/Service Delivery
- 3.6.2.1 Production/Process Overview
- 3.6.2.2 Key Facility Locations & Capacity by Manufacturer
- 3.6.3 Downstream – Distribution & End Consumer
- 3.6.3.1 Primary Channel – B2B/OEM
- 3.6.3.2 Secondary Channels – Dealer, Retail, Online, Direct
- 3.6.4 Value Chain Profitability Analysis
- 3.6.1 Upstream – Raw Material/Input Suppliers
- 3.7 PESTEL Analysis
- 3.7.1 Political Factors
- 3.7.2 Economic Factors
- 3.7.3 Social Factors
- 3.7.4 Technological Factors
- 3.7.5 Environmental Factors
- 3.7.6 Legal Factors
- 3.8 Life Science Analytics Supply Chain Analysis
- 3.8.1 Raw Material/Input Supply Risk Assessment
- 3.8.2 Manufacturing Concentration Risk (Geographic Exposure)
- 3.8.3 Trade Disruption Impact Analysis
- 3.9 Regulatory & Policy Landscape
Note: The regulatory and policy landscape section covers regulations based on their applicability to the market, Life Science Analytics category, geography, and scope of the study. Only regulatory frameworks with a material impact on operations, compliance, trade, sustainability, or market access are analyzed in detail.
Chapter 4. Key Investment Pockets & Opportunity Analysis
- 4.1 Life Science Analytics Market Attractiveness Analysis
- 4.1.1 By Region – Investment Attractiveness Matrix (Volume × CAGR)
- 4.2 Absolute Revenue Growth Opportunity
- 4.2.1 By Region – Absolute USD Growth Through 2032
- 4.3 Incremental Volume Opportunity
- 4.3.1 By Region – Incremental Volume Through 2032
- 4.3.2 Segment – Incremental Volume
- 4.4 Emerging Submarket Opportunity Deep Dive (Subject to Applicability)
- 4.5 Emerging Market Opportunity Scorecards
- 4.5.1 United States
- 4.5.2 Europe
- 4.5.3 Asia
- 4.5.4 Middle East & Africa
Note: Emerging Market Opportunity Scorecards will be included based on relevance and strategic importance. Regions listed are indicative and may vary depending on data availability and market dynamics.
Chapter 5. Life Science Analytics Import-Export Analysis & Trade Flows
- 5.1 Global Trade Overview
- 5.1.1 Global Export Value by Country (2024)
- 5.1.2 Global Export Volume by Country (2024)
- 5.1.3 Global Import Value by Country (2024)
- 5.1.4 Global Import Volume by Country (2024)
- 5.1.5 Net Trade Balance by Country (2024)
- 5.2 Export Analysis – Segment
- 5.2.1 Type 1 (HS Code)
- 5.2.2 Type 2 (HS Code)
- 5.2.3 Type 3 (HS Code)
- 5.2.4 Type 4 (HS Code)
- 5.2.5 Type 5 (HS Code)
- 5.3 Import Analysis – Segment
- 5.3.1 Type 1 (HS Code)
- 5.3.2 Type 2 (HS Code)
- 5.3.3 Type 3 (HS Code)
- 5.3.4 Type 4 (HS Code)
- 5.3.5 Type 5 (HS Code)
- 5.4 Average Unit Trade Prices
- 5.4.1 Average Export Price – Segment & Country
- 5.4.2 Average Import Price – Segment & Source Country
- 5.4.3 Price Trends (2024)
- 5.5 Key Trade Route Analysis
- 5.5.1 Trade Route 1
- 5.5.2 Trade Route 2
- 5.5.3 Trade Route 3
- 5.5.4 Trade Route 4
- 5.5.5 Trade Route 5
- 5.6 Trade Policy Impact Assessment
- 5.6.1 US Anti-Dumping & Section 301 Tariffs
- 5.6.2 EU Customs Union Impact
- 5.6.3 Major Free Trade Agreements
- 5.6.4 USMCA Rules of Origin
Note: Trade policy analysis will be included only where relevant to the Life Science Analytics market.
Chapter 6. Competitive Landscape & Company Benchmarking
- 6.1 Life Science Analytics Market Concentration & Structure
- 6.1.1 Herfindahl-Hirschman Index (HHI) – vs. 2024
- 6.1.2 Tier 1, Tier 2 & Tier 3 Market Structure
- 6.1.3 Global, Regional & Local Player Dynamics
- 6.2 Life Science Analytics Market Share Analysis – 2024
- 6.2.1 Global Revenue Share by Company
- 6.2.2 Global Volume Share by Company
- 6.2.3 Regional Revenue Share
- 6.2.4 Market Share Evolution ( vs. 2024)
- 6.2.5 OEM Segment Share by Company
- 6.2.6 Replacement Segment Share by Company
- 6.3 Production/Delivery Capacity & Facility Analysis
- 6.3.1 Global Installed Capacity
- 6.3.2 Capacity Utilization Rates
- 6.3.3 Production/Output Volume
- 6.3.4 Facility Locations & Capacity Map
- 6.3.5 Planned Capacity Additions
- 6.4 Life Science Analytics Competitive Benchmarking Matrix
- 6.4.1 Revenue, Volume, CAGR & Profitability Comparison
- 6.4.2 Channel Revenue Mix
- 6.4.3 Geographic Revenue Exposure
- 6.4.4 R&D Intensity
- 6.4.5 Sustainability Maturity
- 6.5 Strategic Developments in Life Science Analytics (Last 24 Months)
- 6.5.1 Mergers, Acquisitions & Divestments
- 6.5.2 New Life Science Analytics Launches
- 6.5.3 Facility Expansions
- 6.5.4 Strategic Alliances, Joint Ventures & Partnerships
- 6.5.5 Distribution Expansion & Market Entry
- 6.5.6 Sustainability & ESG Initiatives
- 6.6 Competitive Strategy Mapping
- 6.6.1 Leader, Challenger, Follower & Niche Classification
- 6.6.2 Pricing Strategy Comparison
- 6.6.3 Channel Strategy Matrix
Note: Strategic developments are included based on their materiality and the availability of reliable information.
Chapter 7. Global Life Science Analytics Market – By Distribution Channel
- 7.1 Segment Overview
- 7.1.1 Volume & Revenue Split by Channel (2024 & 2032)
- 7.1.2 Channel Mix Evolution (2024-2032)
Chapter 8. Regional Market Analysis – Global Overview
- 8.1 Global Regional Overview
- 8.1.1 Regional Volume Share
- 8.1.2 Regional Revenue Share
- 8.1.3 Regional Volume by Region
- 8.1.4 Regional Revenue by Region
- 8.1.5 Regional Forecast Through 2032
- 8.2 Cross-Regional Segment Analysis
- 8.2.1 By Distribution Channel
- 8.2.2 By Brand/Price Tier
Chapter 9. North America Life Science Analytics Market
- 9.1 United States
- 9.2 Canada
- 9.3 Mexico
Chapter 10. Europe Life Science Analytics Market
- 10.1 Germany
- 10.2 France
- 10.3 Italy
- 10.4 United Kingdom
- 10.5 Spain
- 10.6 Poland
- 10.7 Russia
- 10.8 Netherlands
- 10.9 Belgium
- 10.10 Sweden
- 10.11 Denmark
- 10.12 Norway
- 10.13 Rest of Europe
Chapter 11. Asia Pacific Life Science Analytics Market
- 11.1 China
- 11.2 India
- 11.3 Japan
- 11.4 South Korea
- 11.5 Thailand
- 11.6 Indonesia
- 11.7 Vietnam
- 11.8 Malaysia
- 11.9 Australia
- 11.10 Rest of Asia Pacific
Chapter 12. Latin America Life Science Analytics Market
- 12.1 Brazil
- 12.2 Argentina
- 12.3 Colombia
- 12.4 Chile
- 12.5 Rest of Latin America
Chapter 13. Middle East Life Science Analytics Market
- 13.1 Saudi Arabia
- 13.2 United Arab Emirates
- 13.3 Turkey
- 13.4 Israel
- 13.5 Iran
- 13.6 Rest of the Middle East
Chapter 14. Africa Life Science Analytics Market
- 14.1 South Africa
- 14.2 Egypt
- 14.3 Nigeria
- 14.4 Morocco
- 14.5 Rest of Africa
Chapter 15. Life Science Analytics Company Profiles
- 15.1 [Company 01]
- 15.1.1 Company Overview
- 15.1.2 Key Management Personnel
- 15.1.3 Products & Services Portfolio
- 15.1.4 Financial Performance
- 15.1.5 Key Market Focus & Geographic Presence
- 15.1.6 Recent Developments & Strategic Initiatives
Note: The company profile list is preliminary and may change based on research findings, market developments, data availability, and client requirements.
Chapter 16. Appendices
- Appendix A – List of Abbreviations & Acronyms
- Appendix B – Industry Classification Code Reference – Full Series
- Appendix C – Production & Capacity Data Tables
- Appendix D – End-Use & Demand Base Tables
- Appendix E – Consumption & Replacement Rate Assumptions
- Appendix F – ASP Reference Tables
- Appendix G – Manufacturing & Facility Database
- Appendix H – Import-Export Data Tables
- Appendix I – Regulatory Summary Tables
- Appendix J – Primary Research Participant List (Anonymized)
- Appendix K – Primary Research Questionnaire Framework
- Appendix L – Data Sources & Bibliography
- Appendix M – Market Size Divergence & Source Comparison
Chapter 17. Research Methodology
- 17.1 Research Framework & Philosophy
- 17.2 Secondary Research – Sources, Hierarchy & Data Extraction
- 17.3 Data Modeling – Bottom-Up & Top-Down Market Sizing
- 17.4 Primary Research – Stakeholder Framework, LOI & Sample Sizes
- 17.5 Forecast Methodology – Regression, Scenario & Sensitivity Analysis
- 17.6 Quality Control – Four-Layer Validation Framework
- 17.7 Limitations & Standard Assumptions
- 17.8 Disclaimer
