
Market Overview
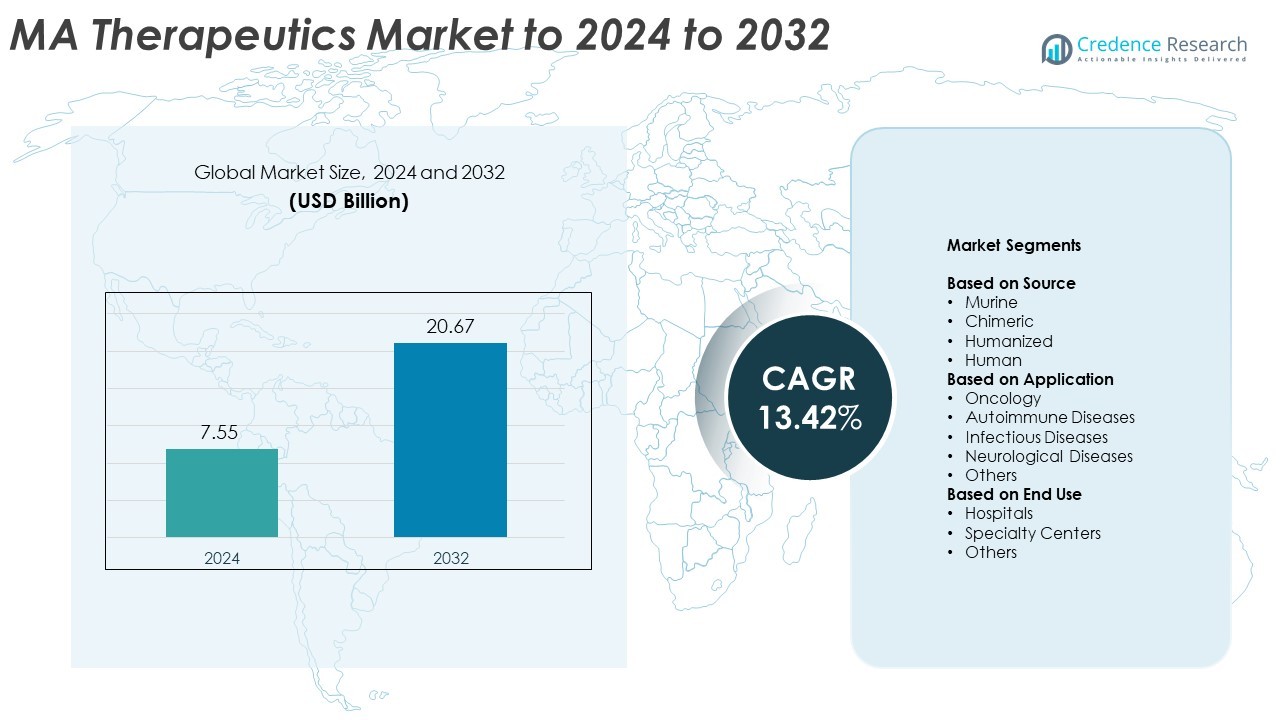
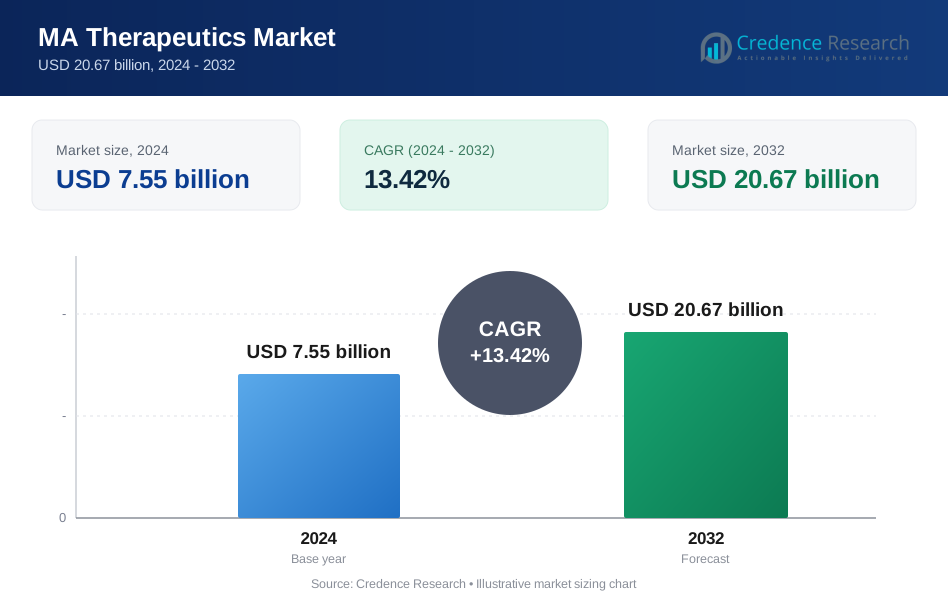
MA Therapeutics market size was valued at USD 7.55 billion in 2024 and is anticipated to reach USD 20.67 billion by 2032, at a CAGR of 13.42% during the forecast period.
| REPORT ATTRIBUTE | DETAILS |
|---|---|
| Historical Period | 2020-2023 |
| Base Year | 2024 |
| Forecast Period | 2025-2032 |
| MA Therapeutics market Size 2024 | USD 7.55 Billion |
| MA Therapeutics market , CAGR | 13.42% |
| MA Therapeutics market Size 2032 | USD 20.67 Billion |
The MA Therapeutics market is characterized by strong competition among major biopharmaceutical companies such as Bluebird Bio, Sanofi S.A., Eli Lilly and Company, AstraZeneca plc, Biogen Inc., Amgen Inc., and F. Hoffmann-La Roche Ltd. These players focus on expanding their antibody portfolios through strategic collaborations, clinical advancements, and investments in next-generation biologics. Innovation in bispecific and antibody-drug conjugate platforms continues to enhance therapeutic efficacy and safety. North America leads the global market with a 41.6% share in 2024, supported by robust R&D infrastructure and high biologic adoption rates, followed by Europe and Asia-Pacific, which are witnessing rapid expansion through technological and manufacturing advancements.
Market Insights
- The MA Therapeutics market was valued at USD 7.55 billion in 2024 and is projected to reach USD 20.67 billion by 2032, growing at a CAGR of 13.42%.
- Market growth is driven by increasing adoption of targeted monoclonal antibody therapies and continuous R&D investments in advanced biologics.
- Rising development of bispecific and antibody-drug conjugate platforms highlights an emerging trend toward enhanced precision and efficacy in treatment.
- The market is competitive, with global players focusing on innovation, strategic partnerships, and biosimilar expansion to strengthen their portfolios.
- Regionally, North America leads with 41.6% share, followed by Europe at 30.8% and Asia-Pacific at 20.7%, while the humanized source segment dominates globally with 46.8% share.
Market Segmentation Analysis:
By Source
The humanized segment dominated the MA Therapeutics market in 2024, accounting for around 46.8% of the total share. Its dominance is driven by lower immunogenicity and improved therapeutic efficacy compared to murine and chimeric antibodies. Humanized antibodies combine non-human variable regions with human frameworks, enhancing compatibility and safety. The growing demand for targeted monoclonal antibody therapies in oncology and autoimmune disorders supports the growth of this segment. Increasing clinical success rates and FDA approvals for humanized antibody-based drugs further strengthen their position as the preferred therapeutic class globally.
- For instance, Regeneron Pharmaceuticals’ dupilumab has been approved for use in over 60 countries and supported by data from more than 10 phase III clinical trials involving 4,000 patients with atopic dermatitis.
By Application
The oncology segment held the largest share of approximately 61.2% in 2024, driven by the widespread adoption of monoclonal antibodies in cancer therapy. These antibodies target specific tumor antigens, improving treatment precision and reducing side effects. The segment’s growth is fueled by rising cancer prevalence and strong R&D investment in immuno-oncology. Advancements such as checkpoint inhibitors and antibody-drug conjugates continue to expand therapeutic options. Increasing approvals of antibody-based treatments by major companies highlight oncology as the key driver of the MA Therapeutics market.
- For instance, Genentech's atezolizumab (Tecentriq) was studied in the IMpower150 phase III clinical trial involving 1,202 participants with metastatic non-squamous non-small cell lung cancer.
By End Use
Hospitals accounted for the largest share of about 57.6% in 2024, supported by the high volume of biologic drug administration in clinical settings. Hospitals serve as the primary point of care for cancer, autoimmune, and infectious disease treatments involving monoclonal antibodies. The presence of advanced infusion facilities and skilled healthcare professionals ensures safe delivery and monitoring of therapies. Increasing adoption of hospital-based biologic therapies, supported by reimbursement policies and patient trust, continues to strengthen this segment’s dominance in the MA Therapeutics market.
Key Growth Drivers
Rising Adoption of Targeted Therapies
The growing preference for targeted treatments is a major growth driver in the MA Therapeutics market. Monoclonal antibodies offer precise targeting of disease-specific antigens, minimizing side effects and improving patient outcomes. This approach is especially effective in oncology, autoimmune, and infectious diseases. Increasing clinical success and regulatory approvals for targeted antibody-based drugs continue to accelerate adoption across healthcare systems, driving strong market expansion globally.
- For instance, During the LUCENT Phase 3 trials for moderately to severely active ulcerative colitis, Eli Lilly's mirikizumab was studied in 1,162 patients during the 12-week induction phase (LUCENT-1).
Expanding Biopharmaceutical R&D Investments
Biopharmaceutical companies are increasing investments in research and development to enhance monoclonal antibody innovation. These investments focus on discovering new therapeutic targets, optimizing antibody engineering, and improving production efficiency. The rise of next-generation biologics such as bispecific antibodies and antibody-drug conjugates reflects this trend. Continuous advancements in recombinant DNA technology and expression systems further support rapid clinical translation, strengthening the commercial potential of antibody therapeutics.
- For instance, Novartis’ secukinumab has treated more than 1.5 million patients globally for plaque psoriasis, ankylosing spondylitis, and psoriatic arthritis since its approval, supported by extensive post-marketing data.
Growing Prevalence of Chronic and Autoimmune Diseases
The rising global burden of chronic conditions such as cancer, rheumatoid arthritis, and multiple sclerosis is fueling demand for advanced biologic therapies. Monoclonal antibodies provide effective and targeted treatment options for patients unresponsive to traditional small-molecule drugs. Increasing healthcare spending and better diagnostic capabilities are also expanding patient access to antibody-based therapies. This growing patient base continues to drive sustained market growth for MA Therapeutics.
Key Trends and Opportunities
Emergence of Bispecific and Multispecific Antibodies
The development of bispecific and multispecific antibodies presents a strong opportunity for innovation in MA Therapeutics. These advanced molecules can simultaneously bind to multiple targets, enhancing therapeutic precision and efficacy. Pharmaceutical companies are actively investing in these formats to address complex diseases such as cancer and autoimmune disorders. This technological evolution is expected to shape the next phase of biologic therapy, expanding the application range and improving patient response rates.
- For instance, in a case study involving a collaboration with Sumitomo Pharma, Exscientia's Centaur AI platform demonstrated a significant reduction in the drug discovery timeline for the compound DSP-1181, which was developed from initial screening to preclinical candidate in under 12 months.
Integration of AI and Machine Learning in Antibody Discovery
AI and machine learning are transforming antibody research by accelerating candidate screening and structural prediction. These tools help identify high-affinity antibody sequences and optimize molecular design with greater speed and accuracy. The use of computational platforms reduces development timelines and R&D costs while improving success rates. This integration offers major opportunities for efficient therapeutic discovery, enabling faster transition from preclinical stages to clinical trials.
- For instance, WuXi Biologics operates a global manufacturing network with over 430,000 liters of bioreactor capacity planned after 2024, supporting global-scale monoclonal antibody production and clinical supply.
Expansion into Emerging Markets
Expanding biopharmaceutical infrastructure in emerging economies provides a major opportunity for market growth. Countries in Asia-Pacific and Latin America are increasing investments in biologics manufacturing and clinical trials. Rising healthcare awareness, government support, and local production capabilities are improving access to monoclonal antibody therapies. These developments are expected to create new growth avenues and reduce dependency on imports from established regions.
Key Challenges
High Manufacturing and Production Costs
The complex production process of monoclonal antibodies remains a major challenge for manufacturers. The need for specialized bioreactors, stringent purification systems, and cold-chain logistics significantly increases operational expenses. These costs limit affordability, especially in low-income regions, and pose barriers to large-scale adoption. Ongoing efforts to develop cost-efficient cell culture methods and biosimilar versions aim to reduce price constraints and improve market accessibility.
Stringent Regulatory and Approval Frameworks
Strict regulatory standards governing monoclonal antibody development and approval slow down market entry for new therapies. Extensive clinical trials and post-marketing safety assessments increase time-to-market and development costs. Variations in global approval procedures add further complexity for manufacturers. Meeting evolving quality, efficacy, and safety requirements remains a significant hurdle, demanding continuous adaptation to regulatory expectations across key regions.
Regional Analysis
North America North America dominated the MA Therapeutics market in 2024, accounting for around 41.6% of the total share. The region’s strong position is driven by advanced healthcare infrastructure, high R&D investments, and early adoption of monoclonal antibody-based therapies. The United States leads due to the presence of major biopharmaceutical companies and robust clinical trial activity. Continuous approval of innovative biologics and growing demand for oncology and autoimmune disease treatments further support market expansion across the region, while Canada contributes through increasing focus on biosimilars and precision medicine initiatives.
Europe
Europe held a significant share of about 30.8% in 2024, supported by strong biotechnological research and established regulatory frameworks. The region’s growth is led by countries such as Germany, the United Kingdom, and France, which emphasize early biologics adoption and advanced clinical research programs. Favorable reimbursement policies and collaborations between pharmaceutical firms and academic institutions continue to accelerate product development. The demand for monoclonal antibodies in oncology and chronic inflammatory diseases remains strong, while the expansion of biosimilar approvals helps improve patient access to cost-effective therapies.
Asia-Pacific
Asia-Pacific accounted for approximately 20.7% of the MA Therapeutics market in 2024, driven by rising healthcare spending and growing biopharmaceutical capabilities. China, Japan, and India are emerging as key contributors due to increased clinical research activity and government support for biologics production. Expanding healthcare coverage and rising incidence of cancer and autoimmune diseases are boosting regional demand. Pharmaceutical companies are investing in local manufacturing and partnerships to improve drug availability, positioning Asia-Pacific as the fastest-growing region in the MA Therapeutics market during the forecast period.
Latin America
Latin America captured around 4.2% of the total market share in 2024, supported by expanding healthcare infrastructure and growing focus on biologic drug adoption. Brazil and Mexico lead the market due to increasing approvals of monoclonal antibody-based therapies and government support for advanced treatments. Rising prevalence of chronic diseases and improving patient awareness are stimulating demand for antibody therapeutics. However, high treatment costs and limited manufacturing capacity continue to restrict broader access, creating opportunities for biosimilar adoption and international collaboration to improve affordability.
Middle East & Africa
The Middle East & Africa region held a modest share of nearly 2.7% in 2024, reflecting gradual adoption of monoclonal antibody therapies. Growth is driven by increasing investments in specialized healthcare facilities and expanding access to biologics in Gulf Cooperation Council countries. Rising prevalence of cancer and infectious diseases is encouraging the use of targeted therapies. However, limited R&D capacity and high drug costs hinder widespread availability. Ongoing partnerships with international pharmaceutical firms and regional healthcare reforms are expected to enhance accessibility and drive future growth.
Market Segmentations:
By Source
- Murine
- Chimeric
- Humanized
- Human
By Application
- Oncology
- Autoimmune Diseases
- Infectious Diseases
- Neurological Diseases
- Others
By End Use
- Hospitals
- Specialty Centers
- Others
By Geography
- North America
- U.S.
- Canada
- Mexico
- Europe
- Germany
- France
- U.K.
- Italy
- Spain
- Rest of Europe
- Asia Pacific
- China
- Japan
- India
- South Korea
- South-east Asia
- Rest of Asia Pacific
- Latin America
- Brazil
- Argentina
- Rest of Latin America
- Middle East & Africa
- GCC Countries
- South Africa
- Rest of the Middle East and Africa
Competitive Landscape
The MA Therapeutics market features strong competition among leading biopharmaceutical companies such as Bluebird Bio, Sanofi S.A., Eli Lilly and Company, AstraZeneca plc, Biogen Inc., Amgen Inc., F. Hoffmann-La Roche Ltd., Bayer AG, Thermo Fisher Scientific, Inc., Johnson & Johnson Services, Inc., Daiichi Sankyo Company, Limited, Merck & Co., Inc., GlaxoSmithKline plc, Viatris Inc., Bristol Myers Squibb, Abbott Laboratories, Novo Nordisk A/S, Merck KGaA, Pfizer Inc., and Novartis AG. Market participants focus on expanding their antibody portfolios through research collaborations, licensing agreements, and strategic mergers. They are investing heavily in developing next-generation biologics, including bispecific antibodies and antibody-drug conjugates, to improve efficacy and safety profiles. Companies are also leveraging advanced technologies such as artificial intelligence and high-throughput screening to accelerate discovery. Additionally, firms are expanding their presence in emerging economies through local manufacturing partnerships to enhance accessibility and meet the rising global demand for monoclonal antibody-based therapies.
Key Player Analysis
- Bluebird Bio
- Sanofi S.A.
- Eli Lilly and Company
- AstraZeneca plc
- Biogen Inc.
- Amgen Inc.
- F. Hoffmann-La Roche Ltd.
- Bayer AG
- Thermo Fisher Scientific, Inc.
- Johnson & Johnson Services, Inc.
- Daiichi Sankyo Company, Limited
- Merck & Co., Inc.
- GlaxoSmithKline plc
- Viatris Inc.
- Bristol Myers Squibb
- Abbott Laboratories
- Novo Nordisk A/S
- Merck KGaA
- Pfizer Inc.
- Novartis AG
Recent Developments
- In 2024, Bayer and MOMA Therapeutics entered into a collaboration agreement to discover and develop a new generation of precision therapeutics.
- In 2023, Daiichi Sankyo received approval from Japan's Ministry of Health, Labour and Welfare (MHLW) for its Daichirona® (DS-5670), an Omicron XBB.1.5-adapted monovalent mRNA vaccine against COVID-19.
- In 2022, Bluebird Bio commercially launched its gene therapy Zynteglo for transfusion-dependent beta-thalassemia and Skysona for cerebral adrenoleukodystrophy.
Report Coverage
The research report offers an in-depth analysis based on Source, Application, End-Use and Geography. It details leading market players, providing an overview of their business, product offerings, investments, revenue streams, and key applications. Additionally, the report includes insights into the competitive environment, SWOT analysis, current market trends, as well as the primary drivers and constraints. Furthermore, it discusses various factors that have driven market expansion in recent years. The report also explores market dynamics, regulatory scenarios, and technological advancements that are shaping the industry. It assesses the impact of external factors and global economic changes on market growth. Lastly, it provides strategic recommendations for new entrants and established companies to navigate the complexities of the market.
Future Outlook
- The MA Therapeutics market will continue expanding with increasing adoption of targeted biologic therapies.
- Humanized and fully human antibodies will dominate due to higher efficacy and lower immunogenicity.
- Oncology will remain the leading application segment, supported by ongoing innovations in immunotherapy.
- Growth in autoimmune and infectious disease treatments will further diversify therapeutic use.
- AI-driven antibody discovery and design will accelerate drug development timelines.
- Biosimilar monoclonal antibodies will gain traction, improving accessibility across emerging markets.
- Strategic collaborations between pharma and biotech firms will enhance R&D efficiency.
- Asia-Pacific will experience the fastest growth due to expanding biologics infrastructure.
- Continuous improvements in manufacturing technology will lower production costs.
- Personalized medicine trends will drive demand for precision-targeted monoclonal antibody therapies.
Request a Free Sample
Fill in your details and we'll send you a free sample report.
- Sample data tables & charts
- Research methodology
Need a Custom Version of This Report?
Tailor the scope, geography, or segments to your exact requirements.
- Custom geography or segment scope
- Direct access to our analyst team
Frequently Asked Questions
What is the current market size for MA Therapeutics Market, and what is its projected size in 2032?
At what Compound Annual Growth Rate is the MA Therapeutics Market projected to grow between 2025 and 2032?
Which MA Therapeutics Market segment held the largest share in 2024?
What are the primary factors fueling the growth of the MA Therapeutics Market?
Who are the leading companies in the MA Therapeutics Market?
Which region commanded the largest share of the MA Therapeutics Market in 2024?
Table of Content
Chapter 1. Report Introduction
- 1.1 Report Description & Purpose
- 1.1.1 Report Title & Market Definition
- 1.1.2 Unique Selling Propositions (USP) & Key Differentiators
- 1.1.3 Value Proposition for Stakeholders
- 1.2 Research Objectives
- 1.2.1 Market Sizing Objectives (Volume & Revenue)
- 1.2.2 Segmentation Objectives
- 1.2.3 Competitive Intelligence Objectives
- 1.2.4 Forecast & Scenario Objectives
- 1.3 Report Scope
- 1.3.1 MA Therapeutics Scope – Types & Subtypes Covered
- 1.3.2 Geographic Scope – Regions & Countries Covered
- 1.3.3 Historical Period, Base Year & Forecast Period (2024; forecast to 2032)
- 1.3.4 Inclusions & Exclusions
- 1.4 HS Code & Classification Framework
- 1.5 Currency, Units & Pricing Basis
- 1.6 Target Stakeholders
- 1.7 Limitations & Assumptions
Chapter 2. Executive Summary
- 2.1 Global MA Therapeutics Market Snapshot
- 2.1.1 Market Size – Historical (2024) & Forecast (2024-2032) (2024: USD 7.55 billion → 2032: USD 20.67 billion)
- 2.1.2 Volume & Revenue – Global Totals
- 2.1.3 Key Market Highlights – Top Five Facts
- 2.2 MA Therapeutics Market Segmentation Snapshot
- 2.2.1 Market Split by Region – 2024 vs. 2032
- 2.3 Competitive Snapshot
- 2.3.1 Top 10 Players by Revenue Share – 2024
- 2.3.2 Top 10 Players by Volume Share – 2024
- 2.3.3 Recent Strategic Developments (18-Month Summary)
- 2.4 Key Investment Highlights & Strategic Conclusions
Chapter 3. MA Therapeutics Market Dynamics & Industry Analysis
- 3.1 Market Overview & Context
- 3.1.1 MA Therapeutics Market Position in the Broader Automotive Value Chain
- 3.1.2 OEM vs. Replacement Market Dynamics
- 3.1.3 Market Maturity & Development Stage by Region
- 3.2 MA Therapeutics Market Drivers
- 3.3 MA Therapeutics Market Restraints & Challenges
- 3.4 MA Therapeutics Market Opportunities
- 3.5 Porter's Five Forces Analysis
- 3.5.1 Threat of New Entrants
- 3.5.2 Bargaining Power of Suppliers
- 3.5.3 Bargaining Power of Buyers
- 3.5.4 Threat of Substitutes
- 3.5.5 Competitive Rivalry – Intensity Assessment
- 3.6 MA Therapeutics Value Chain Analysis
- 3.6.1 Upstream – Raw Material/Input Suppliers
- 3.6.1.1 Raw Material/Input 1
- 3.6.1.2 Raw Material/Input 2
- 3.6.1.3 Raw Material/Input 3
- 3.6.2 Midstream – Production/Manufacturing/Service Delivery
- 3.6.2.1 Production/Process Overview
- 3.6.2.2 Key Facility Locations & Capacity by Manufacturer
- 3.6.3 Downstream – Distribution & End Consumer
- 3.6.3.1 Primary Channel – B2B/OEM
- 3.6.3.2 Secondary Channels – Dealer, Retail, Online, Direct
- 3.6.4 Value Chain Profitability Analysis
- 3.6.1 Upstream – Raw Material/Input Suppliers
- 3.7 PESTEL Analysis
- 3.7.1 Political Factors
- 3.7.2 Economic Factors
- 3.7.3 Social Factors
- 3.7.4 Technological Factors
- 3.7.5 Environmental Factors
- 3.7.6 Legal Factors
- 3.8 MA Therapeutics Supply Chain Analysis
- 3.8.1 Raw Material/Input Supply Risk Assessment
- 3.8.2 Manufacturing Concentration Risk (Geographic Exposure)
- 3.8.3 Trade Disruption Impact Analysis
- 3.9 Regulatory & Policy Landscape
Note: The regulatory and policy landscape section covers regulations based on their applicability to the market, MA Therapeutics category, geography, and scope of the study. Only regulatory frameworks with a material impact on operations, compliance, trade, sustainability, or market access are analyzed in detail.
Chapter 4. Key Investment Pockets & Opportunity Analysis
- 4.1 MA Therapeutics Market Attractiveness Analysis
- 4.1.1 By Region – Investment Attractiveness Matrix (Volume × CAGR)
- 4.2 Absolute Revenue Growth Opportunity
- 4.2.1 By Region – Absolute USD Growth Through 2032
- 4.3 Incremental Volume Opportunity
- 4.3.1 By Region – Incremental Volume Through 2032
- 4.3.2 Segment – Incremental Volume
- 4.4 Emerging Submarket Opportunity Deep Dive (Subject to Applicability)
- 4.5 Emerging Market Opportunity Scorecards
- 4.5.1 United States
- 4.5.2 Europe
- 4.5.3 Asia
- 4.5.4 Middle East & Africa
Note: Emerging Market Opportunity Scorecards will be included based on relevance and strategic importance. Regions listed are indicative and may vary depending on data availability and market dynamics.
Chapter 5. MA Therapeutics Import-Export Analysis & Trade Flows
- 5.1 Global Trade Overview
- 5.1.1 Global Export Value by Country (2024)
- 5.1.2 Global Export Volume by Country (2024)
- 5.1.3 Global Import Value by Country (2024)
- 5.1.4 Global Import Volume by Country (2024)
- 5.1.5 Net Trade Balance by Country (2024)
- 5.2 Export Analysis – Segment
- 5.2.1 Type 1 (HS Code)
- 5.2.2 Type 2 (HS Code)
- 5.2.3 Type 3 (HS Code)
- 5.2.4 Type 4 (HS Code)
- 5.2.5 Type 5 (HS Code)
- 5.3 Import Analysis – Segment
- 5.3.1 Type 1 (HS Code)
- 5.3.2 Type 2 (HS Code)
- 5.3.3 Type 3 (HS Code)
- 5.3.4 Type 4 (HS Code)
- 5.3.5 Type 5 (HS Code)
- 5.4 Average Unit Trade Prices
- 5.4.1 Average Export Price – Segment & Country
- 5.4.2 Average Import Price – Segment & Source Country
- 5.4.3 Price Trends (2024)
- 5.5 Key Trade Route Analysis
- 5.5.1 Trade Route 1
- 5.5.2 Trade Route 2
- 5.5.3 Trade Route 3
- 5.5.4 Trade Route 4
- 5.5.5 Trade Route 5
- 5.6 Trade Policy Impact Assessment
- 5.6.1 US Anti-Dumping & Section 301 Tariffs
- 5.6.2 EU Customs Union Impact
- 5.6.3 Major Free Trade Agreements
- 5.6.4 USMCA Rules of Origin
Note: Trade policy analysis will be included only where relevant to the MA Therapeutics market.
Chapter 6. Competitive Landscape & Company Benchmarking
- 6.1 MA Therapeutics Market Concentration & Structure
- 6.1.1 Herfindahl-Hirschman Index (HHI) – vs. 2024
- 6.1.2 Tier 1, Tier 2 & Tier 3 Market Structure
- 6.1.3 Global, Regional & Local Player Dynamics
- 6.2 MA Therapeutics Market Share Analysis – 2024
- 6.2.1 Global Revenue Share by Company
- 6.2.2 Global Volume Share by Company
- 6.2.3 Regional Revenue Share
- 6.2.4 Market Share Evolution ( vs. 2024)
- 6.2.5 OEM Segment Share by Company
- 6.2.6 Replacement Segment Share by Company
- 6.3 Production/Delivery Capacity & Facility Analysis
- 6.3.1 Global Installed Capacity
- 6.3.2 Capacity Utilization Rates
- 6.3.3 Production/Output Volume
- 6.3.4 Facility Locations & Capacity Map
- 6.3.5 Planned Capacity Additions
- 6.4 MA Therapeutics Competitive Benchmarking Matrix
- 6.4.1 Revenue, Volume, CAGR & Profitability Comparison
- 6.4.2 Channel Revenue Mix
- 6.4.3 Geographic Revenue Exposure
- 6.4.4 R&D Intensity
- 6.4.5 Sustainability Maturity
- 6.5 Strategic Developments in MA Therapeutics (Last 24 Months)
- 6.5.1 Mergers, Acquisitions & Divestments
- 6.5.2 New MA Therapeutics Launches
- 6.5.3 Facility Expansions
- 6.5.4 Strategic Alliances, Joint Ventures & Partnerships
- 6.5.5 Distribution Expansion & Market Entry
- 6.5.6 Sustainability & ESG Initiatives
- 6.6 Competitive Strategy Mapping
- 6.6.1 Leader, Challenger, Follower & Niche Classification
- 6.6.2 Pricing Strategy Comparison
- 6.6.3 Channel Strategy Matrix
Note: Strategic developments are included based on their materiality and the availability of reliable information.
Chapter 7. Global MA Therapeutics Market – By Distribution Channel
- 7.1 Segment Overview
- 7.1.1 Volume & Revenue Split by Channel (2024 & 2032)
- 7.1.2 Channel Mix Evolution (2024-2032)
Chapter 8. Regional Market Analysis – Global Overview
- 8.1 Global Regional Overview
- 8.1.1 Regional Volume Share
- 8.1.2 Regional Revenue Share
- 8.1.3 Regional Volume by Region
- 8.1.4 Regional Revenue by Region
- 8.1.5 Regional Forecast Through 2032
- 8.2 Cross-Regional Segment Analysis
- 8.2.1 By Distribution Channel
- 8.2.2 By Brand/Price Tier
Chapter 9. North America MA Therapeutics Market
- 9.1 United States
- 9.2 Canada
- 9.3 Mexico
Chapter 10. Europe MA Therapeutics Market
- 10.1 Germany
- 10.2 France
- 10.3 Italy
- 10.4 United Kingdom
- 10.5 Spain
- 10.6 Poland
- 10.7 Russia
- 10.8 Netherlands
- 10.9 Belgium
- 10.10 Sweden
- 10.11 Denmark
- 10.12 Norway
- 10.13 Rest of Europe
Chapter 11. Asia Pacific MA Therapeutics Market
- 11.1 China
- 11.2 India
- 11.3 Japan
- 11.4 South Korea
- 11.5 Thailand
- 11.6 Indonesia
- 11.7 Vietnam
- 11.8 Malaysia
- 11.9 Australia
- 11.10 Rest of Asia Pacific
Chapter 12. Latin America MA Therapeutics Market
- 12.1 Brazil
- 12.2 Argentina
- 12.3 Colombia
- 12.4 Chile
- 12.5 Rest of Latin America
Chapter 13. Middle East MA Therapeutics Market
- 13.1 Saudi Arabia
- 13.2 United Arab Emirates
- 13.3 Turkey
- 13.4 Israel
- 13.5 Iran
- 13.6 Rest of the Middle East
Chapter 14. Africa MA Therapeutics Market
- 14.1 South Africa
- 14.2 Egypt
- 14.3 Nigeria
- 14.4 Morocco
- 14.5 Rest of Africa
Chapter 15. MA Therapeutics Company Profiles
- 15.1 [Company 01]
- 15.1.1 Company Overview
- 15.1.2 Key Management Personnel
- 15.1.3 Products & Services Portfolio
- 15.1.4 Financial Performance
- 15.1.5 Key Market Focus & Geographic Presence
- 15.1.6 Recent Developments & Strategic Initiatives
Note: The company profile list is preliminary and may change based on research findings, market developments, data availability, and client requirements.
Chapter 16. Appendices
- Appendix A – List of Abbreviations & Acronyms
- Appendix B – Industry Classification Code Reference – Full Series
- Appendix C – Production & Capacity Data Tables
- Appendix D – End-Use & Demand Base Tables
- Appendix E – Consumption & Replacement Rate Assumptions
- Appendix F – ASP Reference Tables
- Appendix G – Manufacturing & Facility Database
- Appendix H – Import-Export Data Tables
- Appendix I – Regulatory Summary Tables
- Appendix J – Primary Research Participant List (Anonymized)
- Appendix K – Primary Research Questionnaire Framework
- Appendix L – Data Sources & Bibliography
- Appendix M – Market Size Divergence & Source Comparison
Chapter 17. Research Methodology
- 17.1 Research Framework & Philosophy
- 17.2 Secondary Research – Sources, Hierarchy & Data Extraction
- 17.3 Data Modeling – Bottom-Up & Top-Down Market Sizing
- 17.4 Primary Research – Stakeholder Framework, LOI & Sample Sizes
- 17.5 Forecast Methodology – Regression, Scenario & Sensitivity Analysis
- 17.6 Quality Control – Four-Layer Validation Framework
- 17.7 Limitations & Standard Assumptions
- 17.8 Disclaimer
