
Market Overview
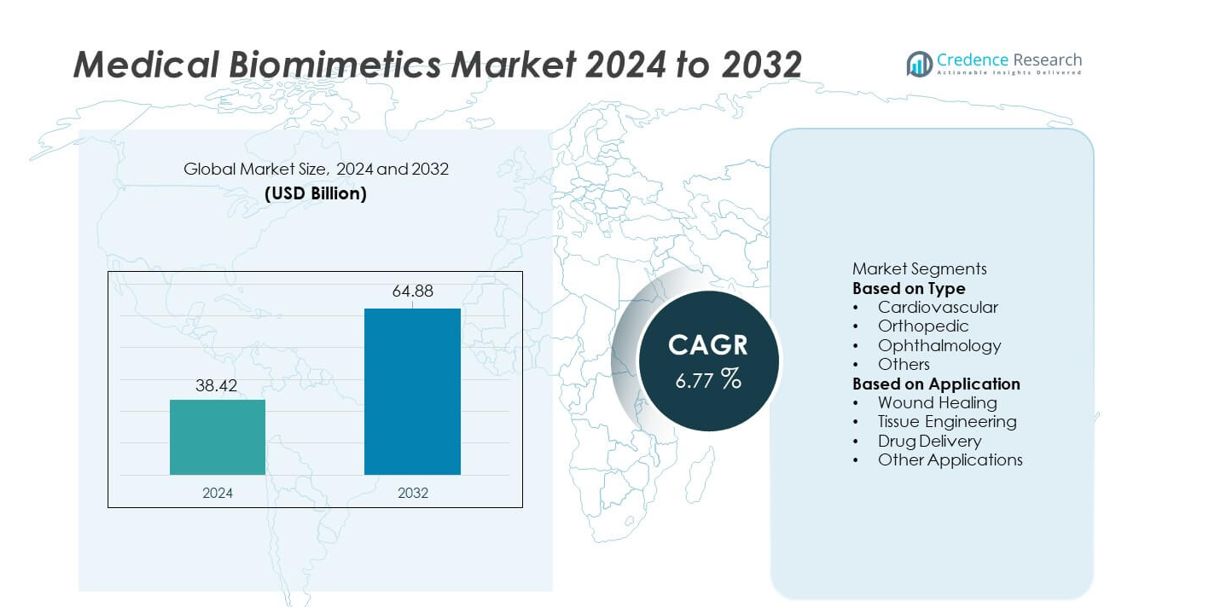
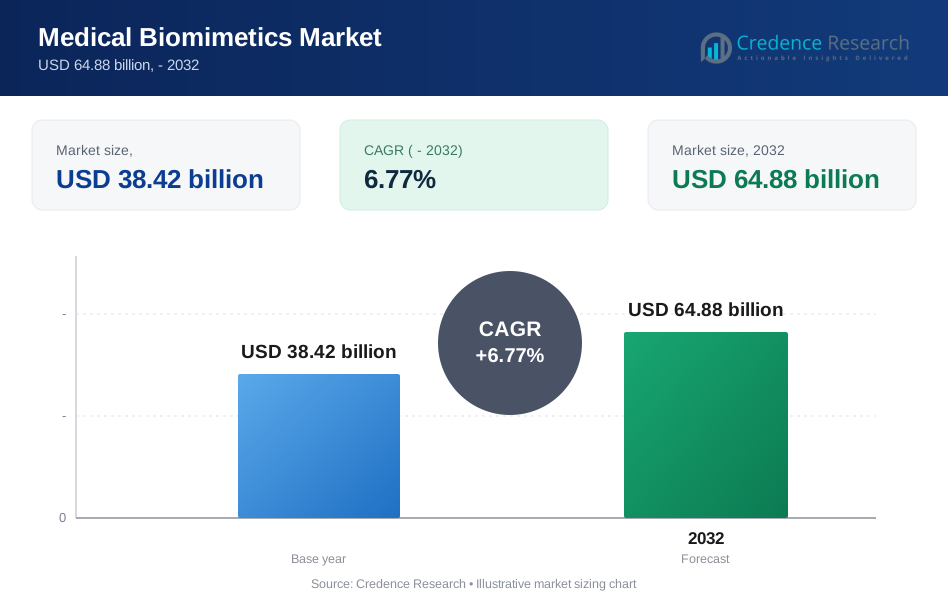
The Medical Biomimetics market reached USD 38.42 billion in 2024 and is projected to rise to USD 64.88 billion by 2032, reflecting a CAGR of 6.77% during the forecast period.
| REPORT ATTRIBUTE | DETAILS |
|---|---|
| Historical Period | 2020-2023 |
| Base Year | 2024 |
| Forecast Period | 2025-2032 |
| Medical Biomimetics Market Size 2024 | USD 38.42 billion |
| Medical Biomimetics Market, CAGR | 6.77% |
| Medical Biomimetics Market Size 2032 | USD 64.88 billion |
The Medical Biomimetics market is shaped by key players including Otsuka Medical Devices Group, Stryker, Abbott, AVINENT Science and Technology, SynTouch Inc., Osteopore International Pte Ltd, Vandstrom Inc., Biomimetics Technologies Inc., Swedish Biomimetics 3000 ApS, and Keystone Dental Group. These companies advance biomimetic implants, regenerative scaffolds, and smart therapeutic materials to strengthen clinical outcomes. North America leads the global market with a 37% share, supported by strong R&D activity, rapid adoption of regenerative technologies, and robust healthcare spending. Europe follows with a 29% share, driven by regulatory support and technological innovation across medical biomaterials and tissue engineering applications.
Market Insights
- The Medical Biomimetics market reached USD 38.42 billion in 2024 and will grow at a CAGR of 6.77% through 2032.
- Rising demand for regenerative medicine and tissue engineering strengthens adoption, with the Cardiovascular segment leading at a 38% share due to high use of biomimetic implants.
- Advancements in smart biomimetic materials and nano-engineered structures drive new trends, enabling better wound repair, targeted drug delivery, and patient-specific implant design.
- Strong competition among key players enhances innovation, while high development costs and strict regulatory pathways remain major restraints across global markets.
- North America leads with a 37% share, followed by Europe at 29% and Asia Pacific at 24%, supporting broader expansion of tissue engineering applications, which hold a dominant 41% share within the market.
Market Segmentation Analysis:
By Type
The Cardiovascular segment leads the Medical Biomimetics market with a 38% share, supported by strong use of biomimetic stents, heart valves, and vascular grafts that mimic natural tissue motion and reduce complication risks. Demand rises as clinicians seek solutions that improve durability and enhance hemodynamic performance. Orthopedic biomimetics grow due to rising adoption of bone scaffolds and joint repair materials. Ophthalmology expands with corneal and retinal substitutes that improve visual restoration. Other segments progress through niche innovations. Growing clinical acceptance and product validation continue to strengthen adoption across all biomimetic types.
- For instance, Keystone Dental Group expanded its implant line with 27 new titanium designs that support higher osseointegration efficiency. The company also enhanced its surface treatment platform used in more than 40 countries.
By Application
Tissue Engineering holds the dominant position with a 41% share, driven by the rising use of biomimetic scaffolds, regenerative matrices, and engineered constructs that replicate natural tissue environments. Research labs and healthcare providers adopt these materials to accelerate recovery and enhance cell growth efficiency. Wound Healing gains traction through advanced hydrogels and dressings that promote faster repair. Drug Delivery evolves with biomimetic carriers that improve targeting accuracy and therapeutic control. Other applications expand within nerve repair and reconstructive procedures. Increased investment in regenerative medicine continues to support strong growth across all application areas.
- For instance, Osteopore International supplied more than 35,000 bioresorbable scaffold implants across clinical centers, each produced using high-precision 3D micro-architecture.
Key Growth Driver
Growing Adoption of Regenerative and Tissue Engineering Solutions
Healthcare providers increase the use of biomimetic materials that support cell regeneration and faster healing. Hospitals rely on engineered tissues and scaffolds to treat wounds, orthopedic defects, and cardiovascular damage. Strong biocompatibility and improved patient outcomes drive higher adoption across clinical settings. Investment in regenerative medicine accelerates innovation and expands the use of biomimetic platforms. These factors position biomimetics as essential tools for advanced tissue repair.
- For instance, Johnson & Johnson’s DePuy Synthes distributed orthopedic regeneration devices using advanced coatings and surface technologies.
Advancements in Biomimetic Material Science and Nanotechnology
Developers create nano-engineered materials that mimic cellular structures and improve biological interaction. These materials enhance adhesion, durability, and therapeutic precision in drug delivery, wound care, and implant applications. Better fabrication methods help companies produce high-performance devices with greater reliability. Continuous innovation in nanotechnology increases clinical confidence. This progress expands use across multiple medical fields.
- For instance, Abbott integrated fluoropolymer coatings into numerous vascular devices manufactured annually.
Increasing Burden of Chronic Diseases Supporting Biomimetic Demand
Higher cases of cardiovascular disease, diabetes, orthopedic injuries, and visual impairment raise demand for advanced biomimetic devices. Clinicians prefer materials that copy natural tissue function and reduce complication risk. Aging populations further drive use of regenerative implants and therapeutic systems. Supportive government programs advance next-generation treatment adoption. These conditions create steady market growth.
Key Trend & Opportunities
Expansion of Smart and Responsive Biomimetic Systems
Manufacturers design biomimetic platforms that adjust to physiological changes and support precision treatment. Responsive materials improve wound repair, drug release, and implant performance. Integration with sensing technology enables real-time monitoring and better clinical oversight. These features enhance treatment outcomes and reduce variability. Growing research funding supports continuous innovation.
- For instance, SynTouch delivered BioTac sensors, each containing multiple electrodes and a fluid-filled membrane that enables real-time tactile feedback for medical devices.
Rising Use of Biomimetics in Personalized Medicine
Personalized care increases demand for biomimetic solutions tailored to patient biology. Custom scaffolds, adaptive implants, and targeted carriers support individual treatment plans. Technologies such as 3D printing and AI modeling allow precise designs that match patient anatomy. This opportunity strengthens competitive differentiation and improves clinical success. Increased preference for minimally invasive therapy boosts adoption.
- For instance, Materialise supported more than 400,000 personalized surgical planning cases through its medical modeling platform.
Key Challenge
High Development and Manufacturing Costs
Biomimetic devices require specialized materials, strict testing, and advanced fabrication methods, which raise production costs. Smaller companies face financial barriers due to complex validation and regulatory needs. Limited large-scale manufacturing capability reduces affordability in developing regions. These challenges slow adoption despite proven clinical benefits. Scalable production systems are needed to control costs.
Regulatory Complexity and Lengthy Approval Timelines
Biomimetic materials undergo extensive evaluation to confirm biocompatibility, long-term safety, and performance stability. Regulatory agencies require detailed clinical evidence because these products often involve new mechanisms. Long approval cycles delay market entry and increase development costs. Smaller innovators face added hurdles in meeting documentation demands. These constraints slow commercialization across healthcare systems
Regional Analysis
North America
North America holds a 37% market share due to strong adoption of regenerative medicine, biomimetic implants, and advanced therapeutic materials. Research institutions and biotech companies lead innovation in tissue engineering and nanostructured biomimetic platforms. Hospitals invest in high-performance cardiovascular and orthopedic biomimetic devices to improve patient outcomes. Supportive reimbursement policies and active clinical trials strengthen product uptake. Rising chronic disease prevalence and expanding collaborations between academia and industry continue to drive growth across the United States and Canada.
Europe
Europe accounts for a 29% market share, supported by strong regulatory focus on advanced biomaterials and safe clinical integration. The region benefits from extensive investment in stem cell research, 3D-biomimetic constructs, and next-generation implants for orthopedic and cardiovascular repair. Hospitals adopt biomimetic wound healing and drug delivery platforms to improve treatment efficiency. Academic networks drive material innovation through collaborative programs. Growing healthcare modernization in Germany, France, and the UK enhances demand for high-quality biomimetic technologies.
Asia Pacific
Asia Pacific holds a 24% market share, driven by rising demand for regenerative therapies, expanding healthcare infrastructure, and strong government support for biomedical innovation. China, Japan, and South Korea lead adoption of biomimetic implants, engineered tissues, and nano-enabled drug delivery systems. Investments in biotech clusters accelerate material research and commercialization. Growing patient pools with chronic diseases boost clinical use of biomimetic solutions. Rising medical tourism and expanding manufacturing capacity further strengthen regional market growth.
Latin America
Latin America maintains a 6% market share, supported by increasing interest in advanced biomaterials for orthopedic repair, cardiovascular treatment, and reconstructive procedures. Brazil and Mexico drive adoption through expanding private healthcare networks and rising investment in regenerative solutions. Hospitals integrate biomimetic wound healing and tissue regeneration technologies to improve recovery outcomes. Partnerships with global research institutions enhance knowledge transfer and product access. Although growth remains steady, high costs and limited specialized facilities present challenges.
Middle East & Africa
The Middle East & Africa region holds a 4% market share, influenced by rising investment in advanced medical technologies and increasing prevalence of chronic diseases. Gulf countries adopt biomimetic solutions for cardiovascular and orthopedic care within modernized healthcare systems. Research centers in the UAE and Saudi Arabia support projects in regenerative medicine and biomimetic material development. Hospitals integrate high-quality wound care and drug delivery systems to enhance patient outcomes. Market expansion continues as governments prioritize healthcare innovation despite cost and skill-based limitations.
Market Segmentations:
By Type
- Cardiovascular
- Orthopedic
- Ophthalmology
- Others
By Application
- Wound Healing
- Tissue Engineering
- Drug Delivery
- Other Applications
By Geography
- North America
- U.S.
- Canada
- Mexico
- Europe
- Germany
- France
- U.K.
- Italy
- Spain
- Rest of Europe
- Asia Pacific
- China
- Japan
- India
- South Korea
- South-east Asia
- Rest of Asia Pacific
- Latin America
- Brazil
- Argentina
- Rest of Latin America
- Middle East & Africa
- GCC Countries
- South Africa
- Rest of the Middle East and Africa
Competitive Landscape
The Medical Biomimetics market features active competition among leading players such as Otsuka Medical Devices Group, Stryker, Abbott, AVINENT Science and Technology, SynTouch Inc., Osteopore International Pte Ltd, Vandstrom Inc., Biomimetics Technologies Inc., Swedish Biomimetics 3000 ApS, and Keystone Dental Group. Companies focus on developing bio-inspired implants, regenerative materials, and advanced tissue engineering platforms to strengthen clinical outcomes and expand product portfolios. Strategic initiatives include research collaborations, regulatory approvals, and technology-driven enhancements in scaffolds, drug delivery systems, and smart biomimetic devices. Market participants invest in nanotechnology and 3D-printing to deliver personalized and high-performance solutions. Partnerships with hospitals and research institutes support validation and global expansion. Growing emphasis on minimally invasive treatments and patient-specific designs drives innovation, while strong competition encourages continuous improvement in material science, product durability, and biomimetic functionality.
Key Player Analysis
- Keystone Dental Group
- SynTouch Inc.
- Abbott
- Swedish Biomimetics 3000 ApS
- Biomimetics Technologies Inc
- AVINENT Science and Technology
- Vandstrom, Inc.
- Osteopore International Pte Ltd
- Otsuka Medical Devices Group
- Stryker
Recent Developments
- In October 2023, Stryker reported that its Q Guidance System with Spine Guidance Software was used in roughly 2,400 surgical procedures during its first year of use.
- In August 2023, Otsuka Medical Devices Group announced that its Paradise™ Ultrasound Renal Denervation System received a favorable FDA Advisory Committee vote.
Report Coverage
The research report offers an in-depth analysis based on Type, Application and Geography. It details leading market players, providing an overview of their business, product offerings, investments, revenue streams, and key applications. Additionally, the report includes insights into the competitive environment, SWOT analysis, current market trends, as well as the primary drivers and constraints. Furthermore, it discusses various factors that have driven market expansion in recent years. The report also explores market dynamics, regulatory scenarios, and technological advancements that are shaping the industry. It assesses the impact of external factors and global economic changes on market growth. Lastly, it provides strategic recommendations for new entrants and established companies to navigate the complexities of the market.
Future Outlook
- Demand for regenerative therapies will rise as biomimetic materials improve healing outcomes.
- Adoption of nano-engineered biomimetic structures will expand across implants and drug delivery.
- Personalized medicine will strengthen growth through patient-specific scaffolds and adaptive implants.
- Integration of smart and responsive biomimetic systems will enhance real-time clinical monitoring.
- Advancements in 3D printing will support rapid development of custom biomimetic devices.
- Collaboration between biotech firms and research institutes will accelerate product innovation.
- Wider use of biomimetic platforms in chronic disease management will boost clinical adoption.
- Regulatory frameworks will evolve to support faster approvals for advanced biomaterials.
- Expansion in emerging markets will increase access to next-generation biomimetic technologies.
- Investment in cost-efficient manufacturing will improve scalability and strengthen market competitiveness.
Request a Free Sample
Fill in your details and we'll send you a free sample report.
- Sample data tables & charts
- Research methodology
Need a Custom Version of This Report?
Tailor the scope, geography, or segments to your exact requirements.
- Custom geography or segment scope
- Direct access to our analyst team
Frequently Asked Questions
What is the current market size for the Medical Biomimetics market, and what is its projected size in 2032?
At what Compound Annual Growth Rate is the Medical Biomimetics market projected to grow between 2025 and 2032?
What are the major market drivers of the Medical Biomimetics industry?
What are the major market restraints of the Medical Biomimetics industry?
What are the major market opportunities of the Medical Biomimetics industry?
Who are the leading companies in the Medical Biomimetics market?
Table of Content
Chapter 1. Report Introduction
- 1.1 Report Description & Purpose
- 1.1.1 Report Title & Market Definition
- 1.1.2 Unique Selling Propositions (USP) & Key Differentiators
- 1.1.3 Value Proposition for Stakeholders
- 1.2 Research Objectives
- 1.2.1 Market Sizing Objectives (Volume & Revenue)
- 1.2.2 Segmentation Objectives
- 1.2.3 Competitive Intelligence Objectives
- 1.2.4 Forecast & Scenario Objectives
- 1.3 Report Scope
- 1.3.1 Medical Biomimetics Scope – Types & Subtypes Covered
- 1.3.2 Geographic Scope – Regions & Countries Covered
- 1.3.3 Historical Period, Base Year & Forecast Period (the historical period; forecast to 2032)
- 1.3.4 Inclusions & Exclusions
- 1.4 HS Code & Classification Framework
- 1.5 Currency, Units & Pricing Basis
- 1.6 Target Stakeholders
- 1.7 Limitations & Assumptions
Chapter 2. Executive Summary
- 2.1 Global Medical Biomimetics Market Snapshot
- 2.1.1 Market Size – Historical (the historical period) & Forecast (2032) (base year: USD 38.42 billion → 2032: USD 64.88 billion)
- 2.1.2 Volume & Revenue – Global Totals
- 2.1.3 Key Market Highlights – Top Five Facts
- 2.2 Medical Biomimetics Market Segmentation Snapshot
- 2.2.1 Market Split by Region – vs. 2032
- 2.3 Competitive Snapshot
- 2.3.1 Top 10 Players by Revenue Share –
- 2.3.2 Top 10 Players by Volume Share –
- 2.3.3 Recent Strategic Developments (18-Month Summary)
- 2.4 Key Investment Highlights & Strategic Conclusions
Chapter 3. Medical Biomimetics Market Dynamics & Industry Analysis
- 3.1 Market Overview & Context
- 3.1.1 Medical Biomimetics Market Position in the Broader Automotive Value Chain
- 3.1.2 OEM vs. Replacement Market Dynamics
- 3.1.3 Market Maturity & Development Stage by Region
- 3.2 Medical Biomimetics Market Drivers
- 3.3 Medical Biomimetics Market Restraints & Challenges
- 3.4 Medical Biomimetics Market Opportunities
- 3.5 Porter's Five Forces Analysis
- 3.5.1 Threat of New Entrants
- 3.5.2 Bargaining Power of Suppliers
- 3.5.3 Bargaining Power of Buyers
- 3.5.4 Threat of Substitutes
- 3.5.5 Competitive Rivalry – Intensity Assessment
- 3.6 Medical Biomimetics Value Chain Analysis
- 3.6.1 Upstream – Raw Material/Input Suppliers
- 3.6.1.1 Raw Material/Input 1
- 3.6.1.2 Raw Material/Input 2
- 3.6.1.3 Raw Material/Input 3
- 3.6.2 Midstream – Production/Manufacturing/Service Delivery
- 3.6.2.1 Production/Process Overview
- 3.6.2.2 Key Facility Locations & Capacity by Manufacturer
- 3.6.3 Downstream – Distribution & End Consumer
- 3.6.3.1 Primary Channel – B2B/OEM
- 3.6.3.2 Secondary Channels – Dealer, Retail, Online, Direct
- 3.6.4 Value Chain Profitability Analysis
- 3.6.1 Upstream – Raw Material/Input Suppliers
- 3.7 PESTEL Analysis
- 3.7.1 Political Factors
- 3.7.2 Economic Factors
- 3.7.3 Social Factors
- 3.7.4 Technological Factors
- 3.7.5 Environmental Factors
- 3.7.6 Legal Factors
- 3.8 Medical Biomimetics Supply Chain Analysis
- 3.8.1 Raw Material/Input Supply Risk Assessment
- 3.8.2 Manufacturing Concentration Risk (Geographic Exposure)
- 3.8.3 Trade Disruption Impact Analysis
- 3.9 Regulatory & Policy Landscape
Note: The regulatory and policy landscape section covers regulations based on their applicability to the market, Medical Biomimetics category, geography, and scope of the study. Only regulatory frameworks with a material impact on operations, compliance, trade, sustainability, or market access are analyzed in detail.
Chapter 4. Key Investment Pockets & Opportunity Analysis
- 4.1 Medical Biomimetics Market Attractiveness Analysis
- 4.1.1 By Region – Investment Attractiveness Matrix (Volume × CAGR)
- 4.2 Absolute Revenue Growth Opportunity
- 4.2.1 By Region – Absolute USD Growth Through 2032
- 4.3 Incremental Volume Opportunity
- 4.3.1 By Region – Incremental Volume Through 2032
- 4.3.2 Segment – Incremental Volume
- 4.4 Emerging Submarket Opportunity Deep Dive (Subject to Applicability)
- 4.5 Emerging Market Opportunity Scorecards
- 4.5.1 United States
- 4.5.2 Europe
- 4.5.3 Asia
- 4.5.4 Middle East & Africa
Note: Emerging Market Opportunity Scorecards will be included based on relevance and strategic importance. Regions listed are indicative and may vary depending on data availability and market dynamics.
Chapter 5. Medical Biomimetics Import-Export Analysis & Trade Flows
- 5.1 Global Trade Overview
- 5.1.1 Global Export Value by Country (the historical period)
- 5.1.2 Global Export Volume by Country (the historical period)
- 5.1.3 Global Import Value by Country (the historical period)
- 5.1.4 Global Import Volume by Country (the historical period)
- 5.1.5 Net Trade Balance by Country (the historical period)
- 5.2 Export Analysis – Segment
- 5.2.1 Type 1 (HS Code)
- 5.2.2 Type 2 (HS Code)
- 5.2.3 Type 3 (HS Code)
- 5.2.4 Type 4 (HS Code)
- 5.2.5 Type 5 (HS Code)
- 5.3 Import Analysis – Segment
- 5.3.1 Type 1 (HS Code)
- 5.3.2 Type 2 (HS Code)
- 5.3.3 Type 3 (HS Code)
- 5.3.4 Type 4 (HS Code)
- 5.3.5 Type 5 (HS Code)
- 5.4 Average Unit Trade Prices
- 5.4.1 Average Export Price – Segment & Country
- 5.4.2 Average Import Price – Segment & Source Country
- 5.4.3 Price Trends (the historical period)
- 5.5 Key Trade Route Analysis
- 5.5.1 Trade Route 1
- 5.5.2 Trade Route 2
- 5.5.3 Trade Route 3
- 5.5.4 Trade Route 4
- 5.5.5 Trade Route 5
- 5.6 Trade Policy Impact Assessment
- 5.6.1 US Anti-Dumping & Section 301 Tariffs
- 5.6.2 EU Customs Union Impact
- 5.6.3 Major Free Trade Agreements
- 5.6.4 USMCA Rules of Origin
Note: Trade policy analysis will be included only where relevant to the Medical Biomimetics market.
Chapter 6. Competitive Landscape & Company Benchmarking
- 6.1 Medical Biomimetics Market Concentration & Structure
- 6.1.1 Herfindahl-Hirschman Index (HHI) – vs.
- 6.1.2 Tier 1, Tier 2 & Tier 3 Market Structure
- 6.1.3 Global, Regional & Local Player Dynamics
- 6.2 Medical Biomimetics Market Share Analysis –
- 6.2.1 Global Revenue Share by Company
- 6.2.2 Global Volume Share by Company
- 6.2.3 Regional Revenue Share
- 6.2.4 Market Share Evolution ( vs. )
- 6.2.5 OEM Segment Share by Company
- 6.2.6 Replacement Segment Share by Company
- 6.3 Production/Delivery Capacity & Facility Analysis
- 6.3.1 Global Installed Capacity
- 6.3.2 Capacity Utilization Rates
- 6.3.3 Production/Output Volume
- 6.3.4 Facility Locations & Capacity Map
- 6.3.5 Planned Capacity Additions
- 6.4 Medical Biomimetics Competitive Benchmarking Matrix
- 6.4.1 Revenue, Volume, CAGR & Profitability Comparison
- 6.4.2 Channel Revenue Mix
- 6.4.3 Geographic Revenue Exposure
- 6.4.4 R&D Intensity
- 6.4.5 Sustainability Maturity
- 6.5 Strategic Developments in Medical Biomimetics (Last 24 Months)
- 6.5.1 Mergers, Acquisitions & Divestments
- 6.5.2 New Medical Biomimetics Launches
- 6.5.3 Facility Expansions
- 6.5.4 Strategic Alliances, Joint Ventures & Partnerships
- 6.5.5 Distribution Expansion & Market Entry
- 6.5.6 Sustainability & ESG Initiatives
- 6.6 Competitive Strategy Mapping
- 6.6.1 Leader, Challenger, Follower & Niche Classification
- 6.6.2 Pricing Strategy Comparison
- 6.6.3 Channel Strategy Matrix
Note: Strategic developments are included based on their materiality and the availability of reliable information.
Chapter 7. Global Medical Biomimetics Market – By Distribution Channel
- 7.1 Segment Overview
- 7.1.1 Volume & Revenue Split by Channel ( & 2032)
- 7.1.2 Channel Mix Evolution (2032)
Chapter 8. Regional Market Analysis – Global Overview
- 8.1 Global Regional Overview
- 8.1.1 Regional Volume Share
- 8.1.2 Regional Revenue Share
- 8.1.3 Regional Volume by Region
- 8.1.4 Regional Revenue by Region
- 8.1.5 Regional Forecast Through 2032
- 8.2 Cross-Regional Segment Analysis
- 8.2.1 By Distribution Channel
- 8.2.2 By Brand/Price Tier
Chapter 9. North America Medical Biomimetics Market
- 9.1 United States
- 9.2 Canada
- 9.3 Mexico
Chapter 10. Europe Medical Biomimetics Market
- 10.1 Germany
- 10.2 France
- 10.3 Italy
- 10.4 United Kingdom
- 10.5 Spain
- 10.6 Poland
- 10.7 Russia
- 10.8 Netherlands
- 10.9 Belgium
- 10.10 Sweden
- 10.11 Denmark
- 10.12 Norway
- 10.13 Rest of Europe
Chapter 11. Asia Pacific Medical Biomimetics Market
- 11.1 China
- 11.2 India
- 11.3 Japan
- 11.4 South Korea
- 11.5 Thailand
- 11.6 Indonesia
- 11.7 Vietnam
- 11.8 Malaysia
- 11.9 Australia
- 11.10 Rest of Asia Pacific
Chapter 12. Latin America Medical Biomimetics Market
- 12.1 Brazil
- 12.2 Argentina
- 12.3 Colombia
- 12.4 Chile
- 12.5 Rest of Latin America
Chapter 13. Middle East Medical Biomimetics Market
- 13.1 Saudi Arabia
- 13.2 United Arab Emirates
- 13.3 Turkey
- 13.4 Israel
- 13.5 Iran
- 13.6 Rest of the Middle East
Chapter 14. Africa Medical Biomimetics Market
- 14.1 South Africa
- 14.2 Egypt
- 14.3 Nigeria
- 14.4 Morocco
- 14.5 Rest of Africa
Chapter 15. Medical Biomimetics Company Profiles
- 15.1 [Company 01]
- 15.1.1 Company Overview
- 15.1.2 Key Management Personnel
- 15.1.3 Products & Services Portfolio
- 15.1.4 Financial Performance
- 15.1.5 Key Market Focus & Geographic Presence
- 15.1.6 Recent Developments & Strategic Initiatives
Note: The company profile list is preliminary and may change based on research findings, market developments, data availability, and client requirements.
Chapter 16. Appendices
- Appendix A – List of Abbreviations & Acronyms
- Appendix B – Industry Classification Code Reference – Full Series
- Appendix C – Production & Capacity Data Tables
- Appendix D – End-Use & Demand Base Tables
- Appendix E – Consumption & Replacement Rate Assumptions
- Appendix F – ASP Reference Tables
- Appendix G – Manufacturing & Facility Database
- Appendix H – Import-Export Data Tables
- Appendix I – Regulatory Summary Tables
- Appendix J – Primary Research Participant List (Anonymized)
- Appendix K – Primary Research Questionnaire Framework
- Appendix L – Data Sources & Bibliography
- Appendix M – Market Size Divergence & Source Comparison
Chapter 17. Research Methodology
- 17.1 Research Framework & Philosophy
- 17.2 Secondary Research – Sources, Hierarchy & Data Extraction
- 17.3 Data Modeling – Bottom-Up & Top-Down Market Sizing
- 17.4 Primary Research – Stakeholder Framework, LOI & Sample Sizes
- 17.5 Forecast Methodology – Regression, Scenario & Sensitivity Analysis
- 17.6 Quality Control – Four-Layer Validation Framework
- 17.7 Limitations & Standard Assumptions
- 17.8 Disclaimer
