CHAPTER NO. 1 : GENESIS OF THE MARKET
1.1 Market Prelude – Introduction & Scope
1.2 The Big Picture – Objectives & Vision
1.3 Strategic Edge – Unique Value Proposition
1.4 Stakeholder Compass – Key Beneficiaries
CHAPTER NO. 2 : EXECUTIVE LENS
2.1 Pulse of the Industry – Market Snapshot
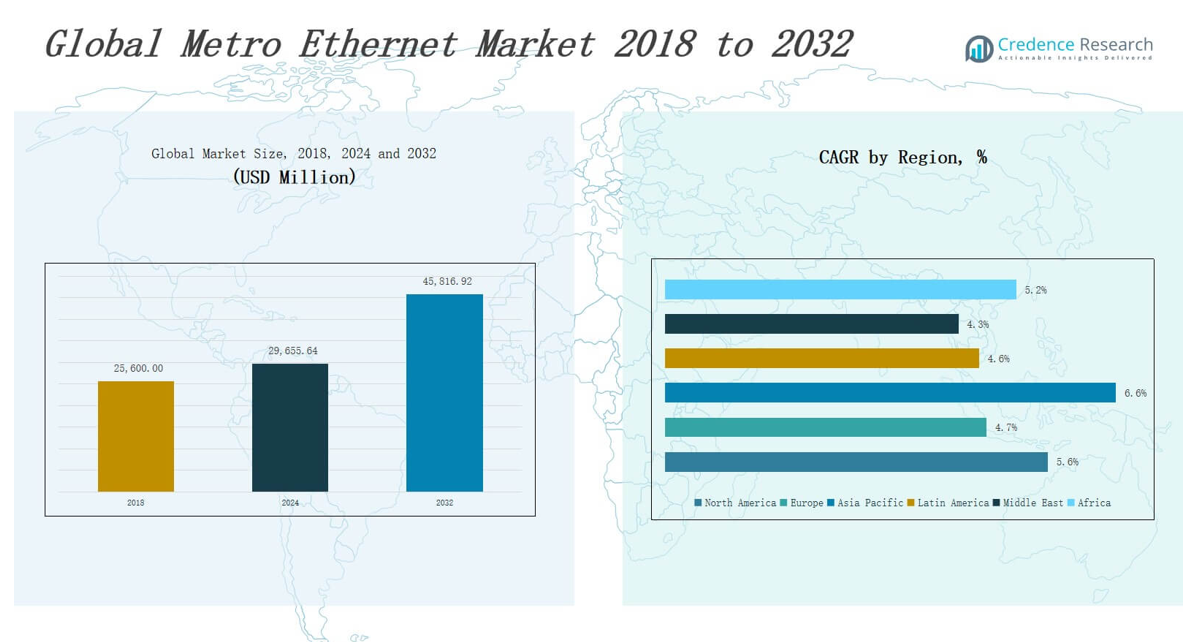
2.2 Growth Arc – Revenue Projections (USD Million)
2.3. Premium Insights – Based on Primary Interviews
CHAPTER NO. 3 : METRO ETHERNET MARKET FORCES & INDUSTRY PULSE
3.1 Foundations of Change – Market Overview
3.2 Catalysts of Expansion – Key Market Drivers
3.2.1 Momentum Boosters – Growth Triggers
3.2.2 Innovation Fuel – Disruptive Technologies
3.3 Headwinds & Crosswinds – Market Restraints
3.3.1 Regulatory Tides – Compliance Challenges
3.3.2 Economic Frictions – Inflationary Pressures
3.4 Untapped Horizons – Growth Potential & Opportunities
3.5 Strategic Navigation – Industry Frameworks
3.5.1 Market Equilibrium – Porter’s Five Forces
3.5.2 Ecosystem Dynamics – Value Chain Analysis
3.5.3 Macro Forces – PESTEL Breakdown
3.6 Price Trend Analysis
3.6.1 Regional Price Trend
3.6.2 Price Trend by product
CHAPTER NO. 4 : KEY INVESTMENT EPICENTER
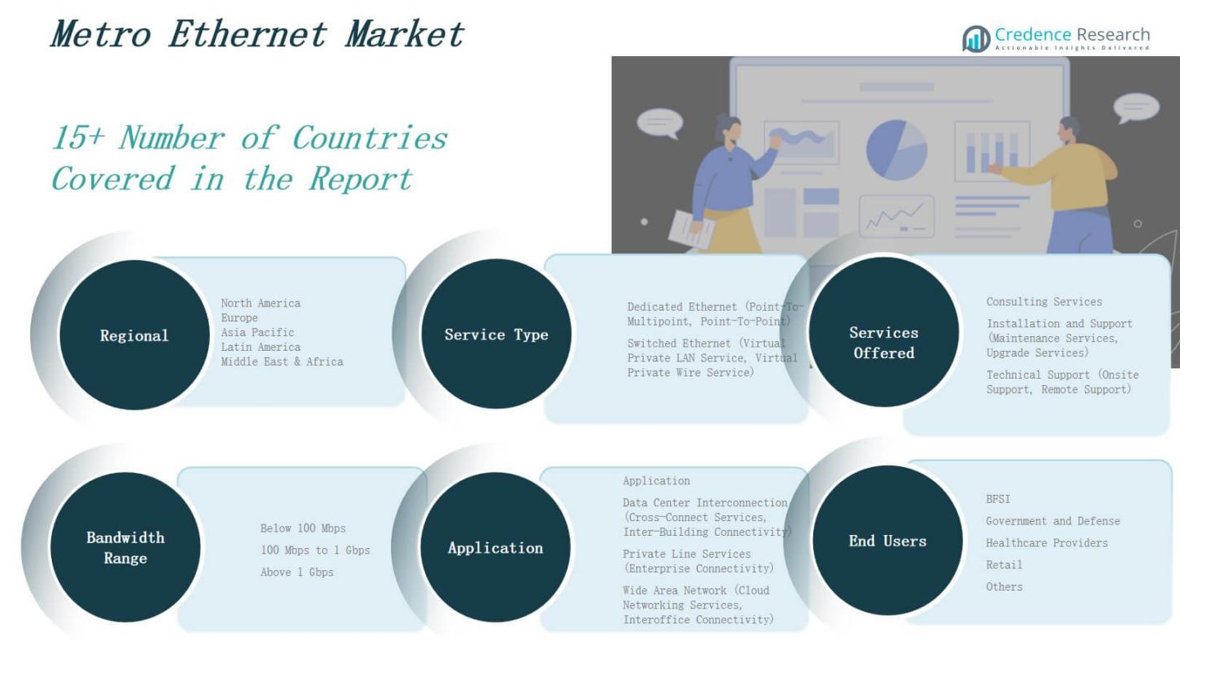
4.1 Regional Goldmines – High-Growth Geographies
4.2 Bandwidth Range Frontiers – Lucrative Bandwidth Range Categories
4.3 Type Sweet Spots – Emerging Demand Segments
CHAPTER NO. 5: REVENUE TRAJECTORY & WEALTH MAPPING
5.1 Momentum Metrics – Forecast & Growth Curves
5.2 Regional Revenue Footprint – Market Share Insights
5.3 Segmental Wealth Flow – Service Type & Type Revenue
CHAPTER NO. 6 : TRADE & COMMERCE ANALYSIS
6.1. Import Analysis by Region
6.1.1. Global Metro Ethernet Market Import Revenue By Region
6.2. Export Analysis by Region
6.2.1. Global Metro Ethernet Market Export Revenue By Region
CHAPTER NO. 7 : COMPETITION ANALYSIS
7.1. Company Market Share Analysis
7.1.1. Global Metro Ethernet Market: Company Market Share
7.2. Global Metro Ethernet Market Company Revenue Market Share
7.3. Strategic Developments
7.3.1. Acquisitions & Mergers
7.3.2. New Bandwidth Range Launch
7.3.3. Regional Expansion
7.4. Competitive Dashboard
7.5. Company Assessment Metrics, 2024
CHAPTER NO. 8 : METRO ETHERNET MARKET – BY SERVICE TYPE SEGMENT ANALYSIS
8.1. Metro Ethernet Market Overview by Service Type Segment
8.1.1. Metro Ethernet Market Revenue Share By Service Type
8.2. Dedicated Ethernet (Point-To-Multipoint, Point-To-Point)
8.3. Switched Ethernet (Virtual Private LAN Service, Virtual Private Wire Service)
CHAPTER NO. 9 : METRO ETHERNET MARKET – BY SERVICES OFFERED SEGMENT ANALYSIS
9.1. Metro Ethernet Market Overview by Services Offered Segment
9.1.1. Metro Ethernet Market Revenue Share By Services Offered
9.2. Consulting Services
9.3. Installation and Support (Maintenance Services, Upgrade Services)
9.4. Technical Support (Onsite Support, Remote Support)
CHAPTER NO. 10 : METRO ETHERNET MARKET – BY BANDWIDTH RANGE SEGMENT ANALYSIS
10.1. Metro Ethernet Market Overview by Bandwidth Range Segment
10.1.1. Metro Ethernet Market Revenue Share By Bandwidth Range
10.2. Below 100 Mbps
10.3. 100 Mbps to 1 Gbps
10.4. Above 1 Gbps
CHAPTER NO. 11 : METRO ETHERNET MARKET – BY APPLICATION SEGMENT ANALYSIS
11.1. Metro Ethernet Market Overview by Application Segment
11.1.1. Metro Ethernet Market Revenue Share By Application
11.2. Data Center Interconnection (Cross-Connect Services, Inter-Building Connectivity)
11.3. Private Line Services (Enterprise Connectivity)
11.4. Wide Area Network (Cloud Networking Services, Interoffice Connectivity)
CHAPTER NO. 12 : METRO ETHERNET MARKET – BY END USERS SEGMENT ANALYSIS
12.1. Metro Ethernet Market Overview by End Users Segment
12.1.1. Metro Ethernet Market Revenue Share By End Users
12.2. BFSI
12.3. Government and Defense
12.4. Healthcare Providers
12.5. Retail
12.6. Others
CHAPTER NO. 13 : METRO ETHERNET MARKET – REGIONAL ANALYSIS
13.1. Metro Ethernet Market Overview by Region Segment
13.1.1. Global Metro Ethernet Market Revenue Share By Region
13.1.2. Regions
13.1.3. Global Metro Ethernet Market Revenue By Region
13.1.4. Service Services Offered
13.1.5. Global Metro Ethernet Market Revenue By Service Services Offered
13.1.6. Services Offered
13.1.7. Global Metro Ethernet Market Revenue By Services Offered
13.1.8. Bandwidth Range
13.1.9. Global Metro Ethernet Market Revenue By Bandwidth Range
13.1.10. Application
13.1.12. Global Metro Ethernet Market Revenue By Application
13.1.13. End Users
13.1.14. Global Metro Ethernet Market Revenue By End Users
CHAPTER NO. 14 : NORTH AMERICA METRO ETHERNET MARKET – COUNTRY ANALYSIS
14.1. North America Metro Ethernet Market Overview by Country Segment
14.1.1. North America Metro Ethernet Market Revenue Share By Region
14.2. North America
14.2.1. North America Metro Ethernet Market Revenue By Country
14.2.2. Service Services Offered
14.2.3. North America Metro Ethernet Market Revenue By Service Services Offered
14.2.4. Services Offered
14.2.5. North America Metro Ethernet Market Revenue By Services Offered
14.2.6. Bandwidth Range
14.2.7. North America Metro Ethernet Market Revenue By Bandwidth Range
14.2.8. Application
14.2.9. North America Metro Ethernet Market Revenue By Application
14.2.10. End Users
14.2.11. North America Metro Ethernet Market Revenue By End Users
14.3. U.S.
14.4. Canada
14.5. Mexico
CHAPTER NO. 15 : EUROPE METRO ETHERNET MARKET – COUNTRY ANALYSIS
15.1. Europe Metro Ethernet Market Overview by Country Segment
15.1.1. Europe Metro Ethernet Market Revenue Share By Region
15.2. Europe
15.2.1. Europe Metro Ethernet Market Revenue By Country
15.2.2. Service Services Offered
15.2.3. Europe Metro Ethernet Market Revenue By Service Services Offered
15.2.4. Services Offered
15.2.5. Europe Metro Ethernet Market Revenue By Services Offered
15.2.6. Bandwidth Range
15.2.7. Europe Metro Ethernet Market Revenue By Bandwidth Range
15.2.8. Application
15.2.9. Europe Metro Ethernet Market Revenue By Application
15.2.10. End Users
15.2.11. Europe Metro Ethernet Market Revenue By End Users
15.3. UK
15.4. France
15.5. Germany
15.6. Italy
15.7. Spain
15.8. Russia
15.9. Rest of Europe
CHAPTER NO. 16 : ASIA PACIFIC METRO ETHERNET MARKET – COUNTRY ANALYSIS
16.1. Asia Pacific Metro Ethernet Market Overview by Country Segment
16.1.1. Asia Pacific Metro Ethernet Market Revenue Share By Region
16.2. Asia Pacific
16.2.1. Asia Pacific Metro Ethernet Market Revenue By Country
16.2.2. Service Services Offered
16.2.3. Asia Pacific Metro Ethernet Market Revenue By Service Services Offered
16.2.4. Services Offered
16.2.5. Asia Pacific Metro Ethernet Market Revenue By Services Offered
16.2.6. Bandwidth Range
16.2.7. Asia Pacific Metro Ethernet Market Revenue By Bandwidth Range
16.2.8. Application
16.2.9. Asia Pacific Metro Ethernet Market Revenue By Application
16.2.10. End Users
16.2.11. Asia Pacific Metro Ethernet Market Revenue By End Users
16.3. China
16.4. Japan
16.5. South Korea
16.6. India
16.7. Australia
16.8. Southeast Asia
16.9. Rest of Asia Pacific
CHAPTER NO. 17 : LATIN AMERICA METRO ETHERNET MARKET – COUNTRY ANALYSIS
17.1. Latin America Metro Ethernet Market Overview by Country Segment
17.1.1. Latin America Metro Ethernet Market Revenue Share By Region
17.2. Latin America
17.2.1. Latin America Metro Ethernet Market Revenue By Country
17.2.2. Service Services Offered
17.2.3. Latin America Metro Ethernet Market Revenue By Service Services Offered
17.2.4. Services Offered
17.2.5. Latin America Metro Ethernet Market Revenue By Services Offered
17.2.6. Bandwidth Range
17.2.7. Latin America Metro Ethernet Market Revenue By Bandwidth Range
17.2.8. Application
17.2.9. Latin America Metro Ethernet Market Revenue By Application
17.2.10. End Users
17.2.11. Latin America Metro Ethernet Market Revenue By End Users
17.3. Brazil
17.4. Argentina
17.5. Rest of Latin America
CHAPTER NO. 18 : MIDDLE EAST METRO ETHERNET MARKET – COUNTRY ANALYSIS
18.1. Middle East Metro Ethernet Market Overview by Country Segment
18.1.1. Middle East Metro Ethernet Market Revenue Share By Region
18.2. Middle East
18.2.1. Middle East Metro Ethernet Market Revenue By Country
18.2.2. Service Services Offered
18.2.3. Middle East Metro Ethernet Market Revenue By Service Services Offered
18.2.4. Services Offered
18.2.5. Middle East Metro Ethernet Market Revenue By Services Offered
18.2.6. Bandwidth Range
18.2.7. Middle East Metro Ethernet Market Revenue By Bandwidth Range
18.2.8. Application
18.2.9. Middle East Metro Ethernet Market Revenue By Application
18.2.10. End Users
18.2.11. Middle East Metro Ethernet Market Revenue By End Users
18.3. GCC Countries
18.4. Israel
18.5. Turkey
18.6. Rest of Middle East
CHAPTER NO. 19 : AFRICA METRO ETHERNET MARKET – COUNTRY ANALYSIS
19.1. Africa Metro Ethernet Market Overview by Country Segment
19.1.1. Africa Metro Ethernet Market Revenue Share By Region
19.2. Africa
19.2.1. Africa Metro Ethernet Market Revenue By Country
19.2.2. Service Services Offered
19.2.3. Africa Metro Ethernet Market Revenue By Service Services Offered
19.2.4. Services Offered
19.2.5. Africa Metro Ethernet Market Revenue By Services Offered
19.2.6. Bandwidth Range
19.2.7. Africa Metro Ethernet Market Revenue By Bandwidth Range
19.2.8. Application
19.2.9. Africa Metro Ethernet Market Revenue By Application
19.2.10. End Users
19.2.11. Africa Metro Ethernet Market Revenue By End Users
19.3. South Africa
19.4. Egypt
19.5. Rest of Africa
CHAPTER NO. 20 : COMPANY PROFILES
20.1. AT&T Inc.
20.1.1. Company Overview
20.1.2. Bandwidth Range Portfolio
20.1.3. Financial Overview
20.1.4. Recent Developments
20.1.5. Growth Strategy
20.1.6. SWOT Analysis
20.2. Lumen Technologies, Inc. (United States)
20.3. Verizon Communications Inc. (United States)
20.4. Comcast Corporation (United States)
20.5. Charter Communications, Inc. (United States)
20.6. Cox Communications, Inc. (United States)
20.7. Vodafone Group Plc (United Kingdom)
20.8. Orange S.A. (France)
20.9. Deutsche Telekom AG (Germany)
20.10. BT Group plc (United Kingdom)
20.11 NTT Communications Corporation (Japan)
20.12 China Telecom Corporation Limited (China)
20.13 China Mobile Limited (China)
20.14 Telstra Corporation Limited (Australia)
20.15 KDDI Corporation (Japan)
20.16 SK Telecom Co., Ltd. (South Korea)
20.17 Rogers Communications Inc. (Canada)
20.18 Bell Canada Enterprises (BCE) Inc. (Canada)
20.19 Telefónica, S.A. (Spain)
20.20 Swisscom AG (Switzerland)