Market Overview
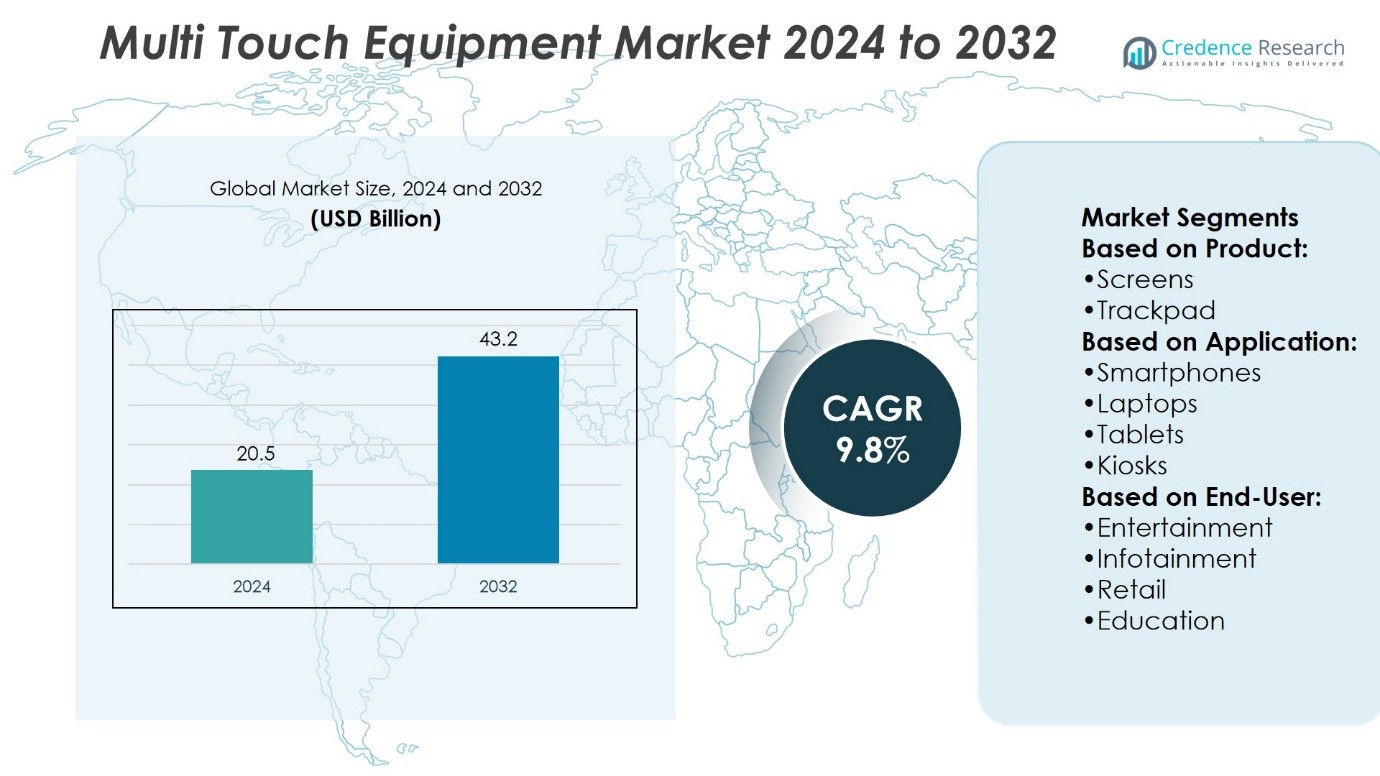
Multi Touch Equipment Market size was valued at USD 20.5 billion in 2024 and is anticipated to reach USD 43.2 billion by 2032, at a CAGR of 9.8% during the forecast period.
| REPORT ATTRIBUTE | DETAILS |
|---|---|
| Historical Period | 2020-2023 |
| Base Year | 2024 |
| Forecast Period | 2025-2032 |
| Multi Touch Equipment Market Size 2024 | USD 20.5 Billion |
| Multi Touch Equipment Market, CAGR | 9.8% |
| Multi Touch Equipment Market Size 2032 | USD 43.2 Billion |
The Multi Touch Equipment Market grows through rising demand for interactive and user-friendly digital solutions across sectors such as education, retail, healthcare, and entertainment. Strong drivers include rapid adoption of smartphones, tablets, and kiosks, along with increasing investments in smart classrooms and collaborative workspaces. Businesses prioritize advanced touch systems to improve customer engagement and operational efficiency, while public infrastructure projects integrate kiosks and large-format displays to deliver digital services. Key trends highlight integration with AI, IoT, and AR/VR, which enhance personalization and real-time interaction. It continues to advance as technology innovations make solutions faster, more precise, and cost-efficient.
The Multi Touch Equipment Market shows strong presence across North America, Europe, Asia Pacific, Latin America, and the Middle East & Africa, with North America leading due to high technological adoption and Asia Pacific emerging as the fastest-growing region. Europe maintains steady demand through digital infrastructure and collaborative solutions, while Latin America and MEA show gradual but increasing uptake. Key players include Microsoft Corporation, Apple Inc., Samsung Electronics Co., Ltd., FlatFrog Laboratories, Touch Innovations, and IntuiLab SA, driving innovation and competition globally.
Market Insights
- Multi Touch Equipment Market size was valued at USD 20.5 billion in 2024 and is expected to reach USD 43.2 billion by 2032, at a CAGR of 9.8%.
- Rising demand for interactive and user-friendly solutions in education, retail, healthcare, and entertainment drives growth.
- Trends focus on integration with AI, IoT, and AR/VR to deliver personalized and real-time experiences.
- Competitive landscape features global leaders and niche innovators advancing hardware, software, and design.
- High implementation costs and maintenance complexity remain key restraints for wider adoption.
- North America leads with strong technological adoption, while Asia Pacific emerges as the fastest-growing region.
- Europe maintains steady demand, and Latin America along with Middle East & Africa show gradual but increasing uptake.
Market Drivers
Growing Demand for Interactive and Immersive User Experiences
The Multi Touch Equipment Market gains traction from rising expectations for interactive digital interfaces. Businesses invest in advanced systems to engage customers through dynamic displays and responsive technology. Retailers deploy touch-enabled kiosks to improve shopping convenience and strengthen buyer interaction. Education sectors adopt multi-touch tables and screens to support collaborative learning. Entertainment venues use large-scale interactive walls to elevate visitor experiences. The technology meets diverse needs, from personalized product exploration to group participation. It creates opportunities for enhanced customer engagement across multiple industries.
- For instance, the COPA-DATA zenon platform is deployed in over 30,000 installations worldwide, demonstrating its industrial viability across corporations.
Rising Adoption Across Corporate and Industrial Applications
The Multi Touch Equipment Market expands as enterprises integrate touch systems into daily operations. Corporations use interactive whiteboards to improve team collaboration and idea sharing. Industrial sectors employ touch-enabled control panels to streamline monitoring and process management. Healthcare facilities adopt touch displays for diagnostics and patient interaction. Financial institutions deploy multi-touch systems to deliver secure, user-friendly banking services. Training and simulation environments also benefit from enhanced accuracy and responsiveness. It supports organizations aiming for operational efficiency and improved decision-making.
- For instance, FlatFrog InGlass™ touch technology, which in 2015 supports multi-touch on screen sizes ranging from 15 to 84 inches, including a 78-inch curved Ultra HD display that was demonstrated at the Consumer Electronics Show (CES) that year.
Technological Advancements and Cost Efficiency Improvements
The Multi Touch Equipment Market benefits from rapid advancements in display and sensor technology. Manufacturers introduce high-resolution screens with faster response rates and greater durability. Thin-film and capacitive touch innovations reduce hardware complexity and enhance design flexibility. Production improvements lower costs, enabling wider adoption across businesses and households. Touch equipment now integrates seamlessly with AI-driven applications, enabling intuitive interaction. Enhanced precision and multi-user functionality further boost system value. It strengthens market appeal by combining affordability with high performance.
Strong Support from Government and Educational Initiatives
The Multi Touch Equipment Market experiences growth due to supportive policies and education investments. Governments promote digital learning through smart classroom projects and e-learning programs. Educational institutions deploy touch-enabled devices to create interactive environments for students. Public service departments adopt kiosks for citizen services and information access. Smart city initiatives integrate multi-touch technology in transportation hubs and public venues. Funding programs help accelerate technology deployment in underdeveloped regions. It reinforces market growth by aligning with digital transformation priorities worldwide.
Market Trends
Increasing Integration of Multi Touch Systems with Artificial Intelligence
The Multi Touch Equipment Market witnesses a trend toward combining touch technology with AI capabilities. Intelligent algorithms analyze user behavior to deliver personalized and adaptive experiences. Retailers deploy AI-driven touch systems that recommend products based on customer interactions. Healthcare providers adopt touch displays that support AI-assisted diagnostics and imaging reviews. Businesses integrate predictive analytics into multi-touch platforms to optimize operations. It enhances the value of touch solutions by enabling smarter and context-aware interactions. The fusion of AI and touch technology shapes future market innovations.
- For instance, South Holland School District 150, an elementary school district south of Chicago serving nearly 900 students, has upgraded its classrooms with Samsung.
Expansion of Multi Touch Applications in Education and Training
The Multi Touch Equipment Market grows with the rising use of interactive solutions in classrooms and training centers. Schools introduce large-format multi-touch screens to encourage group participation and collaborative projects. Universities adopt touch-enabled labs that support research simulations and data visualization. Training institutions implement touch tables to improve skill development and practical exercises. Professional development programs use interactive displays for real-time collaboration. It creates a dynamic learning atmosphere that improves retention and engagement. The trend strengthens the role of multi-touch devices in modern education.
- For instance, Daifuku also deployed its first freezer‑capable AS/RS back in 1973, designed to operate in conditions as cold as –40 °C. A large‑scale system built shortly thereafter included 20 storage and retrieval machines, and is still running today.
Shift Toward Large-Format and Multi-User Touch Displays
The Multi Touch Equipment Market observes demand for large-format displays designed for multiple users. Businesses prefer interactive walls and tables to enhance meetings and group presentations. Event organizers deploy touch-enabled exhibits to increase visitor interaction and information access. Museums and galleries implement multi-user displays to create immersive cultural experiences. Retailers adopt wide-screen touch panels for product demonstrations and brand storytelling. It broadens the range of applications beyond individual use. The shift toward collaborative touch systems reflects a growing preference for shared digital engagement.
Growing Adoption in Public Infrastructure and Smart Cities
The Multi Touch Equipment Market benefits from expanding smart city projects and infrastructure upgrades. Governments deploy interactive kiosks in transportation hubs for ticketing, navigation, and information services. Airports use touch displays to improve passenger flow and self-service check-ins. Libraries and public centers adopt touch-enabled systems to provide digital information access. Smart buildings integrate touch panels for energy management and facility control. It aligns with urban digital transformation strategies worldwide. The adoption of touch technology in public spaces highlights its importance in shaping modern infrastructure.
Market Challenges Analysis
High Implementation Costs and Maintenance Complexities
The Multi Touch Equipment Market faces challenges due to high installation and maintenance expenses. Advanced touch systems require specialized hardware, precision sensors, and durable displays that increase overall costs. Small and medium-sized enterprises often hesitate to adopt these solutions due to budget constraints. Maintenance complexity, including regular calibration and software updates, further discourages widespread adoption. Unexpected repairs or part replacements can disrupt business operations and increase ownership costs. It limits accessibility for cost-sensitive sectors and slows adoption in emerging markets. The high investment burden remains a barrier to faster market penetration.
Technical Limitations and Data Security Concerns
The Multi Touch Equipment Market encounters limitations related to performance and security risks. Multi-touch systems sometimes face accuracy issues when multiple users interact simultaneously. External factors such as dust, moisture, or screen damage reduce responsiveness and reliability. Cybersecurity concerns also affect adoption since touch systems often connect with data-driven applications. Unauthorized access or system vulnerabilities can compromise sensitive information. It forces organizations to invest in advanced security protocols and monitoring tools. Technical and security challenges remain critical hurdles for consistent market growth.
Market Opportunities
Expansion into Emerging Economies and Untapped Sectors
The Multi Touch Equipment Market presents strong opportunities in developing regions with rising digital adoption. Emerging economies invest in smart classrooms, digital banking, and retail automation, creating new demand for touch solutions. Governments support digital transformation projects that integrate interactive displays in public services. Healthcare institutions in these markets seek affordable diagnostic and patient-care technologies. Entertainment venues and malls deploy multi-touch systems to enhance visitor experiences. It enables companies to capture new revenue streams by addressing underserved regions. The expansion into untapped sectors strengthens the long-term growth outlook.
Integration with Advanced Technologies and Custom Applications
The Multi Touch Equipment Market offers potential through integration with technologies like IoT, AR, and VR. Businesses adopt multi-touch devices that connect with IoT ecosystems to enable real-time monitoring and control. Retailers use touch systems combined with AR to create virtual product trials. Educational institutions explore VR-enabled touch platforms for immersive learning experiences. Custom applications tailored to industry-specific needs increase adoption across healthcare, finance, and manufacturing. It allows providers to deliver differentiated solutions that meet precise business requirements. Opportunities for innovation drive continuous advancement of multi-touch equipment across industries.Top of Form
Market Segmentation Analysis:
By Product
The Multi Touch Equipment Market divides into screens and touchpads/trackpads, with screens holding significant demand. Interactive displays are increasingly used in education, retail, and corporate environments for collaboration and engagement. Large-format screens dominate due to their ability to support multi-user functionality and immersive experiences. Touchpads and trackpads remain integral to laptops and portable devices, offering precision and ease of navigation. Compact designs and responsive technology make trackpads suitable for both consumer and enterprise use. It ensures both segments maintain relevance, with screens leading adoption across large-scale applications.
- For instance, KION’s Linde Material Handling brand produces forklifts with a combined payload capacity of 131,000 metric tons per year from its Aschaffenburg site, underlining its production scale.
By Application
The market shows broad application across smartphones, laptops, tablets, kiosks, and multi-touch display walls. Smartphones dominate due to widespread global adoption and continuous innovation in touch-enabled features. Laptops and tablets follow closely, driven by demand for hybrid work, e-learning, and mobility solutions. Kiosks gain traction in retail, airports, and banking for customer engagement and self-service. Multi-touch display walls find growing use in exhibitions, control rooms, and entertainment hubs. It reflects diverse adoption across consumer and commercial applications, creating opportunities for expansion in each sub-segment.
- For instance, at ProMat 2025, Muratec USA showcased a Double Reach Shuttle ASRS capable of processing up to 1,000 cases per hour per aisle, offering high-speed throughput for dense storage environments.
By End-User
The Multi Touch Equipment Market caters to entertainment, infotainment, retail, and education sectors. Entertainment and infotainment leverage touch technology for interactive gaming, media, and event experiences. Retailers adopt multi-touch systems to improve customer interaction, product exploration, and personalized marketing. Education embraces interactive whiteboards, smart screens, and touch-enabled labs to support digital learning. Each sector benefits from enhanced user engagement and streamlined experiences through multi-touch solutions. It highlights the versatility of the technology in addressing distinct industry requirements and improving user satisfaction.
Segments:
Based on Product:
- Screens
- Trackpad
Based on Application:
- Smartphones
- Laptops
- Tablets
- Kiosks
Based on End-User:
- Entertainment
- Infotainment
- Retail
- Education
Based on the Geography:
- North America
- U.S.
- Canada
- Mexico
- Europe
- Germany
- France
- U.K.
- Italy
- Spain
- Rest of Europe
- Asia Pacific
- China
- Japan
- India
- South Korea
- South-east Asia
- Rest of Asia Pacific
- Latin America
- Brazil
- Argentina
- Rest of Latin America
- Middle East & Africa
- GCC Countries
- South Africa
- Rest of the Middle East and Africa
Regional Analysis
North America
North America leads the Multi Touch Equipment Market with about 35% share, supported by strong technological adoption and high consumer spending. The United States remains the largest contributor, driven by demand for smartphones, laptops, interactive kiosks, and digital signage. Education systems widely use smart boards and large-format displays in classrooms, while corporations rely on multi-touch tables and panels for collaborative work. Healthcare organizations adopt interactive screens for patient management and diagnostics, further strengthening demand. It benefits from an advanced digital ecosystem, consistent innovation, and high levels of R&D funding that ensure the region maintains leadership.
Europe
Europe accounts for nearly 20% of the Multi Touch Equipment Market, supported by mature digital infrastructure and strong adoption across public and private sectors. Countries such as Germany, the UK, and France are at the forefront, deploying touch-enabled kiosks in transportation, airports, and retail outlets. Education also plays a vital role, with interactive displays transforming classrooms into digital learning environments. Retailers invest in large-format touch displays to enhance customer experience, while entertainment sectors deploy interactive walls and infotainment systems. It demonstrates steady growth, fueled by design-focused innovation and widespread acceptance of collaborative digital solutions.
Asia Pacific
Asia Pacific secures about 30% of the Multi Touch Equipment Market, making it one of the fastest-growing regions. China leads in manufacturing capacity, producing smartphones, tablets, and large-format displays at competitive costs. India shows rising demand through digital classrooms, smart banking solutions, and retail automation. Japan and South Korea contribute with advanced consumer electronics and gaming technologies. Governments across the region encourage digitalization and smart city initiatives, expanding opportunities for kiosks and public information systems. It gains momentum from urbanization, growing disposable incomes, and large-scale deployment of multi-touch technologies across diverse industries.
Latin America
Latin America holds roughly 10% of the Multi Touch Equipment Market, with Brazil and Mexico as the key contributors. Growth in the region comes from gradual digital transformation across education, banking, and retail. Schools begin adopting smart boards and touch-enabled learning platforms, while banks install self-service kiosks to improve customer interaction. Retailers deploy interactive displays in malls and urban shopping areas to strengthen engagement. Infrastructure gaps and budget restrictions limit expansion in smaller markets, yet demand continues to rise in metropolitan centers. It represents a region with strong long-term potential for affordable and scalable touch solutions.
Middle East & Africa
The Middle East & Africa region contributes about 5% of the Multi Touch Equipment Market, with adoption led by wealthy Gulf countries such as the UAE and Saudi Arabia. Smart city projects, digital government services, and airport modernization drive high demand for interactive kiosks and large-format displays. Tourism and hospitality industries integrate touch technology to improve guest experiences in hotels, museums, and cultural attractions. Africa shows slower progress but increasing uptake in banking and education. It remains a developing market with uneven adoption, yet infrastructure investments create growth opportunities over time.
Key Player Analysis
- Microsoft Corporation
- Touch Innovations
- FlatFrog Laboratories
- COPA-DATA GmbH
- IntuiLab SA
- Apple, Inc
- Touch Corporation
- Samsung Electronics Co., Ltd
- MultiTraction
- Perceptive Pixel
Competitive Analysis
The Multi Touch Equipment Market players include Microsoft Corporation, Apple, Inc, Samsung Electronics Co., Ltd, Touch Innovations, FlatFrog Laboratories, Perceptive Pixel, COPA-DATA GmbH, IntuiLab SA, MultiTraction, and Touch Corporation. The Multi Touch Equipment Market shows intense competition driven by constant innovation in hardware and software solutions. Companies focus on integrating advanced touch technologies into smartphones, tablets, kiosks, and large-format displays to meet rising demand across industries. The market emphasizes user-friendly design, high responsiveness, and multi-user functionality to attract both consumer and enterprise buyers. Firms differentiate through product innovation, cost efficiency, and seamless integration with digital ecosystems such as IoT, AI, and AR/VR. Strategic partnerships, investments in R&D, and expansion into emerging economies further strengthen market positions. It remains a space where both global leaders and specialized providers compete to deliver interactive, scalable, and industry-specific solutions.
Recent Developments
- In August 2025, Samsung Electronics emphasizes multi-touch capabilities in its Galaxy Book 4 Edge and other flagship devices, incorporating Microsoft Copilot+ platform integration. This offers improved interactivity and multi-user touch responses, supported by optical bonding and nanocoating enhancements that improve durability and responsiveness.
- In February 2024, Bobcat, one of the prominent material handling products manufacturers, unveiled its expanded product portfolio after its decision to have a strategic integration of Doosan Industrial Vehicle (DIV). The company has rebranded all the equipment.
- In January 2024, CLARK Europe GmbH developed green electric forklifts which will pave the way for sustainable logistics. The company also announced its latest invention of a series of electric counterbalance trucks and warehouse technology.
- In May 2023, Toyota Material Handling (TMH) announced the launch of its three electric forklifts. The incorporation of these models in existing portfolio of company will project the company as one of the leaders in terms of provider of material handling solutions and products.
Report Coverage
The research report offers an in-depth analysis based on Product, Application, End-User and Geography. It details leading market players, providing an overview of their business, product offerings, investments, revenue streams, and key applications. Additionally, the report includes insights into the competitive environment, SWOT analysis, current market trends, as well as the primary drivers and constraints. Furthermore, it discusses various factors that have driven market expansion in recent years. The report also explores market dynamics, regulatory scenarios, and technological advancements that are shaping the industry. It assesses the impact of external factors and global economic changes on market growth. Lastly, it provides strategic recommendations for new entrants and established companies to navigate the complexities of the market.
Future Outlook
- The market will expand with rising adoption of interactive displays across industries.
- Demand for large-format multi-user systems will grow in education and corporate sectors.
- Integration with AI and IoT will enhance personalized and data-driven user experiences.
- Retail and entertainment industries will increase use of touch-enabled kiosks and walls.
- Smart city projects will drive deployment of interactive public information systems.
- Advances in sensor technology will improve accuracy, durability, and response speed.
- Affordable solutions will open opportunities in developing economies and small enterprises.
- Healthcare will adopt more touch systems for diagnostics and patient engagement.
- Cloud-based platforms will strengthen collaboration through multi-touch environments.
- Sustainability goals will encourage eco-friendly materials and energy-efficient designs.

Request a Free Sample
Fill in your details and we'll send you a free sample report.
- Sample data tables & charts
- Research methodology
Need a Custom Version of This Report?
Tailor the scope, geography, or segments to your exact requirements.
- Custom geography or segment scope
- Direct access to our analyst team
Frequently Asked Questions
What is the current market size for Multi Touch Equipment Market, and what is its projected size in 2032?
At what Compound Annual Growth Rate is the Multi Touch Equipment Market projected to grow between 2025 and 2032?
Which Multi Touch Equipment Market segment held the largest share in 2024?
What are the primary factors fueling the growth of the Multi Touch Equipment Market?
Who are the leading companies in the Multi Touch Equipment Market?
Which region commanded the largest share of the Multi Touch Equipment Market in 2024?
Table of Content
Chapter 1. Report Introduction
- 1.1 Report Description & Purpose
- 1.1.1 Report Title & Market Definition
- 1.1.2 Unique Selling Propositions (USP) & Key Differentiators
- 1.1.3 Value Proposition for Stakeholders
- 1.2 Research Objectives
- 1.2.1 Market Sizing Objectives (Volume & Revenue) (Volume Where Applicable)
- 1.2.2 Segmentation Objectives
- 1.2.3 Competitive Intelligence Objectives
- 1.2.4 Forecast & Scenario Objectives
- 1.3 Report Scope
- 1.3.1 Multi-Touch Equipment Scope – Segments & Subsegments Covered
- 1.3.2 Geographic Scope – Regions & Countries Covered
- 1.3.3 Historical Period, Base Year & Forecast Period (2024; forecast to 2032)
- 1.3.4 Inclusions & Exclusions
- 1.4 Industry Classification & Applicable Codes
- 1.5 Currency, Measurement Units & Valuation Basis
- 1.6 Target Stakeholders
- 1.7 Limitations & Assumptions
Chapter 2. Executive Summary
- 2.1 Global Multi-Touch Equipment Market Snapshot
- 2.1.1 Market Size – Historical (2024) & Forecast (2024-2032) (2024: USD 20.5 billion → 2032: USD 43.2 billion)
- 2.1.2 Volume & Revenue – Global Totals (Volume Where Applicable)
- 2.1.3 Key Market Highlights – Top Five Facts
- 2.2 Multi-Touch Equipment Market Segmentation Snapshot
- 2.2.1 Market Split by Region – 2024 vs. 2032
- 2.3 Competitive Snapshot
- 2.3.1 Top 10 Players by Revenue Share – 2024
- 2.3.2 Top 10 Players by Volume Share – 2024 (Volume Where Applicable)
- 2.3.3 Recent Strategic Developments (18-Month Summary)
- 2.4 Key Investment Highlights & Strategic Conclusions
Chapter 3. Multi-Touch Equipment Market Dynamics & Industry Analysis
- 3.1 Market Overview & Context
- 3.1.1 Multi-Touch Equipment Market Position in the Broader Industry Value Chain
- 3.1.2 Demand Structure & Purchasing Dynamics
- 3.1.3 Market Maturity & Development Stage by Region
- 3.2 Multi-Touch Equipment Market Drivers
- 3.3 Multi-Touch Equipment Market Restraints & Challenges
- 3.4 Multi-Touch Equipment Market Opportunities
- 3.5 Porter's Five Forces Analysis
- 3.5.1 Threat of New Entrants
- 3.5.2 Bargaining Power of Suppliers
- 3.5.3 Bargaining Power of Buyers
- 3.5.4 Threat of Substitutes
- 3.5.5 Competitive Rivalry – Intensity Assessment
- 3.6 Multi-Touch Equipment Value Chain Analysis
- 3.6.1 Upstream – Key Inputs, Resources & Suppliers
- 3.6.1.1 Key Input/Resource 1
- 3.6.1.2 Key Input/Resource 2
- 3.6.1.3 Key Input/Resource 3
- 3.6.2 Midstream – Core Operations & Value Creation
- 3.6.2.1 Operating Model & Process Overview
- 3.6.2.2 Key Operating Locations & Capabilities by Company
- 3.6.3 Downstream – Market Channels & End Users
- 3.6.3.1 Direct Sales & Customer Engagement Channels
- 3.6.3.2 Indirect Sales, Intermediaries & Partner Channels
- 3.6.4 Value Chain Profitability Analysis
- 3.6.1 Upstream – Key Inputs, Resources & Suppliers
- 3.7 PESTEL Analysis
- 3.7.1 Political Factors
- 3.7.2 Economic Factors
- 3.7.3 Social Factors
- 3.7.4 Technological Factors
- 3.7.5 Environmental Factors
- 3.7.6 Legal Factors
- 3.8 Multi-Touch Equipment Supply Chain Analysis
- 3.8.1 Critical Input & Resource Availability Risk Assessment
- 3.8.2 Supplier & Operational Concentration Risk (Geographic Exposure)
- 3.8.3 Supply & Service Disruption Impact Analysis
- 3.9 Regulatory & Policy Landscape
Note: The regulatory and policy landscape section covers regulations based on their applicability to the market, Multi-Touch Equipment category, geography, and scope of the study. Only regulatory frameworks with a material impact on operations, compliance, trade, sustainability, or market access are analyzed in detail.
Chapter 4. Key Investment Pockets & Opportunity Analysis
- 4.1 Multi-Touch Equipment Market Attractiveness Analysis
- 4.1.1 By Region – Investment Attractiveness Matrix (Market Size × CAGR)
- 4.2 Absolute Revenue Growth Opportunity
- 4.2.1 By Region – Absolute Revenue Growth Through 2032
- 4.3 Incremental Demand Opportunity
- 4.3.1 By Region – Incremental Demand Through 2032
- 4.3.2 Segment – Incremental Demand
- 4.4 Emerging Submarket Opportunity Deep Dive (Subject to Applicability)
- 4.5 Priority Market Opportunity Scorecards
- 4.5.1 United States
- 4.5.2 Europe
- 4.5.3 Asia
- 4.5.4 Middle East & Africa
Note: Priority market opportunity scorecards reflect the geographic scope and strategic relevance of the study. Listed markets are indicative and may be adapted to the industry.
Chapter 5. Multi-Touch Equipment Cross-Border Trade & Market Access Analysis
- 5.1 International Trade & Cross-Border Activity Overview
- 5.1.1 Global Export Value by Country (2024)
- 5.1.2 Global Export Volume by Country (2024) (Volume Where Applicable)
- 5.1.3 Global Import Value by Country (2024)
- 5.1.4 Global Import Volume by Country (2024) (Volume Where Applicable)
- 5.1.5 Net Trade Balance by Country (2024)
- 5.2 Export Analysis – Segment
- 5.2.1 Category 1 (Applicable Classification Code)
- 5.2.2 Category 2 (Applicable Classification Code)
- 5.2.3 Category 3 (Applicable Classification Code)
- 5.2.4 Category 4 (Applicable Classification Code)
- 5.2.5 Category 5 (Applicable Classification Code)
- 5.3 Import Analysis – Segment
- 5.3.1 Category 1 (Applicable Classification Code)
- 5.3.2 Category 2 (Applicable Classification Code)
- 5.3.3 Category 3 (Applicable Classification Code)
- 5.3.4 Category 4 (Applicable Classification Code)
- 5.3.5 Category 5 (Applicable Classification Code)
- 5.4 Cross-Border Pricing & Transaction Benchmarks
- 5.4.1 Export Pricing – Segment & Country
- 5.4.2 Import Pricing – Segment & Source Country
- 5.4.3 Price Trends (2024)
- 5.5 Key Cross-Border Trade & Delivery Routes
- 5.5.1 Cross-Border Trade/Delivery Route 1
- 5.5.2 Cross-Border Trade/Delivery Route 2
- 5.5.3 Cross-Border Trade/Delivery Route 3
- 5.5.4 Cross-Border Trade/Delivery Route 4
- 5.5.5 Cross-Border Trade/Delivery Route 5
- 5.6 Trade Policy & Market Access Impact Assessment
- 5.6.1 Tariff & Non-Tariff Barriers
- 5.6.2 Regional Trade & Economic Integration Frameworks
- 5.6.3 Bilateral & Multilateral Trade Agreements
- 5.6.4 Cross-Border Operating, Licensing & Localization Requirements
Note: This chapter applies where cross-border trade or delivery is relevant to Multi-Touch Equipment. Goods, services, and digital offerings are assessed using applicable classifications and transaction measures. Import-export volumes, trade balances, and route analyses are included only where meaningful to the market.
Chapter 6. Competitive Landscape & Company Benchmarking
- 6.1 Multi-Touch Equipment Market Concentration & Structure
- 6.1.1 Herfindahl-Hirschman Index (HHI) – the historical period vs. 2024
- 6.1.2 Leading, Mid-Sized & Emerging Player Structure
- 6.1.3 Global, Regional & Local Player Dynamics
- 6.2 Multi-Touch Equipment Market Share Analysis – 2024
- 6.2.1 Global Revenue Share by Company
- 6.2.2 Global Volume Share by Company (Volume Where Applicable)
- 6.2.3 Regional Revenue Share
- 6.2.4 Market Share Evolution (the historical period vs. 2024)
- 6.2.5 Company Market Share by Key Segment
- 6.2.6 Company Market Share by Customer Group
- 6.3 Operating Scale, Capacity & Infrastructure Analysis
- 6.3.1 Global Operating Scale & Supply Capacity
- 6.3.2 Resource Utilization & Operating Efficiency
- 6.3.3 Output, Service Delivery & Activity Metrics
- 6.3.4 Operating Footprint & Infrastructure Map
- 6.3.5 Planned Operational & Capacity Expansion
- 6.4 Multi-Touch Equipment Competitive Benchmarking Matrix
- 6.4.1 Revenue, Growth, Profitability & Operating Metric Comparison
- 6.4.2 Channel Revenue Mix
- 6.4.3 Geographic Revenue Exposure
- 6.4.4 R&D Intensity
- 6.4.5 Sustainability Maturity
- 6.5 Strategic Developments in Multi-Touch Equipment (Last 24 Months)
- 6.5.1 Mergers, Acquisitions & Divestments
- 6.5.2 New Products, Services & Solutions in Multi-Touch Equipment
- 6.5.3 Operational & Infrastructure Expansions
- 6.5.4 Strategic Alliances, Joint Ventures & Partnerships
- 6.5.5 Distribution Expansion & Market Entry
- 6.5.6 Sustainability & ESG Initiatives
- 6.6 Competitive Strategy Mapping
- 6.6.1 Leader, Challenger, Follower & Niche Classification
- 6.6.2 Pricing Strategy Comparison
- 6.6.3 Channel Strategy Matrix
Note: Strategic developments are included based on their materiality and the availability of reliable information.
Chapter 7. Global Multi-Touch Equipment Market – By Sales & Delivery Channel
- 7.1 Segment Overview
- 7.1.1 Volume & Revenue Split by Channel (2024 & 2032) (Volume Where Applicable)
- 7.1.2 Channel Mix Evolution (2024-2032)
Chapter 8. Regional Market Analysis – Global Overview
- 8.1 Global Regional Overview
- 8.1.1 Regional Volume Share (Volume Where Applicable)
- 8.1.2 Regional Revenue Share
- 8.1.3 Regional Volume by Region (Volume Where Applicable)
- 8.1.4 Regional Revenue by Region
- 8.1.5 Regional Forecast Through 2032
- 8.2 Cross-Regional Segment Analysis
- 8.2.1 By Sales & Delivery Channel
- 8.2.2 By Competitive Positioning & Price Tier
Chapter 9. North America Multi-Touch Equipment Market
- 9.1 United States
- 9.2 Canada
- 9.3 Mexico
Chapter 10. Europe Multi-Touch Equipment Market
- 10.1 Germany
- 10.2 France
- 10.3 Italy
- 10.4 United Kingdom
- 10.5 Spain
- 10.6 Poland
- 10.7 Russia
- 10.8 Netherlands
- 10.9 Belgium
- 10.10 Sweden
- 10.11 Denmark
- 10.12 Norway
- 10.13 Rest of Europe
Chapter 11. Asia Pacific Multi-Touch Equipment Market
- 11.1 China
- 11.2 India
- 11.3 Japan
- 11.4 South Korea
- 11.5 Thailand
- 11.6 Indonesia
- 11.7 Vietnam
- 11.8 Malaysia
- 11.9 Australia
- 11.10 Rest of Asia Pacific
Chapter 12. Latin America Multi-Touch Equipment Market
- 12.1 Brazil
- 12.2 Argentina
- 12.3 Colombia
- 12.4 Chile
- 12.5 Rest of Latin America
Chapter 13. Middle East Multi-Touch Equipment Market
- 13.1 Saudi Arabia
- 13.2 United Arab Emirates
- 13.3 Turkey
- 13.4 Israel
- 13.5 Iran
- 13.6 Rest of the Middle East
Chapter 14. Africa Multi-Touch Equipment Market
- 14.1 South Africa
- 14.2 Egypt
- 14.3 Nigeria
- 14.4 Morocco
- 14.5 Rest of Africa
Chapter 15. Multi-Touch Equipment Company Profiles
- 15.1 [Company 01]
- 15.1.1 Company Overview
- 15.1.2 Key Management Personnel
- 15.1.3 Products & Services Portfolio
- 15.1.4 Financial Performance
- 15.1.5 Key Market Focus & Geographic Presence
- 15.1.6 Recent Developments & Strategic Initiatives
Note: The company profile list is preliminary and may change based on research findings, market developments, data availability, and client requirements.
Chapter 16. Appendices
- Appendix A – List of Abbreviations & Acronyms
- Appendix B – Industry Classification Code Reference – Full Series
- Appendix C – Supply, Output & Operating Capacity Data Tables
- Appendix D – End-Use & Demand Base Tables
- Appendix E – Demand, Adoption & Usage Assumptions
- Appendix F – Pricing & Revenue Metric Reference Tables
- Appendix G – Company Operations & Infrastructure Database
- Appendix H – Cross-Border Trade & Activity Data Tables (Where Applicable)
- Appendix I – Regulatory Summary Tables
- Appendix J – Primary Research Participant List (Anonymized)
- Appendix K – Primary Research Questionnaire Framework
- Appendix L – Data Sources & Bibliography
- Appendix M – Market Size Divergence & Source Comparison
Chapter 17. Research Methodology
- 17.1 Research Framework & Philosophy
- 17.2 Secondary Research – Sources, Hierarchy & Data Extraction
- 17.3 Data Modeling – Bottom-Up & Top-Down Market Sizing
- 17.4 Primary Research – Stakeholder Framework, LOI & Sample Sizes
- 17.5 Forecast Methodology – Regression, Scenario & Sensitivity Analysis
- 17.6 Quality Control – Four-Layer Validation Framework
- 17.7 Limitations & Standard Assumptions
- 17.8 Disclaimer