
Market Overview
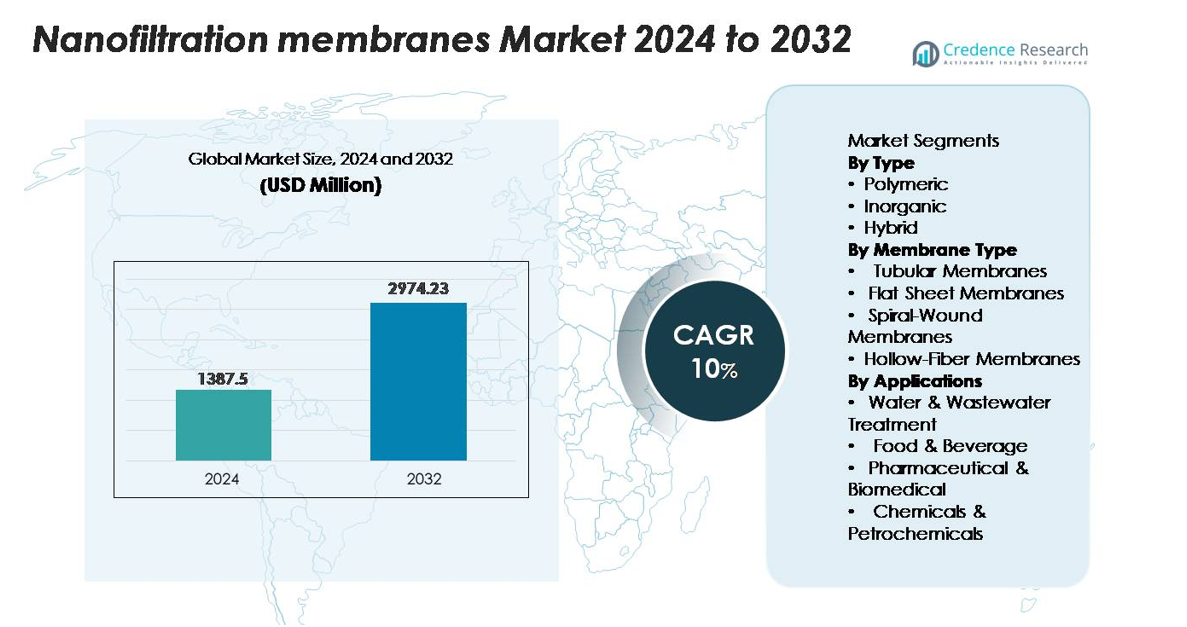
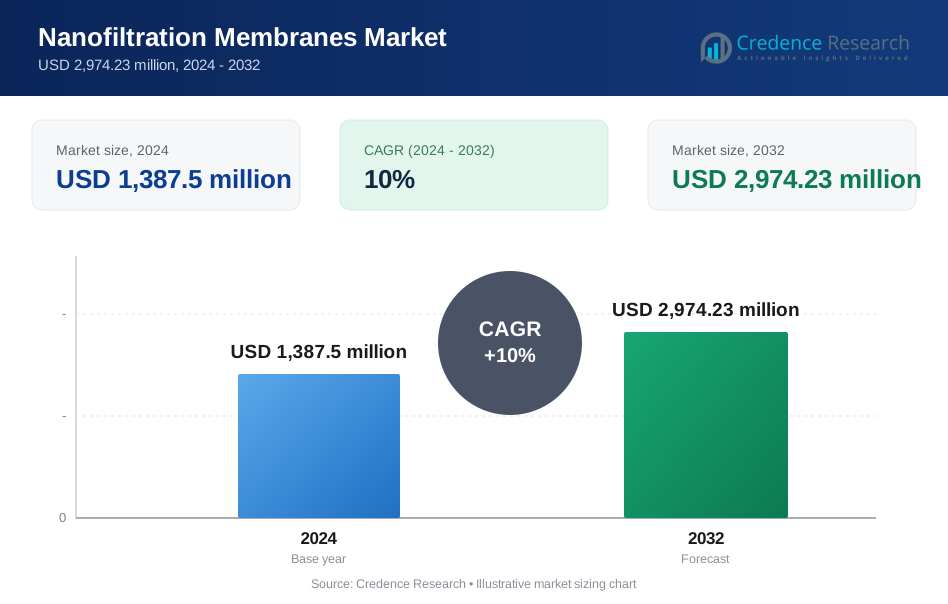
The global nanofiltration membranes market was valued at USD 1,387.5 million in 2024 and is projected to rise to USD 2,974.23 million by 2032, reflecting a robust CAGR of 10% over the forecast period.
| REPORT ATTRIBUTE | DETAILS |
|---|---|
| Historical Period | 2020-2023 |
| Base Year | 2024 |
| Forecast Period | 2025-2032 |
| Nanofiltration Membranes Market Size 2024 | USD 1,387.5 million |
| Nanofiltration Membranes Market, CAGR | 10% |
| Nanofiltration Membranes Market Size 2032 | USD 2,974.23 million |
The nanofiltration membranes market is shaped by a strong group of international manufacturers, including Toray Industries Inc., Koch Separation Solutions, Synder Filtration Inc., Paul Rauschert GmbH & Co. KG, NX Filtration BV, SPX FLOW Inc., Osmotech Membranes Pvt. Ltd., Alfa Laval AB, GEA Group, Applied Membranes Inc., Nitto Denko Corporation, and DuPont de Nemours Inc. These companies compete through advancements in thin-film composites, anti-fouling surface engineering, and high-efficiency spiral-wound designs. Regionally, North America leads the market with a 32–34% share, supported by stringent water-quality regulations and rapid adoption of PFAS treatment technologies. Europe follows with 28–30%, driven by strong sustainability policies and industrial reuse initiatives.
Market Insights
- The global nanofiltration membranes market reached USD 1,387.5 million in 2024 and is projected to hit USD 2,974.23 million by 2032 at a 10% CAGR, driven by rising adoption in municipal and industrial water treatment.
- Strong market drivers include expanding investments in wastewater reuse, PFAS and micro-pollutant removal, and high-purity processing in food, pharma, and specialty chemicals, reinforcing the dominance of polymeric membranes, which hold the largest segment share.
- Key trends include rapid penetration of low-pressure, energy-efficient thin-film composite membranes and growing deployment of spiral-wound modules, which command the leading membrane-type share due to their high packing density and operational efficiency.
- Competitive activity intensifies as major players such as Toray, DuPont, Koch Separation Solutions, and Nitto Denko advance anti-fouling chemistries and durable high-flux designs; however, membrane fouling, scaling, and high capital costs continue to restrain broader adoption.
- Regionally, North America leads with 32–34% share, followed by Europe at 28–30%, while Asia-Pacific holds 26–28% and grows fastest, supporting strong demand across water treatment, pharmaceuticals, food processing, and chemical recovery applications.
Market Segmentation Analysis:
By Type:
Polymeric membranes dominate the nanofiltration membranes market due to their balanced performance, cost-efficiency, and adaptability across municipal and industrial water treatment systems. Their high chemical resistance and ease of fabrication make them the preferred choice for large-scale desalination pre-treatment and organic contaminant removal. In contrast, inorganic membranes such as ceramic variants serve high-temperature and corrosive environments, while hybrid membranes combine polymer flexibility with inorganic durability. Polymeric membranes continue to lead the segment because they support scalable manufacturing, lower installation costs, and broad compatibility with diverse operating conditions.
- For example, Suez (Veolia) offers NF-series polymeric nanofiltration membranes that provide typical divalent ion rejection above 97% under standard test conditions. These elements operate at pressures around 9 bar, making them effective for municipal softening and selective removal of hardness ions.
By Membrane Type:
Spiral-wound membranes represent the dominant configuration, driven by their compact design, high packing density, and suitability for continuous operations in water, beverage, and industrial filtration systems. Their favorable flux-to-footprint ratio makes them the preferred option for municipal utilities and industrial plants aiming to maximize throughput. Tubular membranes cater to high-solids or viscous feed streams, while flat-sheet formats suit small-scale or batch systems requiring easy cleaning. Hollow-fiber membranes gain traction in niche biomedical and ultrapure applications, but spiral-wound units maintain the largest share due to superior efficiency and proven commercial adoption.
- For instance, the Toray TNF-series (or TMNF-series for sanitary models) spiral-wound nanofiltration membrane provides a nominal salt rejection of 20-40% at standard test conditions (2,000 mg/L NaCl, 5.2 bar pressure), enabling high retention of large organic molecules like sugars and proteins.
By Applications:
Water and wastewater treatment remains the leading application segment, supported by rising demand for selective removal of hardness ions, micro-contaminants, and emerging pollutants in municipal and industrial settings. Utilities favor nanofiltration for its lower energy consumption relative to reverse osmosis, making it suitable for softening, color removal, and reuse schemes. The food and beverage sector deploys nanofiltration for ingredient concentration and purification, while pharmaceutical and biomedical users capitalize on precise molecular cut-offs for API refinement. Chemical and petrochemical industries apply nanofiltration for solvent recovery, but water treatment retains dominance due to widespread regulatory and sustainability-driven adoption.
Key Growth Drivers
Expanding Global Investments in Water and Wastewater Treatment
Rapid urbanization, industrial growth, and escalating water scarcity are accelerating global investments in advanced water and wastewater treatment technologies. Governments and municipal agencies are prioritizing nanofiltration (NF) systems to meet tightening regulations on contaminant removal, particularly for hardness ions, organic micro-pollutants, PFAS, and trace pharmaceuticals. Compared with reverse osmosis, NF offers lower operating pressures and improved permeate recovery, making it economically attractive for utilities upgrading legacy systems. Industrial sectors such as textiles, chemicals, power generation, and mining are deploying NF to support zero-liquid-discharge (ZLD) and resource-recovery initiatives. Growing pressure to reuse treated wastewater in agriculture, landscaping, and industrial cooling further supports adoption. As countries strengthen enforcement around effluent discharge and potable water quality, nanofiltration platforms benefit from a strong pipeline of infrastructure modernization projects, driving long-term market expansion.
- For example, NX Filtration announced a repeat order in July 2025 to expand the hollow-fiber nanofiltration system at SAPAL’s municipal reuse plant in León, Mexico, doubling total capacity to 34 million liters per day. The facility uses HFNF modules for indirect potable reuse, making it the world’s largest hollow-fiber nanofiltration installation.
Rising Demand for High-Purity Processing in Food, Pharma, and Specialty Chemicals
Nanofiltration membranes are gaining rapid acceptance across food and beverage, pharmaceutical, and specialty chemical manufacturing due to their ability to deliver precise molecular separation while maintaining product integrity. In food processing, NF supports lactose concentration, sugar fractionation, color reduction, and ingredient clarification with reduced thermal stress. Pharmaceutical and biomedical manufacturers adopt NF to refine active ingredients, remove pyrogens, and produce sterile intermediates without introducing formulation-altering contaminants. Specialty chemicals producers use NF to recover solvents, purify monomers, and reduce process waste. These industries increasingly require consistent purity levels aligned with global compliance frameworks such as FDA, EMA, and EFSA standards. As manufacturers shift toward gentler, membrane-based purification instead of energy-intensive evaporation or distillation, nanofiltration’s technical advantages selective rejection ranges, low energy consumption, and scalability position it as a preferred solution.
- For example, DuPont’s FilmTec™ NF245 nanofiltration membrane is widely applied in food and ingredient processing, with a documented MWCO of about 300 Da and permeate flux in the 24–28 L/m²·h range at roughly 4.8 bar. This NF element supports selective removal of color bodies and divalent ions while maintaining the functional properties of sensitive product streams.
Technological Advancements Enhancing Membrane Performance and Durability
Continuous advancements in membrane chemistry, module design, and surface engineering significantly strengthen nanofiltration adoption across high-demand sectors. Innovations such as thin-film composite (TFC) membranes with improved crosslinking density, anti-fouling polymer coatings, and enhanced charge selectivity deliver higher permeability and extended operating lifespans. Manufacturers are developing membranes with improved resistance to oxidants, solvents, and high pH ranges, expanding suitability for harsh industrial processing environments. Spiral-wound designs with optimized feed-spacer geometry improve flow distribution and reduce pressure drops, lowering operating costs. Emerging hybrid polymer-ceramic structures offer superior mechanical stability while retaining cost advantages. These developments enable users to operate systems at lower energy loads, minimize fouling cycles, and improve overall recovery rates. As R&D investments accelerate globally, particularly in advanced materials and surface modification technologies, nanofiltration becomes more competitive and versatile across diverse applications.
Key Trends & Opportunities
Growing Adoption of Energy-Efficient and Low-Pressure Membrane Systems
A major trend shaping the nanofiltration industry is the shift toward energy-efficient, low-pressure membrane operations that minimize long-term operating expenses. Utility providers and industrial facilities increasingly favor systems capable of achieving high flux at reduced pressures, lowering energy consumption by 15–30% compared with older membrane platforms. New membrane chemistries with higher surface hydrophilicity reduce fouling rates, enabling longer cleaning cycles and improved continuous runtime. This creates opportunities for membrane suppliers specializing in high-performance thin-film composites and low-pressure spiral-wound modules. Additionally, the increased integration of renewable-powered water treatment plants supports membrane systems optimized for variable energy profiles. As sustainability metrics become embedded into procurement frameworks, suppliers offering eco-efficient designs such as high-recovery NF units or modules designed for circular replacement programs stand to gain a competitive advantage.
- For example, Nitto Hydranautics’ ESNA1-LF2 low-pressure nanofiltration membrane is rated to produce about 9,500 gpd permeate at ~4.8 bar (70 psi) under standard test conditions. The element offers a nominal MWCO near 200 Da, supporting energy-efficient removal of divalent ions and small organics in softening and reuse applications.
Increasing Application in Emerging Contaminant Removal and Resource Recovery
Nanofiltration is becoming the preferred technology for treating emerging contaminants such as PFAS compounds, endocrine-disrupting chemicals, pharmaceutical residues, and microplastics that conventional treatment systems fail to address effectively. Stricter regulatory action across North America, Europe, and parts of Asia drives utilities to adopt NF solutions for advanced purification. This trend extends to industrial sectors, where chemical and metal recovery has become a major operational priority. NF systems offer selective ion separation, allowing facilities to reclaim sodium chloride, caustic solutions, dyes, and metal salts. Growing interest in circular water use and waste minimization further strengthens NF opportunities in manufacturing hubs. As industries pursue cost savings through resource reclamation, nanofiltration suppliers positioned to deliver integrated recovery systems will gain significant traction.
- For instance, DuPont’s FilmTec™ NF90 membrane has been independently validated to achieve >99% removal of PFOS and PFOA, while operating at a feed pressure of 10.3 bar and maintaining permeate flows of 24–27 L/m²·h, enabling utilities to simultaneously remove micropollutants and reclaim high-purity permeate for reuse.
Key Challenges
Membrane Fouling, Scaling, and Performance Degradation
One of the most persistent challenges limiting nanofiltration performance is membrane fouling and scaling caused by organics, colloids, biofilms, and inorganic precipitates. These issues reduce flux rates, increase operational pressures, and shorten membrane lifespan, leading to higher replacement and maintenance costs. Industries processing high-solids or chemically aggressive feed streams face more frequent downtime for cleaning cycles. While anti-fouling coatings and improved feed-spacer geometries help mitigate these effects, fouling remains a critical operational constraint requiring pretreatment systems that add complexity and cost. The burden of ongoing maintenance creates adoption barriers, particularly for small municipal facilities or mid-sized industrial plants with limited technical expertise.
High Capital Costs and Skilled Workforce Requirements
Despite long-term operational savings, nanofiltration systems demand substantial upfront investment, particularly for large industrial installations requiring high-capacity pumps, automation systems, and multi-stage pretreatment lines. Smaller utilities and resource-constrained industries often struggle with capex allocation, slowing adoption. Additionally, NF systems require skilled operators capable of managing membrane diagnostics, process optimization, fouling analysis, and cleaning protocols. Workforce shortages in water technology sectors compound this challenge. As plants integrate digital monitoring and advanced membrane modules, the need for trained personnel increases. These financial and operational constraints remain significant obstacles to widespread NF deployment, especially in developing markets.
Regional Analysis
North America
North America holds approximately 32–34% of the global nanofiltration membranes market, driven by strong investment in advanced water treatment, PFAS remediation, and industrial reuse applications. The U.S. leads regional adoption as utilities upgrade infrastructure to meet tightening EPA regulations on emerging contaminants. The pharmaceutical, food, and specialty chemical sectors further accelerate uptake due to stringent purity standards. The region benefits from mature membrane manufacturing, growing pilot-scale deployments in desalination, and rising replacement demand across municipal facilities. Continued regulatory pressure on wastewater discharge and potable water quality sustains North America’s dominant share.
Europe
Europe accounts for nearly 28–30% of the market, supported by strict environmental policies, industrial effluent regulations, and advanced adoption of membrane-based purification technologies. Countries such as Germany, the Netherlands, and the Nordics lead demand due to strong sustainability compliance and circular water management initiatives. The region’s chemical, textile, and food-processing industries increasingly rely on nanofiltration for selective ion removal and resource recovery. The EU’s continued enforcement of Water Framework Directive targets and growing investment in nutrient removal and micropollutant treatment further reinforce market expansion. Europe’s established R&D landscape strengthens product innovation and technological uptake.
Asia-Pacific
Asia-Pacific represents the fastest-growing market, capturing 26–28% of global share, propelled by rapid industrialization, severe water stress, and rising municipal treatment needs. China and India lead regional adoption as governments expand wastewater recycling, industrial ZLD mandates, and urban water infrastructure modernization. Southeast Asian countries increasingly deploy nanofiltration for beverage processing, pharmaceutical production, and micro-contaminant treatment. Growing manufacturing capacity and declining membrane production costs strengthen regional competitiveness. As industrial clusters enforce stricter discharge standards and desalination expands across coastal economies, Asia-Pacific is expected to continue gaining global share over the forecast period.
Latin America
Latin America holds around 6–8% of the nanofiltration membranes market, supported by expanding municipal water treatment programs, mining-sector water recovery demands, and rising industrial filtration needs. Chile, Brazil, and Mexico lead adoption, particularly in mining, food processing, and chemical manufacturing where selective purification and brine recovery are priorities. Increasing water scarcity in key regions encourages investment in membrane-based softening and reuse systems. While infrastructure limitations slow broad-scale adoption, ongoing public–private partnerships and regulatory modernization are expected to improve penetration. Gradual replacement of aging filtration systems supports modest long-term regional growth.
Middle East & Africa
The Middle East & Africa region accounts for 4–5% of global market share, with desalination-driven economies such as Saudi Arabia, the UAE, and Qatar driving adoption. Nanofiltration supports brackish water treatment, industrial reuse, and pre-treatment for large-scale RO desalination plants. Increasing investment in petrochemical and power-sector wastewater management also strengthens demand. In Africa, adoption remains limited but rising urbanization and infrastructure upgrades in South Africa, Kenya, and Morocco are creating new opportunities. The region’s reliance on advanced water purification technologies and government-led desalination initiatives continues to position nanofiltration as a strategic treatment solution.
Market Segmentations:
By Type
- Polymeric
- Inorganic
- Hybrid
By Membrane Type
- Tubular Membranes
- Flat Sheet Membranes
- Spiral-Wound Membranes
- Hollow-Fiber Membranes
By Applications
- Water & Wastewater Treatment
- Food & Beverage
- Pharmaceutical & Biomedical
- Chemicals & Petrochemicals
By Geography
- North America
- U.S.
- Canada
- Mexico
- Europe
- Germany
- France
- U.K.
- Italy
- Spain
- Rest of Europe
- Asia Pacific
- China
- Japan
- India
- South Korea
- South-east Asia
- Rest of Asia Pacific
- Latin America
- Brazil
- Argentina
- Rest of Latin America
- Middle East & Africa
- GCC Countries
- South Africa
- Rest of the Middle East and Africa
Competitive Landscape
The nanofiltration membranes market features a moderately consolidated competitive landscape, with global leaders and specialized regional manufacturers advancing materials innovation, membrane durability, and selective separation performance. Key players focus on expanding thin-film composite technologies, anti-fouling surface chemistries, and high-flux spiral-wound modules to strengthen product portfolios across municipal and industrial treatment segments. Companies invest heavily in R&D to improve chemical resistance, charge selectivity, and operational efficiency, enabling broader adoption in pharmaceutical, food, and chemical processing. Strategic activities including capacity expansions, technology licensing, and partnerships with water treatment integrators—are shaping competitive positioning. Leading manufacturers also emphasize sustainability by developing low-pressure membranes and high-recovery designs aligned with global water-reuse priorities. Growing competition from Asia-based suppliers, offering cost-competitive membranes with improving quality benchmarks, further intensifies market dynamics. As regulatory standards tighten globally, suppliers that deliver long-life, energy-efficient, and application-specific nanofiltration solutions are expected to maintain a strong foothold in the evolving market.
Key Player Analysis
- Toray Industries Inc.
- Koch Separation Solutions (Koch Engineered Solutions)
- Synder Filtration Inc.
- Paul Rauschert GmbH & Co. KG
- NX Filtration BV
- SPX FLOW Inc.
- Osmotech Membranes Pvt. Ltd.
Recent Developments
- In October 2025, the company Koch Separation Solutions (now rebranded under Kovalus Separation Solutions) disclosed its transformation and continued focus on advanced membrane-based water and wastewater treatment technologies, including nanofiltration modules.
- In July 2025, the company NX Filtration BV received a repeat order to double the capacity of the world’s largest hollow-fiber nanofiltration (HFNF) plant in Mexico (total plant capacity now 34 million liters per day) using its HFNF modules.
Report Coverage
The research report offers an in-depth analysis based on Type, Membrane type, Applications and Geography. It details leading market players, providing an overview of their business, product offerings, investments, revenue streams, and key applications. Additionally, the report includes insights into the competitive environment, SWOT analysis, current market trends, as well as the primary drivers and constraints. Furthermore, it discusses various factors that have driven market expansion in recent years. The report also explores market dynamics, regulatory scenarios, and technological advancements that are shaping the industry. It assesses the impact of external factors and global economic changes on market growth. Lastly, it provides strategic recommendations for new entrants and established companies to navigate the complexities of the market.
Future Outlook
- Nanofiltration membranes will gain wider adoption as utilities accelerate investment in advanced treatment for emerging contaminants such as PFAS, pharmaceuticals, and micro-pollutants.
- Industrial facilities will increasingly deploy nanofiltration for solvent recovery, ion separation, and zero-liquid-discharge systems to meet stricter environmental compliance.
- Polymeric thin-film composite membranes will continue to dominate due to improvements in permeability, durability, and anti-fouling characteristics.
- Hybrid and ceramic-enhanced nanofiltration designs will expand in high-temperature and chemically aggressive industrial environments.
- Energy-efficient, low-pressure nanofiltration systems will see strong demand as plants focus on reducing operational costs and improving water-recovery rates.
- Digital monitoring, predictive maintenance, and automation will become integral to optimizing membrane performance and extending system life cycles.
- Rapid urbanization will drive municipal adoption, especially in regions facing water scarcity and aging infrastructure.
- Food, beverage, and pharmaceutical industries will increase reliance on nanofiltration for high-purity processing and ingredient refinement.
- Asia-Pacific will emerge as the fastest-growing region due to expanding industrialization and water-reuse mandates.
- Competitive differentiation will shift toward sustainable membrane materials, recyclable modules, and circular maintenance programs aligned with global sustainability goals.
Request a Free Sample
Fill in your details and we'll send you a free sample report.
- Sample data tables & charts
- Research methodology
Need a Custom Version of This Report?
Tailor the scope, geography, or segments to your exact requirements.
- Custom geography or segment scope
- Direct access to our analyst team
Frequently Asked Questions
What is the current market size for the nanofiltration membranes market, and what is its projected size in 2032?
At what Compound Annual Growth Rate is the nanofiltration membranes market projected to grow between 2024 and 2032?
Which is the leading region of the market for nanofiltration membranes?
What are the key drivers for the growth of the nanofiltration membranes market?
Which is the major segment in the nanofiltration membranes market by application?
Who are the leading companies in the nanofiltration membranes market?
Table of Content
Chapter 1. Report Introduction
- 1.1 Report Description & Purpose
- 1.1.1 Report Title & Market Definition
- 1.1.2 Unique Selling Propositions (USP) & Key Differentiators
- 1.1.3 Value Proposition for Stakeholders
- 1.2 Research Objectives
- 1.2.1 Market Sizing Objectives (Volume & Revenue)
- 1.2.2 Segmentation Objectives
- 1.2.3 Competitive Intelligence Objectives
- 1.2.4 Forecast & Scenario Objectives
- 1.3 Report Scope
- 1.3.1 Nanofiltration Membranes Scope – Types & Subtypes Covered
- 1.3.2 Geographic Scope – Regions & Countries Covered
- 1.3.3 Historical Period, Base Year & Forecast Period (2024; forecast to 2032)
- 1.3.4 Inclusions & Exclusions
- 1.4 HS Code & Classification Framework
- 1.5 Currency, Units & Pricing Basis
- 1.6 Target Stakeholders
- 1.7 Limitations & Assumptions
Chapter 2. Executive Summary
- 2.1 Global Nanofiltration Membranes Market Snapshot
- 2.1.1 Market Size – Historical (2024) & Forecast (2024-2032) (2024: USD 1,387.5 million → 2032: USD 2,974.23 million)
- 2.1.2 Volume & Revenue – Global Totals
- 2.1.3 Key Market Highlights – Top Five Facts
- 2.2 Nanofiltration Membranes Market Segmentation Snapshot
- 2.2.1 Market Split by Region – 2024 vs. 2032
- 2.3 Competitive Snapshot
- 2.3.1 Top 10 Players by Revenue Share – 2024
- 2.3.2 Top 10 Players by Volume Share – 2024
- 2.3.3 Recent Strategic Developments (18-Month Summary)
- 2.4 Key Investment Highlights & Strategic Conclusions
Chapter 3. Nanofiltration Membranes Market Dynamics & Industry Analysis
- 3.1 Market Overview & Context
- 3.1.1 Nanofiltration Membranes Market Position in the Broader Automotive Value Chain
- 3.1.2 OEM vs. Replacement Market Dynamics
- 3.1.3 Market Maturity & Development Stage by Region
- 3.2 Nanofiltration Membranes Market Drivers
- 3.3 Nanofiltration Membranes Market Restraints & Challenges
- 3.4 Nanofiltration Membranes Market Opportunities
- 3.5 Porter's Five Forces Analysis
- 3.5.1 Threat of New Entrants
- 3.5.2 Bargaining Power of Suppliers
- 3.5.3 Bargaining Power of Buyers
- 3.5.4 Threat of Substitutes
- 3.5.5 Competitive Rivalry – Intensity Assessment
- 3.6 Nanofiltration Membranes Value Chain Analysis
- 3.6.1 Upstream – Raw Material/Input Suppliers
- 3.6.1.1 Raw Material/Input 1
- 3.6.1.2 Raw Material/Input 2
- 3.6.1.3 Raw Material/Input 3
- 3.6.2 Midstream – Production/Manufacturing/Service Delivery
- 3.6.2.1 Production/Process Overview
- 3.6.2.2 Key Facility Locations & Capacity by Manufacturer
- 3.6.3 Downstream – Distribution & End Consumer
- 3.6.3.1 Primary Channel – B2B/OEM
- 3.6.3.2 Secondary Channels – Dealer, Retail, Online, Direct
- 3.6.4 Value Chain Profitability Analysis
- 3.6.1 Upstream – Raw Material/Input Suppliers
- 3.7 PESTEL Analysis
- 3.7.1 Political Factors
- 3.7.2 Economic Factors
- 3.7.3 Social Factors
- 3.7.4 Technological Factors
- 3.7.5 Environmental Factors
- 3.7.6 Legal Factors
- 3.8 Nanofiltration Membranes Supply Chain Analysis
- 3.8.1 Raw Material/Input Supply Risk Assessment
- 3.8.2 Manufacturing Concentration Risk (Geographic Exposure)
- 3.8.3 Trade Disruption Impact Analysis
- 3.9 Regulatory & Policy Landscape
Note: The regulatory and policy landscape section covers regulations based on their applicability to the market, Nanofiltration Membranes category, geography, and scope of the study. Only regulatory frameworks with a material impact on operations, compliance, trade, sustainability, or market access are analyzed in detail.
Chapter 4. Key Investment Pockets & Opportunity Analysis
- 4.1 Nanofiltration Membranes Market Attractiveness Analysis
- 4.1.1 By Region – Investment Attractiveness Matrix (Volume × CAGR)
- 4.2 Absolute Revenue Growth Opportunity
- 4.2.1 By Region – Absolute USD Growth Through 2032
- 4.3 Incremental Volume Opportunity
- 4.3.1 By Region – Incremental Volume Through 2032
- 4.3.2 Segment – Incremental Volume
- 4.4 Emerging Submarket Opportunity Deep Dive (Subject to Applicability)
- 4.5 Emerging Market Opportunity Scorecards
- 4.5.1 United States
- 4.5.2 Europe
- 4.5.3 Asia
- 4.5.4 Middle East & Africa
Note: Emerging Market Opportunity Scorecards will be included based on relevance and strategic importance. Regions listed are indicative and may vary depending on data availability and market dynamics.
Chapter 5. Nanofiltration Membranes Import-Export Analysis & Trade Flows
- 5.1 Global Trade Overview
- 5.1.1 Global Export Value by Country (2024)
- 5.1.2 Global Export Volume by Country (2024)
- 5.1.3 Global Import Value by Country (2024)
- 5.1.4 Global Import Volume by Country (2024)
- 5.1.5 Net Trade Balance by Country (2024)
- 5.2 Export Analysis – Segment
- 5.2.1 Type 1 (HS Code)
- 5.2.2 Type 2 (HS Code)
- 5.2.3 Type 3 (HS Code)
- 5.2.4 Type 4 (HS Code)
- 5.2.5 Type 5 (HS Code)
- 5.3 Import Analysis – Segment
- 5.3.1 Type 1 (HS Code)
- 5.3.2 Type 2 (HS Code)
- 5.3.3 Type 3 (HS Code)
- 5.3.4 Type 4 (HS Code)
- 5.3.5 Type 5 (HS Code)
- 5.4 Average Unit Trade Prices
- 5.4.1 Average Export Price – Segment & Country
- 5.4.2 Average Import Price – Segment & Source Country
- 5.4.3 Price Trends (2024)
- 5.5 Key Trade Route Analysis
- 5.5.1 Trade Route 1
- 5.5.2 Trade Route 2
- 5.5.3 Trade Route 3
- 5.5.4 Trade Route 4
- 5.5.5 Trade Route 5
- 5.6 Trade Policy Impact Assessment
- 5.6.1 US Anti-Dumping & Section 301 Tariffs
- 5.6.2 EU Customs Union Impact
- 5.6.3 Major Free Trade Agreements
- 5.6.4 USMCA Rules of Origin
Note: Trade policy analysis will be included only where relevant to the Nanofiltration Membranes market.
Chapter 6. Competitive Landscape & Company Benchmarking
- 6.1 Nanofiltration Membranes Market Concentration & Structure
- 6.1.1 Herfindahl-Hirschman Index (HHI) – vs. 2024
- 6.1.2 Tier 1, Tier 2 & Tier 3 Market Structure
- 6.1.3 Global, Regional & Local Player Dynamics
- 6.2 Nanofiltration Membranes Market Share Analysis – 2024
- 6.2.1 Global Revenue Share by Company
- 6.2.2 Global Volume Share by Company
- 6.2.3 Regional Revenue Share
- 6.2.4 Market Share Evolution ( vs. 2024)
- 6.2.5 OEM Segment Share by Company
- 6.2.6 Replacement Segment Share by Company
- 6.3 Production/Delivery Capacity & Facility Analysis
- 6.3.1 Global Installed Capacity
- 6.3.2 Capacity Utilization Rates
- 6.3.3 Production/Output Volume
- 6.3.4 Facility Locations & Capacity Map
- 6.3.5 Planned Capacity Additions
- 6.4 Nanofiltration Membranes Competitive Benchmarking Matrix
- 6.4.1 Revenue, Volume, CAGR & Profitability Comparison
- 6.4.2 Channel Revenue Mix
- 6.4.3 Geographic Revenue Exposure
- 6.4.4 R&D Intensity
- 6.4.5 Sustainability Maturity
- 6.5 Strategic Developments in Nanofiltration Membranes (Last 24 Months)
- 6.5.1 Mergers, Acquisitions & Divestments
- 6.5.2 New Nanofiltration Membranes Launches
- 6.5.3 Facility Expansions
- 6.5.4 Strategic Alliances, Joint Ventures & Partnerships
- 6.5.5 Distribution Expansion & Market Entry
- 6.5.6 Sustainability & ESG Initiatives
- 6.6 Competitive Strategy Mapping
- 6.6.1 Leader, Challenger, Follower & Niche Classification
- 6.6.2 Pricing Strategy Comparison
- 6.6.3 Channel Strategy Matrix
Note: Strategic developments are included based on their materiality and the availability of reliable information.
Chapter 7. Global Nanofiltration Membranes Market – By Distribution Channel
- 7.1 Segment Overview
- 7.1.1 Volume & Revenue Split by Channel (2024 & 2032)
- 7.1.2 Channel Mix Evolution (2024-2032)
Chapter 8. Regional Market Analysis – Global Overview
- 8.1 Global Regional Overview
- 8.1.1 Regional Volume Share
- 8.1.2 Regional Revenue Share
- 8.1.3 Regional Volume by Region
- 8.1.4 Regional Revenue by Region
- 8.1.5 Regional Forecast Through 2032
- 8.2 Cross-Regional Segment Analysis
- 8.2.1 By Distribution Channel
- 8.2.2 By Brand/Price Tier
Chapter 9. North America Nanofiltration Membranes Market
- 9.1 United States
- 9.2 Canada
- 9.3 Mexico
Chapter 10. Europe Nanofiltration Membranes Market
- 10.1 Germany
- 10.2 France
- 10.3 Italy
- 10.4 United Kingdom
- 10.5 Spain
- 10.6 Poland
- 10.7 Russia
- 10.8 Netherlands
- 10.9 Belgium
- 10.10 Sweden
- 10.11 Denmark
- 10.12 Norway
- 10.13 Rest of Europe
Chapter 11. Asia Pacific Nanofiltration Membranes Market
- 11.1 China
- 11.2 India
- 11.3 Japan
- 11.4 South Korea
- 11.5 Thailand
- 11.6 Indonesia
- 11.7 Vietnam
- 11.8 Malaysia
- 11.9 Australia
- 11.10 Rest of Asia Pacific
Chapter 12. Latin America Nanofiltration Membranes Market
- 12.1 Brazil
- 12.2 Argentina
- 12.3 Colombia
- 12.4 Chile
- 12.5 Rest of Latin America
Chapter 13. Middle East Nanofiltration Membranes Market
- 13.1 Saudi Arabia
- 13.2 United Arab Emirates
- 13.3 Turkey
- 13.4 Israel
- 13.5 Iran
- 13.6 Rest of the Middle East
Chapter 14. Africa Nanofiltration Membranes Market
- 14.1 South Africa
- 14.2 Egypt
- 14.3 Nigeria
- 14.4 Morocco
- 14.5 Rest of Africa
Chapter 15. Nanofiltration Membranes Company Profiles
- 15.1 [Company 01]
- 15.1.1 Company Overview
- 15.1.2 Key Management Personnel
- 15.1.3 Products & Services Portfolio
- 15.1.4 Financial Performance
- 15.1.5 Key Market Focus & Geographic Presence
- 15.1.6 Recent Developments & Strategic Initiatives
Note: The company profile list is preliminary and may change based on research findings, market developments, data availability, and client requirements.
Chapter 16. Appendices
- Appendix A – List of Abbreviations & Acronyms
- Appendix B – Industry Classification Code Reference – Full Series
- Appendix C – Production & Capacity Data Tables
- Appendix D – End-Use & Demand Base Tables
- Appendix E – Consumption & Replacement Rate Assumptions
- Appendix F – ASP Reference Tables
- Appendix G – Manufacturing & Facility Database
- Appendix H – Import-Export Data Tables
- Appendix I – Regulatory Summary Tables
- Appendix J – Primary Research Participant List (Anonymized)
- Appendix K – Primary Research Questionnaire Framework
- Appendix L – Data Sources & Bibliography
- Appendix M – Market Size Divergence & Source Comparison
Chapter 17. Research Methodology
- 17.1 Research Framework & Philosophy
- 17.2 Secondary Research – Sources, Hierarchy & Data Extraction
- 17.3 Data Modeling – Bottom-Up & Top-Down Market Sizing
- 17.4 Primary Research – Stakeholder Framework, LOI & Sample Sizes
- 17.5 Forecast Methodology – Regression, Scenario & Sensitivity Analysis
- 17.6 Quality Control – Four-Layer Validation Framework
- 17.7 Limitations & Standard Assumptions
- 17.8 Disclaimer
