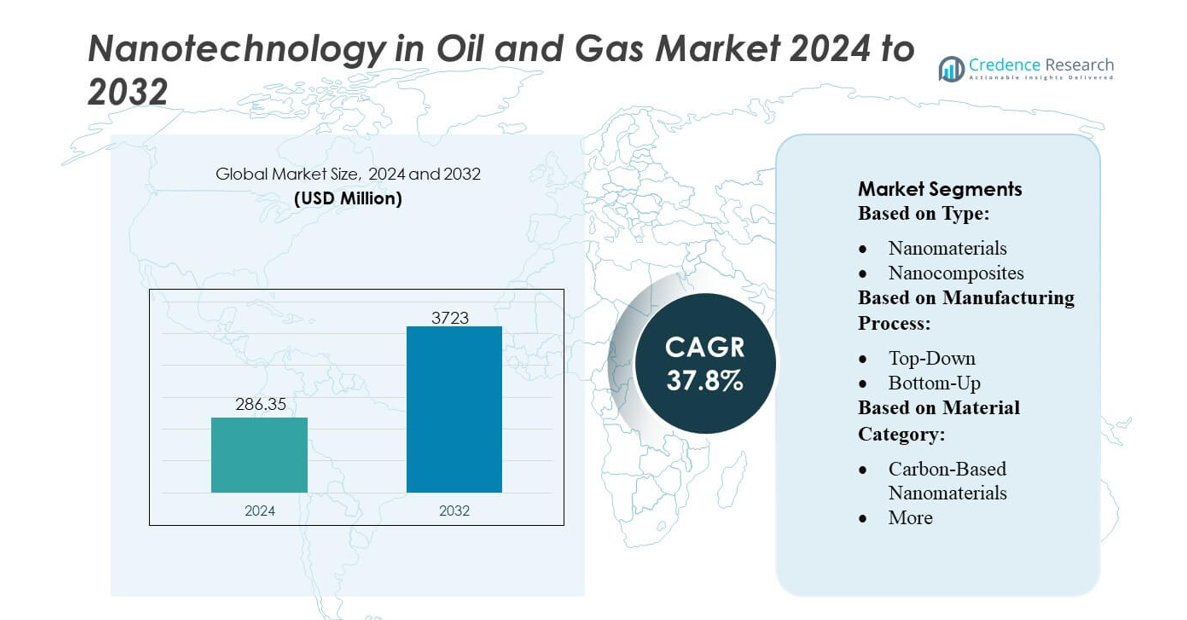
Home » Energy » Nanotechnology in Oil and Gas Market

Nanotechnology in Oil and Gas Market By Enhanced Oil Recovery (EOR) (Nanofluids for Reservoir Stimulation, Smart Nanogels) By Drilling Fluids And Wellbore Stability (Nanoparticle-Based Drilling Fluids, Nanocomposites for Wellbore Reinforcement) By Corrosion Prevention And Control (Nanocoatings, Corrosion Inhibitors) By Downhole Sensing And Monitoring (Nanomaterial-Based Sensors, Smart Nanomaterials) By Water Treatment And Desalination (Nanofiltration and Nanomembranes, Nanoparticle-Based Adsorbents) By Nanotechnology In Cementing (Nanoparticles in Cement Formulations, Strength and Durability Enhancement) By Reservoir Imaging And Characterization (Nanoparticle Tracers, Nanoparticle-Enhanced Imaging Techniques) By Environmental Management (Nanoremediation, Nanoparticle-Based Sorbents) By Exploration And Seismic Imaging (Nanoparticles in Seismic Surveys, Improved Subsurface Imaging) By Nanobots And Nanorobots (Nanorobotic Applications) By Catalysts For Upgrading Processes (Nanocatalysts) By Region – Growth, Future Prospects & Competitive Analysis, 2022 – 2030

Price: $4699

Published: | Report ID: 31292 | Report Format : PDF

Market Insights

  • The global demand for nanotechnology in oil and gas was valued at USD 150.8 million in 2022 and is expected to reach USD 1983.50 million in 2030, growing at a CAGR of 38.00% between 2023 and 2030.
  • Nanofluids for reservoir stimulation are expected to hold a significant market share. Smart nanogels, on the other hand, are expected to grow at a strong CAGR.
  • The leading drilling fluids and wellbore stability segment is nanoparticle-based drilling fluids.
  • The CAGR for nanocoatings is expected to be the highest during the projection period.
  • During the forecast time frame, the nanomaterial-based sensors category will likely have the highest CAGR.
  • Nanofiltration and nanomembranes are estimated to have the greatest CAGR during the forecast period.
  • The nanoparticles in the cement formulations segment will likely have the highest CAGR during the prediction period.
  • The largest reservoir imaging and characterization category is nanoparticle tracers.
  • The nanoremediation segment’s CAGR will be the top during the projected period.
  • For seismic imaging and exploration, nanoparticles in seismic surveys are the best.
  • The nanorobotic applications category is predicted to have the highest compound annual growth rate (CAGR) over the projected period.
  • The segment with the highest CAGR during the forecast period will probably be nanocatalysts.
  • Asia Pacific dominates nanotechnology in the oil and gas market.
  • Europe is predicted to be the second-largest region in the nanotechnology in the oil and gas market.
  • North America is anticipated to grow fastest in the market for nanotechnology in oil and gas.
  • The market for nanotechnology in oil and gas is expanding due to its potential to improve the processes of exploration, production, refining, and environmental management.
  • Nanotechnology in the oil and gas market has much potential because of lightweight nanocomposite materials, corrosion-resistant nanocoatings, effective combustion practices, and better-quality sensing technologies.

Nanotechnology in Oil and Gas Market

Design Element 2

Access crucial information at unmatched prices!

Request your free sample report today & start making informed decisions powered by Credence Research!

Download Free Sample

CTA Design Element 3

Executive Summary

Market Definition

Nanotechnology in the oil and gas market describes the use of nanoscale materials, devices, and processes to enhance and improve various aspects of exploration, production, refining, and distribution. Nanotechnology is the manipulation and utilization of materials at the nanoscale, which typically ranges from 1 to 100 nanometers, to achieve specific properties and functionalities. Nanotechnology, in the oil and gas industry context, seeks to address challenges and optimize processes through the development and application of nanomaterials and nanodevices.

Market Overview

The market for nanotechnology in the oil and gas industry has been developing gradually in recent years, and it is projected to grow at a compound annual growth rate (CAGR) of 38.00% between 2023 and 2030. The market was estimated to be worth USD 150.8 million in 2022, and it is anticipated to be worth USD 1983.50 million in 2030.

The oil and gas industry utilizes enhanced oil recovery, or EOR, techniques, and technologies to extract more crude oil from reservoirs than primary and secondary recovery methods can. Nanotechnology is essential for EOR because it provides innovative ways to improve the efficiency of oil recovery procedures. The rheological properties of the fluids in the reservoir can be altered by creating nanofluids, which are liquids containing nanoparticles. This modification aids in fluid mobility control by improving oil displacement efficiency and overall recovery.

The interfacial tension between oil and injected fluids can be greatly reduced by designing and developing surfactants at the nanoscale, which is made possible by nanotechnology. Improved oil displacement and recovery result from lower interfacial tension, which makes it easier for oil droplets to separate from the rock surface. The reservoir can have nanoscale sensors to track several parameters, including temperature, pressure, and fluid flow. EOR techniques can be made more effective by precisely controlling and optimizing injection strategies based on real-time data from these sensors. These factors support the development of nanotechnology in the oil and gas market.

Segmentation By Enhanced Oil Recovery (EOR)

  • By enhanced oil recovery (EOR), nanofluids for reservoir stimulation are the market leader. An innovative use of nanotechnology in the oil and gas sector is the use of nanofluids for reservoir stimulation. The goal of reservoir stimulation is to improve hydrocarbon recovery from underground reservoirs. Reservoir stimulation methods can be made more effective by utilizing the special qualities of nanofluids, which are suspensions of nanoscale particles in a base fluid.
  • The smart nanogels category will exhibit a sizable CAGR during the projected period. Smart nanogels are hydrogel particles at the nanoscale that undergo reversible structural changes in response to external stimuli, such as temperature, pH, or chemical composition changes. These smart nanogels, which have special qualities and functions, have become a promising new application of nanotechnology in the oil and gas sector.

Segmentation By Drilling Fluids And Wellbore Stability

  • The main drilling fluids and wellbore stability category is nanoparticle-based drilling fluids. Drilling fluids can benefit from adding nanoparticles, such as those derived from graphene or clay minerals, to improve cooling and lubrication characteristics. This leads to less wear and friction on the drill bit, which increases drilling efficiency and prolongs the drill bit’s life.
  • The nanocomposites for the wellbore reinforcement category will likely register a significant CAGR during forecasting. Materials used to construct wellbores can have their mechanical strength increased by nanocomposites. The composite that results from adding nanoparticles to the matrix material is more resilient to the increased pressures and stresses of drilling operations. This lowers the possibility of structural failures and improves wellbore integrity.

Segmentation By Corrosion Prevention And Control

  • The category for nanocoatings is anticipated to experience the highest CAGR during the projection period. Corrosion prevention is one of the main uses of nanocoatings in the oil and gas sector. By creating a barrier, nanocoatings can shield surfaces from corrosive substances and keep the underlying materials safe.
  • Other corrosion prevention and controls, such as corrosion inhibitors, also contribute to the demand for nanotechnology in oil and gas.

Segmentation By Downhole Sensing And Monitoring

  • During the projection period, the nanomaterial-based sensors category will likely have the highest CAGR. Nanomaterials are incredibly sensitive to changes in their chemical and physical properties. Examples of these materials are graphene, carbon nanotubes, and nanoparticles. Nanomaterial-based sensors are perfect for monitoring crucial parameters in oil and gas operations because of their increased sensitivity, which enables them to detect even the smallest changes in temperature, pressure, and composition.
  • Other downhole sensing and monitoring, such as smart nanomaterials, also contribute to the demand for nanotechnology in oil and gas.

Segmentation By Water Treatment And Desalination

  • Nanofiltration and nanomembranes will be expected to have the foremost CAGR during the prediction period. Operating on a scale between ultrafiltration and reverse osmosis, nanofiltration is a membrane-based separation technique. It uses membranes with nanoscale pores, usually between 1 and 10 nanometers in diameter, to selectively permit the passage of some ions and molecules while rejecting others.
  • Other water treatment and desalination, such as nanoparticle-based adsorbents, also contribute to the demand for nanotechnology in oil and gas.

Segmentation By Nanotechnology In Cementing

  • Throughout the forecast duration, the category for nanoparticles in cement formulations is anticipated to have the greatest CAGR. Cement’s mechanical qualities can be improved by adding nanoparticles, such as carbon nanotubes or silica particles. Increased cement durability, tensile strength, and compressive strength are some examples of this.
  • Other nanotechnology in cementing, such as strength and durability enhancement, also contribute to the demand for nanotechnology in oil and gas.

Segmentation By Reservoir Imaging And Characterization

  • The highest CAGR is anticipated for nanoparticle tracers throughout estimation. Subterranean reservoir fluid movement is monitored with nanoparticle tracers. Operators can pinpoint production zones, learn more about fluid flow patterns, and improve reservoir management techniques by injecting tracers.
  • Nanoparticle-enhanced imaging techniques also contribute to the demand for nanotechnology in oil and gas.

Segmentation By Environmental Management

  • Over the estimation period, nanoremediation is expected to have the greatest CAGR. Nanomaterials, such as nanoparticles and nanoscale sorbents, can improve oil spill cleanup. Because of their large surface areas and ability to encapsulate or adsorb oil, these materials can help remove oil from near water surfaces.
  • Nanoparticle-based sorbents also contribute to the demand for nanotechnology in oil and gas.

Segmentation By Exploration And Seismic Imaging

  • Over the estimated timeframe, the nanoparticles in seismic surveys are anticipated to experience the highest CAGR. Seismic sensors can have their sensitivity and resolution improved by nanoparticles, especially those with special magnetic or acoustic properties. This advancement makes it possible to identify and characterize subsurface structures with greater accuracy, including the identification of smaller reservoirs or delicate geological features that could be missed with conventional techniques.
  • Other exploration and seismic imaging, such as improved subsurface imaging, also contribute to the demand for nanotechnology in oil and gas.

Segmentation By Nanobots And Nanorobots

  • Throughout the forecast period, the nanorobotic applications category will probably have the highest compound annual growth rate. The utilization of nanoscale robots, also known as nanobots, for a variety of tasks in exploration, production, and maintenance procedures is known as nanorobotic applications in the oil and gas sector.

Segmentation By Catalysts For Upgrading Processes

  • Nanocatalysts are predicted to have the most prominent CAGR during the estimation period. In refining processes like hydrocracking and catalytic cracking, where they help transform large hydrocarbons into valuable products like diesel and gasoline, nanocatalysts are used. Reactions are more effective and selective when nanoparticles have a larger surface area and are more reactive.

Segmentation by Region

  • Asia Pacific leads the nanotechnology in the oil and gas market due to the accelerating rates of industrialization and urbanization, which are driving up energy demand. The development of Asia Pacific nanotechnology in the oil and gas industry will be aided by the novel ways nanotechnology offers to improve the extraction, investigation, and refinement of oil and gas.
  • Europe is estimated to rank second in market size for nanotechnology in oil and gas.
  • North America will witness the most rapid growth in nanotechnology in the oil and gas market.
  • The rest of the globe, which includes Africa, the Middle East, and Latin America, fulfills its need for gas and oil through nanotechnology.

Nanotechnology in Oil and Gas Market Research

Superior exploration techniques, the capture and storage of carbon, nanoparticles for improved fuel generation, and nanorobotics for maintenance are the variables that are anticipated to drive the global market’s expansion.

During forecasting, Asia Pacific will probably rule the nanotechnology in the oil and gas market. The Asia-Pacific area has seen a sharp rise in urbanization and industrialization, which has raised demand for energy, particularly gas and oil. This demand creates a need for cutting-edge technologies, and nanotechnology has the potential to significantly increase the energy sector’s sustainability and efficiency.  Investments in nanotechnology-related research and development have been made frequently in the area. The oil and gas industry can benefit from the creative solutions that governments, universities, and private businesses have been working together to investigate.

Additionally, Asia-Pacific governments and businesses have been collaborating strategically with research institutions and technology companies. The oil and gas industry may adopt nanotechnology more quickly due to these partnerships.  The Asia-Pacific area is appealing for technological advancements due to the size of its energy market. There is a strong incentive for businesses to invest in and adopt cutting-edge technologies like nanotechnology because of the wide range of energy needs and the large consumer base.

The North American area is projected to grow fastest throughout the forecast. The integration of nanomaterials into various processes is made easier by the close cooperation between the oil and gas and nanotechnology industries in North America. Partnerships between technology companies, energy corporations, and research institutions may be part of this collaboration. The development and application of nanotechnology in the energy sector may benefit from the regulatory climate in North America. Well-defined policies and regulations can offer a framework for businesses looking to invest in and implement nanotechnological solutions. North America has a sizable oil and gas sector, which has historically created a high demand for technological advancements to increase sustainability and efficiency. The market’s need may spur investment in and uptake of nanotechnology-based solutions.

Key Highlights of the Report

The global nanotechnology in the oil and gas market is segmented by enhanced oil recovery (EOR), drilling fluids and wellbore stability, corrosion prevention and control, downhole sensing and monitoring, water treatment and desalination, nanotechnology in cementing, reservoir imaging and characterization, environmental management, exploration and seismic imaging, nanobots and nanorobots, catalysts for upgrading processes, and region. As far as enhanced oil recovery (EOR) is concerned, nanofluids for reservoir stimulation are the market spearhead. Nanoparticle-based drilling fluids are the top segment. During the forecast period, the nanocoatings category is expected to grow at the highest CAGR. The nanoremediation is anticipated to experience the highest CAGR during the forecast period. The market for nanotechnology in oil and gas is expanding at a rapid pace in Asia Pacific.

One major factor influencing the use of nanotechnology in the oil and gas industry is the use of nanofluids for drilling fluid. A vital part of the drilling process for the production and exploration of oil and gas is drilling fluid, sometimes called mud. The addition of suspended nanoparticle-containing fluids, or nanofluids, to drilling fluids provides several benefits. Thermal conductivity can be improved by adding nanoparticles to drilling fluids. Because deep drilling frequently involves high temperatures, this feature is especially crucial. More effective heat dissipation reduces equipment damage and preserves drilling performance. This is achieved through improved thermal conductivity. When added to drilling fluids, nanoparticles alleviate friction and serve as lubricants. Drilling efficiency increases overall, drill bit lifespan increases, and wear and tear on drilling equipment decreases.

However, according to forecasts, Asia Pacific will hold the largest market share for nanotechnology in oil and gas globally. Because of its huge energy industry, the Asia-Pacific region appeals to technological breakthroughs. Since there is a wide spectrum of clientele and energy needs, businesses are highly motivated to invest funds in and exploit revolutionary technologies like nanotechnology. The North American region is also assumed to have the market’s sharpest growth. The United States has served as a center for nanotechnology research and development in North America. The field is progressing due to the existence of top research centers, universities, and businesses that specialize in nanotechnology applications in the energy sector.

Which Key Factors Are Driving Global Nanotechnology In the Oil And Gas Market?

The adoption of nanotechnology in the oil and gas industry is driven by increased heat transfer, enhanced oil transport nanoemulsions, optimized pipeline coatings, and leak detection nanosensors.

What Are The Key Challenges In The Global Market For Nanotechnology In Oil And Gas?

The rise of nanotechnology in the oil and gas industry is being hampered by several issues, including the high costs associated with nanotechnology research, concerns over nanotoxicology, the potential for nanoparticle aggregation, and the fluctuating behavior of nanomaterials.

What Market Opportunities Exist For Nanotechnology In Oil And Gas Globally?

There is much potential for growth in the oil and gas industry’s usage of nanotechnology due to its application in advanced nanocomposite coatings, enhanced gas wellness, hydraulic fracturing, and equipment development.

Market Drivers

Several factors influence the market for nanotechnology in oil and gas globally. The main factors influencing the market for nanotechnology in oil and gas globally are as follows:

Increasing Number of Applications for Intelligent Materials in Sensing and Monitoring

Smart materials can offer more sophisticated monitoring and sensing capabilities when combined with nanotechnology. Smart materials are made to react to external stimuli by displaying particular changes in their properties. Critical parameters like temperature, pressure, and chemical composition can be monitored in real-time in oil and gas operations due to nanosensors integrated into smart materials. Making decisions with greater accuracy and speed is made possible by this real-time data. Environmental monitoring in oil and gas operations can be enhanced by smart materials equipped with nanosensors. Their ability to identify and evaluate the consequences of spills, emissions, and other environmental incidents enables them to support timely and efficient response plans. By continuously monitoring potentially dangerous situations, the incorporation of nanotechnology into smart materials improves safety. This preventive strategy safeguards workers, reduces the risk of accidents.

Market Restraints

Several challenges could prevent the expansion of the global market for nanotechnology in oil and gas. Among them are the following:

High Expenses For Development

The behavior of nanomaterials in particular oil and gas environments must be understood to develop nanotechnology applications. This requires a great deal of research and experimentation. When conducting research and development, personnel, equipment, and material costs can add up. To solve industry-specific problems, nanotechnology applications in the oil and gas sector frequently need to be customized. Developing nanomaterials and technologies specifically suited to the particular circumstances of drilling operations, pipelines, and reservoirs may cost more. It can be difficult and expensive to move from small-scale laboratory research to large-scale industrial applications. The development process becomes more complex and expensive when scaling up nanotechnology processes while preserving performance and consistency. A workforce with the necessary skills and knowledge of nanoscience and nanotechnology is needed for the oil and gas industry to integrate nanotechnology successfully.

Opportunities

The global market for nanotechnology in oil and gas presents significant potential opportunities. The following is an example of these:

Utilizing Nanocomposites In Equipment Construction

Nanocomposites are materials that have improved properties that can be strategically adjusted to meet particular performance requirements by incorporating nanoparticles into a matrix material. Using nanocomposites in equipment construction has several benefits for the oil and gas industry, including improved cost-effectiveness, longevity, and efficiency. The mechanical strength and durability of materials used in equipment construction can be increased using nanocomposites. In the oil and gas sector, where equipment is exposed to harsh conditions like high temperatures and pressures, this is especially important. The equipment’s durability and dependability are enhanced by its mechanical qualities. Research and development opportunities are created by the need for novel nanocomposite solutions in equipment construction. Gaining a competitive edge can be achieved by businesses investing in R&D to create innovative nanomaterials and applications.

Competitive Landscape

Nanotechnology in Oil and Gas Market Report

Shape Your Report to Specific Countries or Regions & Enjoy 30% Off!

Key Players

The global market for nanotechnology in oil and gas is very competitive, with many powerful players. Some of the leading market participants and their corresponding market shares are listed below:

  • ExxonMobil
  • Shell
  • Chevron
  • Baker Hughes
  • Halliburton
  • DuPont
  • BASF
  • 3M
  • Others

These companies prioritize mergers and acquisitions, expanding their distribution network, and developing new products to remain competitive.

The leading competitors in the global market for nanotechnology in oil and gas are constantly looking for ways to get an advantage by releasing new items and advancements.

In July 2021, One of China’s biggest projects for carbon capture, utilization, and storage (CCUS) was initiated by Sinopec. With 25 million tonnes of oil in place, the company intends to carry out 24 CO2 EOR projects, which entail the reinjection of carbon dioxide to a targeted zone. In addition, Sinopec intends to reintroduce 10.68 million tonnes of carbon dioxide over the next 15 years, which should increase overall oil production by about 22 million barrels.

In May 2021, TechnipFMC, a provider of energy services, and Ithaca Energy announced a contract agreement for the Captain enhanced oil recovery (EOR) project in the North Sea, UK. TechnipFMC has been chosen to design, produce, and install subsea equipment, including rigid riser caissons, flexible flowlines for water injection, and umbilicals, among other related equipment.

Summary of Key Findings

  • The application of nanotechnology in the oil and gas sector is growing due to the increased use of nanocatalysts for refining.
  • The market is segmented by enhanced oil recovery (EOR), drilling fluids and wellbore stability, corrosion prevention and control, downhole sensing and monitoring, water treatment and desalination, nanotechnology in cementing, reservoir imaging and characterization, environmental management, exploration and seismic imaging, nanobots and nanorobots, catalysts for upgrading processes, and region.
  • The most popular enhanced oil recovery (EOR) in the market is nanofluids for reservoir stimulation.
  • The most ubiquitous downhole sensing and monitoring fragment is nanomaterial-based sensors.
  • Regarding CAGR, nanofiltration, and nanomembranes are expected to grow fastest during the forecast period.
  • The nanoparticles in the seismic surveys category will likely see the highest CAGR during the anticipated time frame.
  • Asia Pacific is leading market development; the market is highly competitive with key players including ExxonMobil, Shell, Chevron, Baker Hughes, Halliburton, DuPont, BASF, 3M, and others.

Future Outlook

  • Optimistic viewpoint for the global nanotechnology in the oil and gas market with noteworthy growth potential in the Asia Pacific region.
  • One of the key factors propelling the expansion of nanotechnology in the oil and gas industry is the improved pumping productivity and superior sensor networks.
  • Over the projected timeframe, the market’s expansion may face major challenges from cost-competitive substitutes.
  • Foremost companies must concentrate on product innovation, expanding their market reach, and maintaining competitive pricing to stay ahead.

How CXOs Can Benefit from the Credence Research Nanotechnology in Oil and Gas Market Report

The Credence Research Nanotechnology in Oil and Gas Market Report provides CXOs with a comprehensive overview of the market, including:

  • Market size and growth forecast: The report provides detailed estimates of the global nanotechnology in oil and gas market size, segmented by enhanced oil recovery (EOR), drilling fluids and wellbore stability, corrosion prevention and control, downhole sensing and monitoring, water treatment and desalination, nanotechnology in cementing, reservoir imaging and characterization, environmental management, exploration and seismic imaging, nanobots and nanorobots, catalysts for upgrading processes, and region. It also includes forecasts for the market through 2032 based on key trends and drivers.
  • Market segmentation: The report segments the nanotechnology in the oil and gas market by enhanced oil recovery (EOR), drilling fluids and wellbore stability, corrosion prevention and control, downhole sensing and monitoring, water treatment and desalination, nanotechnology in cementing, reservoir imaging and characterization, environmental management, exploration, and seismic imaging, nanobots and nanorobots, catalysts for upgrading processes, and region. This segmentation provides CXOs with a granular understanding of the market and the opportunities in each segment.
  • Competitive landscape: The report profiles the key nanotechnology oil and gas market players and provides insights into their strategies, product offerings, and financial performance. This information can help CXOs to identify and assess their competition.
  • Key trends and drivers: The report identifies and analyzes the key trends and drivers shaping nanotechnology in the oil and gas market. This information can help CXOs to make informed decisions about their investments and strategies.

CXOs can use the insights from the Credence Research Nanotechnology in Oil and Gas Market Report to:

  • Identify growth opportunities: The report can help CXOs identify new growth opportunities in nanotechnology in the oil and gas market. For example, the report identifies the growing demand for nanotechnology in oil and gas from petrochemical industries as a key opportunity.
  • Make informed investment decisions: The report can help CXOs make informed investment decisions about nanotechnology in oil and gas. For example, the report provides insights into the key factors to consider when evaluating nanotechnology in oil and gas providers and selecting nanotechnology in oil and gas solutions.
  • Develop competitive strategies: The report can help CXOs develop competitive strategies for their nanotechnology in oil and gas businesses. For example, the report identifies the key strategies that nanotechnology in oil and gas providers are using to differentiate themselves from their competitors.
  • Track market developments: The report can help CXOs track market developments and stay ahead of the curve. For example, the report provides insights into the latest trends and innovations in nanotechnology in the oil and gas market.

Overall, the Credence Research Nanotechnology in Oil and Gas Market Report is a valuable resource for CXOs looking to gain a deeper understanding of the market and identify growth opportunities.

Segmentation

  • By Enhanced Oil Recovery (EOR)
    • Nanofluids for Reservoir Stimulation
    • Smart Nanogels
  • By Drilling Fluids And Wellbore Stability
    • Nanoparticle-Based Drilling Fluids
    • Nanocomposites for Wellbore Reinforcement
  • By Corrosion Prevention And Control
    • Nanocoatings
    • Corrosion Inhibitors
  • By Downhole Sensing And Monitoring
    • Nanomaterial-Based Sensors
    • Smart Nanomaterials
  • By Water Treatment And Desalination
    • Nanofiltration and Nanomembranes
    • Nanoparticle-Based Adsorbents
  • By Nanotechnology In Cementing
    • Nanoparticles in Cement Formulations
    • Strength and Durability Enhancement
  • By Reservoir Imaging And Characterization
    • Nanoparticle Tracers
    • Nanoparticle-Enhanced Imaging Techniques
  • By Environmental Management
    • Nanoremediation
    • Nanoparticle-Based Sorbents
  • By Exploration And Seismic Imaging
    • Nanoparticles in Seismic Surveys
    • Improved Subsurface Imaging
  • By Nanobots And Nanorobots
    • Nanorobotic Applications
  • By Catalysts For Upgrading Processes
    • Nanocatalysts
  • By Region
    • North America
      • The U.S.
      • Canada
      • Mexico
    • Europe
      • Germany
      • France
      • The U.K.
      • Italy
      • Spain
      • Rest of Europe
    • Asia Pacific
      • China
      • Japan
      • India
      • South Korea
      • South-east Asia
      • Rest of Asia Pacific
    • Latin America
      • Brazil
      • Argentina
      • Rest of Latin America
    • Middle East & Africa
      • GCC Countries
      • South Africa
      • Rest of the Middle East and Africa

Table of Content
1. Preface
1.1. Report Description
1.1.1. Purpose of the Report
1.1.2. Target Audience
1.1.3. USP and Key Offerings
1.2. Research Scope
1.3. Market Introduction
2. Executive Summary
2.1. Market Snapshot: Global Nanotechnology in Oil and gas Market
2.1.1. Global Nanotechnology in Oil and gas Market, By Enhanced Oil Recovery (EOR)
2.1.2. Global Nanotechnology in Oil and gas Market, By Drilling Fluids and Wellbore Stability
2.1.3. Global Nanotechnology in Oil and gas Market, By Corrosion Prevention and Control
2.1.4. Global Nanotechnology in Oil and gas Market, By Downhole Sensing and Monitoring
2.1.5. Global Nanotechnology in Oil and gas Market, By Water Treatment and Desalination
2.1.6. Global Nanotechnology in Oil and gas Market, By Nanotechnology in Cementing
2.1.7. Global Nanotechnology in Oil and gas Market, By Reservoir Imaging and Characterization
2.1.8. Global Nanotechnology in Oil and gas Market, By Environmental Management
2.1.9. Global Nanotechnology in Oil and gas Market, By Exploration and Seismic Imaging
2.1.10. Global Nanotechnology in Oil and gas Market, By Nanobots and Nanorobots
2.1.11. Global Nanotechnology in Oil and gas Market, By Catalysts for Upgrading Processes
2.1.12. Global Nanotechnology in Oil and gas Market, By Region
2.2. Insights from Primary Respondents
3. Market Dynamics & Factors Analysis
3.1. Introduction
3.1.1. Global Nanotechnology in Oil and gas Market Value, 2017-2030, (US$ Mn)
3.1.2. Y-o-Y Growth Trend Analysis
3.2. Market Dynamics
3.2.1. Nanotechnology in Oil and gas Market Drivers
3.2.2. Nanotechnology in Oil and gas Market Restraints
3.2.3. Nanotechnology in Oil and gas Market Opportunities
3.2.4. Major Nanotechnology in Oil and gas Industry Challenges
3.3. Growth and Development Patterns
3.4. Investment Feasibility Analysis
3.5. Market Opportunity Analysis
3.5.1. Enhanced Oil Recovery (EOR)
3.5.2. Drilling Fluids and Wellbore Stability
3.5.3. Corrosion Prevention and Control
3.5.4. Downhole Sensing and Monitoring
3.5.5. Water Treatment and Desalination
3.5.6. Nanotechnology in Cementing
3.5.7. Reservoir Imaging and Characterization
3.5.8. Environmental Management
3.5.9. Exploration and Seismic Imaging
3.5.10. Nanobots and Nanorobots
3.5.11. Catalysts for Upgrading Processes
3.5.12. Geography
4. Market Competitive Landscape Analysis
4.1. Company Market Share Analysis, 2022
4.1.1. Global Nanotechnology in Oil and gas Market: Company Market Share, Value 2022
4.1.2. Global Nanotechnology in Oil and gas Market: Top 6 Company Market Share, Value 2022
4.1.3. Global Nanotechnology in Oil and gas Market: Top 3 Company Market Share, Value 2022
4.2. Global Nanotechnology in Oil and gas Market: Company Revenue Share Analysis, 2022
4.3. Company Assessment Metrics, 2022
4.3.1. Stars
4.3.2. Emerging Leaders
4.3.3. Pervasive Players
4.3.4. Participants
4.4. Startups/ SMEs Assessment Metrics, 2022
4.4.1. Progressive Companies
4.4.2. Responsive Companies
4.4.3. Dynamic Companies
4.4.4. Starting Blocks
4.5. Strategic Development
4.5.1. Acquisition and Mergers
4.5.2. New Product Launch
4.5.3. Regional Expansion
4.5.4. Partnerships
4.6. Key Player Product Matrix
4.7. Potential for New Players in the Global Nanotechnology in Oil and gas Market
5. Premium Insights
5.1. STAR (Situation, Task, Action, Results) Analysis
5.2. Porter’s Five Forces Analysis
5.2.1. Threat of New Entrants
5.2.2. Bargaining Power of Buyers/Consumers
5.2.3. Bargaining Power of Suppliers
5.2.4. Threat of Substitute Types
5.2.5. Intensity of Competitive Rivalry
5.3. PESTEL Analysis
5.3.1. Political Factors
5.3.2. Economic Factors
5.3.3. Social Factors
5.3.4. Technological Factors
5.3.5. Environmental Factors
5.3.6. Legal Factors
5.4. Key Market Trends
5.4.1. Demand Side Trends
5.4.2. Supply Side Trends
5.5. Value Chain Analysis
5.6. Technology Analysis
5.6.1. Research and development in the global market
5.6.2. Patent Analysis
5.6.3. Emerging technologies and their potential disruption to the market
5.7. Consumer Behaviour Analysis
5.7.1. Consumer Preferences and Expectations
5.7.2. Factors Influencing Consumer Buying Decisions
5.7.2.1. North America
5.7.2.2. Europe
5.7.2.3. Asia Pacific
5.7.2.4. Latin America
5.7.2.5. Middle East and Africa
5.7.3. Consumer Pain Points
5.8. Analysis and Recommendations
5.9. Adjacent Market Analysis
6. Market Positioning of Key Players, 2022
6.1. Company market share of key players, 2022
6.2. Competitive Benchmarking
6.3. Market Positioning of Key Vendors
6.4. Geographical Presence Analysis
6.5. Major Strategies Adopted by Key Players
6.5.1. Key Strategies Analysis
6.5.2. Mergers and Acquisitions
6.5.3. Partnerships
6.5.4. Product Launch
6.5.5. Geographical Expansion
6.5.6. Others
7. Impact Analysis of COVID 19 and Russia – Ukraine War on Nanotechnology in Oil and gas Market
7.1. Ukraine-Russia War Impact
7.1.1. Uncertainty and Economic Instability
7.1.2. Supply chain disruptions
7.1.3. Regional market shifts
7.1.4. Shift in government priorities
7.2. COVID-19 Impact Analysis
7.2.1. Supply Chain Disruptions
7.2.2. Demand Fluctuations
7.2.3. Shift in Product Mix
7.2.4. Reduced Industrial Activity
7.2.5. Regional Impact Analysis
7.2.5.1. North America
7.2.5.2. Europe
7.2.5.3. Asia Pacific
7.2.5.4. Latin America
7.2.5.5. Middle East and Africa
8. Global Nanotechnology in Oil and gas Market, By Enhanced Oil Recovery (EOR)
8.1. Global Nanotechnology in Oil and gas Market Overview, by Enhanced Oil Recovery (EOR)
8.1.1. Global Nanotechnology in Oil and gas Market Revenue Share, By Enhanced Oil Recovery (EOR), 2022 Vs 2030 (in %)
8.2. Nanofluids for Reservoir Stimulation
8.2.1. Global Nanotechnology in Oil and gas Market, By Nanofluids for Reservoir Stimulation, By Region, 2017-2030 (US$ Mn)
8.2.2. Market Dynamics for Nanofluids for Reservoir Stimulation
8.2.2.1. Drivers
8.2.2.2. Restraints
8.2.2.3. Opportunities
8.2.2.4. Trends
8.3. Smart Nanogels
8.3.1. Global Nanotechnology in Oil and gas Market, By Smart Nanogels, By Region, 2017-2030 (US$ Mn)
8.3.2. Market Dynamics for Smart Nanogels
8.3.2.1. Drivers
8.3.2.2. Restraints
8.3.2.3. Opportunities
8.3.2.4. Trends
9. Global Nanotechnology in Oil and gas Market, By Drilling Fluids and Wellbore Stability
9.1. Global Nanotechnology in Oil and gas Market Overview, by Drilling Fluids and Wellbore Stability
9.1.1. Global Nanotechnology in Oil and gas Market Revenue Share, By Drilling Fluids and Wellbore Stability, 2022 Vs 2030 (in %)
9.2. Nanoparticle-Based Drilling Fluids
9.2.1. Global Nanotechnology in Oil and gas Market, By Nanoparticle-Based Drilling Fluids, By Region, 2017-2030 (US$ Mn)
9.2.2. Market Dynamics for Nanoparticle-Based Drilling Fluids
9.2.2.1. Drivers
9.2.2.2. Restraints
9.2.2.3. Opportunities
9.2.2.4. Trends
9.3. Nanocomposites for Wellbore Reinforcement
9.3.1. Global Nanotechnology in Oil and gas Market, By Nanocomposites for Wellbore Reinforcement, By Region, 2017-2030 (US$ Mn)
9.3.2. Market Dynamics for Nanocomposites for Wellbore Reinforcement
9.3.2.1. Drivers
9.3.2.2. Restraints
9.3.2.3. Opportunities
9.3.2.4. Trends
10. Global Nanotechnology in Oil and gas Market, By Corrosion Prevention and Control
10.1. Global Nanotechnology in Oil and gas Market Overview, by Corrosion Prevention and Control
10.1.1. Global Nanotechnology in Oil and gas Market Revenue Share, By Corrosion Prevention and Control, 2022 Vs 2030 (in %)
10.2. Nanocoatings
10.2.1. Global Nanotechnology in Oil and gas Market, By Nanocoatings, By Region, 2017-2030 (US$ Mn)
10.2.2. Market Dynamics for Nanocoatings
10.2.2.1. Drivers
10.2.2.2. Restraints
10.2.2.3. Opportunities
10.2.2.4. Trends
10.3. Corrosion Inhibitors
10.3.1. Global Nanotechnology in Oil and gas Market, By Corrosion Inhibitors, By Region, 2017-2030 (US$ Mn)
10.3.2. Market Dynamics for Corrosion Inhibitors
10.3.2.1. Drivers
10.3.2.2. Restraints
10.3.2.3. Opportunities
10.3.2.4. Trends
11. Global Nanotechnology in Oil and gas Market, By Downhole Sensing and Monitoring
11.1. Global Nanotechnology in Oil and gas Market Overview, by Downhole Sensing and Monitoring
11.1.1. Global Nanotechnology in Oil and gas Market Revenue Share, By Downhole Sensing and Monitoring, 2022 Vs 2030 (in %)
11.2. Nanomaterial-Based Sensors
11.2.1. Global Nanotechnology in Oil and gas Market, By Nanomaterial-Based Sensors, By Region, 2017-2030 (US$ Mn)
11.2.2. Market Dynamics for Nanomaterial-Based Sensors
11.2.2.1. Drivers
11.2.2.2. Restraints
11.2.2.3. Opportunities
11.2.2.4. Trends
11.3. Smart Nanomaterials
11.3.1. Global Nanotechnology in Oil and gas Market, By Smart Nanomaterials, By Region, 2017-2030 (US$ Mn)
11.3.2. Market Dynamics for Smart Nanomaterials
11.3.2.1. Drivers
11.3.2.2. Restraints
11.3.2.3. Opportunities
11.3.2.4. Trends
12. Global Nanotechnology in Oil and gas Market, By Water Treatment and Desalination
12.1. Global Nanotechnology in Oil and gas Market Overview, by Water Treatment and Desalination
12.1.1. Global Nanotechnology in Oil and gas Market Revenue Share, By Water Treatment and Desalination, 2022 Vs 2030 (in %)
12.2. Nanofiltration and Nanomembranes
12.2.1. Global Nanotechnology in Oil and gas Market, By Nanofiltration and Nanomembranes, By Region, 2017-2030 (US$ Mn)
12.2.2. Market Dynamics for Nanofiltration and Nanomembranes
12.2.2.1. Drivers
12.2.2.2. Restraints
12.2.2.3. Opportunities
12.2.2.4. Trends
12.3. Nanoparticle-Based Adsorbents
12.3.1. Global Nanotechnology in Oil and gas Market, By Nanoparticle-Based Adsorbents, By Region, 2017-2030 (US$ Mn)
12.3.2. Market Dynamics for Nanoparticle-Based Adsorbents
12.3.2.1. Drivers
12.3.2.2. Restraints
12.3.2.3. Opportunities
12.3.2.4. Trends
13. Global Nanotechnology in Oil and gas Market, By Nanotechnology in Cementing
13.1. Global Nanotechnology in Oil and gas Market Overview, by Nanotechnology in Cementing
13.1.1. Global Nanotechnology in Oil and gas Market Revenue Share, By Nanotechnology in Cementing, 2022 Vs 2030 (in %)
13.2. Nanoparticles in Cement Formulations
13.2.1. Global Nanotechnology in Oil and gas Market, By Nanoparticles in Cement Formulations, By Region, 2017-2030 (US$ Mn)
13.2.2. Market Dynamics for Nanoparticles in Cement Formulations
13.2.2.1. Drivers
13.2.2.2. Restraints
13.2.2.3. Opportunities
13.2.2.4. Trends
13.3. Strength and Durability Enhancement
13.3.1. Global Nanotechnology in Oil and gas Market, By Strength and Durability Enhancement, By Region, 2017-2030 (US$ Mn)
13.3.2. Market Dynamics for Strength and Durability Enhancement
13.3.2.1. Drivers
13.3.2.2. Restraints
13.3.2.3. Opportunities
13.3.2.4. Trends
14. Global Nanotechnology in Oil and gas Market, By Reservoir Imaging and Characterization
14.1. Global Nanotechnology in Oil and gas Market Overview, by Reservoir Imaging and Characterization
14.1.1. Global Nanotechnology in Oil and gas Market Revenue Share, By Reservoir Imaging and Characterization, 2022 Vs 2030 (in %)
14.2. Nanoparticle Tracers
14.2.1. Global Nanotechnology in Oil and gas Market, By Nanoparticle Tracers, By Region, 2017-2030 (US$ Mn)
14.2.2. Market Dynamics for Nanoparticle Tracers
14.2.2.1. Drivers
14.2.2.2. Restraints
14.2.2.3. Opportunities
14.2.2.4. Trends
14.3. Nanoparticle-Enhanced Imaging Techniques
14.3.1. Global Nanotechnology in Oil and gas Market, By Nanoparticle-Enhanced Imaging Techniques, By Region, 2017-2030 (US$ Mn)
14.3.2. Market Dynamics for Nanoparticle-Enhanced Imaging Techniques
14.3.2.1. Drivers
14.3.2.2. Restraints
14.3.2.3. Opportunities
14.3.2.4. Trends
15. Global Nanotechnology in Oil and gas Market, By Environmental Management
15.1. Global Nanotechnology in Oil and gas Market Overview, by Environmental Management
15.1.1. Global Nanotechnology in Oil and gas Market Revenue Share, By Environmental Management, 2022 Vs 2030 (in %)
15.2. Nanoremediation
15.2.1. Global Nanotechnology in Oil and gas Market, By Nanoremediation, By Region, 2017-2030 (US$ Mn)
15.2.2. Market Dynamics for Nanoremediation
15.2.2.1. Drivers
15.2.2.2. Restraints
15.2.2.3. Opportunities
15.2.2.4. Trends
15.3. Nanoparticle-Based Sorbents
15.3.1. Global Nanotechnology in Oil and gas Market, By Nanoparticle-Based Sorbents, By Region, 2017-2030 (US$ Mn)
15.3.2. Market Dynamics for Nanoparticle-Based Sorbents
15.3.2.1. Drivers
15.3.2.2. Restraints
15.3.2.3. Opportunities
15.3.2.4. Trends
16. Global Nanotechnology in Oil and gas Market, By Exploration and Seismic Imaging
16.1. Global Nanotechnology in Oil and gas Market Overview, by Exploration and Seismic Imaging
16.1.1. Global Nanotechnology in Oil and gas Market Revenue Share, By Exploration and Seismic Imaging, 2022 Vs 2030 (in %)
16.2. Nanoparticles in Seismic Surveys
16.2.1. Global Nanotechnology in Oil and gas Market, By Nanoparticles in Seismic Surveys, By Region, 2017-2030 (US$ Mn)
16.2.2. Market Dynamics for Nanoparticles in Seismic Surveys
16.2.2.1. Drivers
16.2.2.2. Restraints
16.2.2.3. Opportunities
16.2.2.4. Trends
16.3. Improved Subsurface Imaging
16.3.1. Global Nanotechnology in Oil and gas Market, By Improved Subsurface Imaging, By Region, 2017-2030 (US$ Mn)
16.3.2. Market Dynamics for Improved Subsurface Imaging
16.3.2.1. Drivers
16.3.2.2. Restraints
16.3.2.3. Opportunities
16.3.2.4. Trends
17. Global Nanotechnology in Oil and gas Market, By Nanobots and Nanorobots
17.1. Global Nanotechnology in Oil and gas Market Overview, by Nanobots and Nanorobots
17.1.1. Global Nanotechnology in Oil and gas Market Revenue Share, By Nanobots and Nanorobots, 2022 Vs 2030 (in %)
17.2. Nanorobotic Applications
17.2.1. Global Nanotechnology in Oil and gas Market, By Nanorobotic Applications, By Region, 2017-2030 (US$ Mn)
17.2.2. Market Dynamics for Nanorobotic Applications
17.2.2.1. Drivers
17.2.2.2. Restraints
17.2.2.3. Opportunities
17.2.2.4. Trends
18. Global Nanotechnology in Oil and gas Market, By Catalysts for Upgrading Processes
18.1. Global Nanotechnology in Oil and gas Market Overview, by Catalysts for Upgrading Processes
18.1.1. Global Nanotechnology in Oil and gas Market Revenue Share, By Catalysts for Upgrading Processes, 2022 Vs 2030 (in %)
18.2. Nanocatalysts
18.2.1. Global Nanotechnology in Oil and gas Market, By Nanocatalysts, By Region, 2017-2030 (US$ Mn)
18.2.2. Market Dynamics for Nanocatalysts
18.2.2.1. Drivers
18.2.2.2. Restraints
18.2.2.3. Opportunities
18.2.2.4. Trends
19. Global Nanotechnology in Oil and gas Market, By Region
19.1. Global Nanotechnology in Oil and gas Market Overview, by Region
19.1.1. Global Nanotechnology in Oil and gas Market, By Region, 2022 vs 2030 (in%)
19.2. Enhanced Oil Recovery (EOR)
19.2.1. Global Nanotechnology in Oil and gas Market, By Enhanced Oil Recovery (EOR), 2017-2030 (US$ Mn)
19.3. Drilling Fluids and Wellbore Stability
19.3.1. Global Nanotechnology in Oil and gas Market, By Drilling Fluids and Wellbore Stability, 2017-2030 (US$ Mn)
19.4. Corrosion Prevention and Control
19.4.1. Global Nanotechnology in Oil and gas Market, By Corrosion Prevention and Control, 2017-2030 (US$ Mn)
19.5. Downhole Sensing and Monitoring
19.5.1. Global Nanotechnology in Oil and gas Market, By Downhole Sensing and Monitoring, 2017-2030 (US$ Mn)
19.6. Water Treatment and Desalination
19.6.1. Global Nanotechnology in Oil and gas Market, By Water Treatment and Desalination, 2017-2030 (US$ Mn)
19.7. Nanotechnology in Cementing
19.7.1. Global Nanotechnology in Oil and gas Market, By Nanotechnology in Cementing, 2017-2030 (US$ Mn)
19.8. Reservoir Imaging and Characterization
19.8.1. Global Nanotechnology in Oil and gas Market, By Reservoir Imaging and Characterization, 2017-2030 (US$ Mn)
19.9. Environmental Management
19.9.1. Global Nanotechnology in Oil and gas Market, By Environmental Management, 2017-2030 (US$ Mn)
19.10. Exploration and Seismic Imaging
19.10.1. Global Nanotechnology in Oil and gas Market, By Exploration and Seismic Imaging, 2017-2030 (US$ Mn)
19.11. Nanobots and Nanorobots
19.11.1. Global Nanotechnology in Oil and gas Market, By Nanobots and Nanorobots, 2017-2030 (US$ Mn)
19.12. Catalysts for Upgrading Processes
19.12.1. Global Nanotechnology in Oil and gas Market, By Catalysts for Upgrading Processes, 2017-2030 (US$ Mn)
20. North America Nanotechnology in Oil and gas Market Analysis
20.1. Overview
20.1.1. Market Dynamics for North America
20.1.1.1. Drivers
20.1.1.2. Restraints
20.1.1.3. Opportunities
20.1.1.4. Trends
20.2. North America Nanotechnology in Oil and gas Market, by Enhanced Oil Recovery (EOR), 2017-2030(US$ Mn)
20.2.1. Overview
20.2.2. SRC Analysis
20.3. North America Nanotechnology in Oil and gas Market, by Drilling Fluids and Wellbore Stability, 2017-2030(US$ Mn)
20.3.1. Overview
20.3.2. SRC Analysis
20.4. North America Nanotechnology in Oil and gas Market, by Corrosion Prevention and Control, 2017-2030(US$ Mn)
20.4.1. Overview
20.4.2. SRC Analysis
20.5. North America Nanotechnology in Oil and gas Market, by Downhole Sensing and Monitoring, 2017-2030(US$ Mn)
20.5.1. Overview
20.5.2. SRC Analysis
20.6. North America Nanotechnology in Oil and gas Market, by Water Treatment and Desalination, 2017-2030(US$ Mn)
20.6.1. Overview
20.6.2. SRC Analysis
20.7. North America Nanotechnology in Oil and gas Market, by Nanotechnology in Cementing, 2017-2030(US$ Mn)
20.7.1. Overview
20.7.2. SRC Analysis
20.8. North America Nanotechnology in Oil and gas Market, by Reservoir Imaging and Characterization, 2017-2030(US$ Mn)
20.8.1. Overview
20.8.2. SRC Analysis
20.9. North America Nanotechnology in Oil and gas Market, by Environmental Management, 2017-2030(US$ Mn)
20.9.1. Overview
20.9.2. SRC Analysis
20.10. North America Nanotechnology in Oil and gas Market, by Exploration and Seismic Imaging, 2017-2030(US$ Mn)
20.10.1. Overview
20.10.2. SRC Analysis
20.11. North America Nanotechnology in Oil and gas Market, by Nanobots and Nanorobots, 2017-2030(US$ Mn)
20.11.1. Overview
20.11.2. SRC Analysis
20.12. North America Nanotechnology in Oil and gas Market, by Catalysts for Upgrading Processes, 2017-2030(US$ Mn)
20.12.1. Overview
20.12.2. SRC Analysis
20.13. North America Nanotechnology in Oil and gas Market, by Country, 2017-2030 (US$ Mn)
20.13.1. North America Nanotechnology in Oil and gas Market, by Country, 2022 Vs 2030 (in%)
20.13.2. U.S.
20.13.3. Canada
20.13.4. Mexico
21. Europe Nanotechnology in Oil and gas Market Analysis
21.1. Overview
21.1.1. Market Dynamics for Europe
21.1.1.1. Drivers
21.1.1.2. Restraints
21.1.1.3. Opportunities
21.1.1.4. Trends
21.2. Europe Nanotechnology in Oil and gas Market, by Enhanced Oil Recovery (EOR), 2017-2030(US$ Mn)
21.2.1. Overview
21.2.2. SRC Analysis
21.3. Europe Nanotechnology in Oil and gas Market, by Drilling Fluids and Wellbore Stability, 2017-2030(US$ Mn)
21.3.1. Overview
21.3.2. SRC Analysis
21.4. Europe Nanotechnology in Oil and gas Market, by Corrosion Prevention and Control, 2017-2030(US$ Mn)
21.4.1. Overview
21.4.2. SRC Analysis
21.5. Europe Nanotechnology in Oil and gas Market, by Downhole Sensing and Monitoring, 2017-2030(US$ Mn)
21.5.1. Overview
21.5.2. SRC Analysis
21.6. Europe Nanotechnology in Oil and gas Market, by Water Treatment and Desalination, 2017-2030(US$ Mn)
21.6.1. Overview
21.6.2. SRC Analysis
21.7. Europe Nanotechnology in Oil and gas Market, by Nanotechnology in Cementing, 2017-2030(US$ Mn)
21.7.1. Overview
21.7.2. SRC Analysis
21.8. Europe Nanotechnology in Oil and gas Market, by Reservoir Imaging and Characterization, 2017-2030(US$ Mn)
21.8.1. Overview
21.8.2. SRC Analysis
21.9. Europe Nanotechnology in Oil and gas Market, by Environmental Management, 2017-2030(US$ Mn)
21.9.1. Overview
21.9.2. SRC Analysis
21.10. Europe Nanotechnology in Oil and gas Market, by Exploration and Seismic Imaging, 2017-2030(US$ Mn)
21.10.1. Overview
21.10.2. SRC Analysis
21.11. Europe Nanotechnology in Oil and gas Market, by Nanobots and Nanorobots, 2017-2030(US$ Mn)
21.11.1. Overview
21.11.2. SRC Analysis
21.12. Europe Nanotechnology in Oil and gas Market, by Catalysts for Upgrading Processes, 2017-2030(US$ Mn)
21.12.1. Overview
21.12.2. SRC Analysis
21.13. Europe Nanotechnology in Oil and gas Market, by Country, 2017-2030 (US$ Mn)
21.13.1. Europe Nanotechnology in Oil and gas Market, by Country, 2022 Vs 2030 (in%)
21.13.2. UK
21.13.3. France
21.13.4. Germany
21.13.5. Italy
21.13.6. Spain
21.13.7. Benelux
21.13.8. Russia
21.13.9. Rest of Europe
22. Asia Pacific Nanotechnology in Oil and gas Market Analysis
22.1. Overview
22.1.1. Market Dynamics for Asia Pacific
22.1.1.1. Drivers
22.1.1.2. Restraints
22.1.1.3. Opportunities
22.1.1.4. Trends
22.2. Asia Pacific Nanotechnology in Oil and gas Market, by Enhanced Oil Recovery (EOR), 2017-2030(US$ Mn)
22.2.1. Overview
22.2.2. SRC Analysis
22.3. Asia Pacific Nanotechnology in Oil and gas Market, by Drilling Fluids and Wellbore Stability, 2017-2030(US$ Mn)
22.3.1. Overview
22.3.2. SRC Analysis
22.4. Asia Pacific Nanotechnology in Oil and gas Market, by Corrosion Prevention and Control, 2017-2030(US$ Mn)
22.4.1. Overview
22.4.2. SRC Analysis
22.5. Asia Pacific Nanotechnology in Oil and gas Market, by Downhole Sensing and Monitoring, 2017-2030(US$ Mn)
22.5.1. Overview
22.5.2. SRC Analysis
22.6. Asia Pacific Nanotechnology in Oil and gas Market, by Water Treatment and Desalination, 2017-2030(US$ Mn)
22.6.1. Overview
22.6.2. SRC Analysis
22.7. Asia Pacific Nanotechnology in Oil and gas Market, by Nanotechnology in Cementing, 2017-2030(US$ Mn)
22.7.1. Overview
22.7.2. SRC Analysis
22.8. Asia Pacific Nanotechnology in Oil and gas Market, by Reservoir Imaging and Characterization, 2017-2030(US$ Mn)
22.8.1. Overview
22.8.2. SRC Analysis
22.9. Asia Pacific Nanotechnology in Oil and gas Market, by Environmental Management, 2017-2030(US$ Mn)
22.9.1. Overview
22.9.2. SRC Analysis
22.10. Asia Pacific Nanotechnology in Oil and gas Market, by Exploration and Seismic Imaging, 2017-2030(US$ Mn)
22.10.1. Overview
22.10.2. SRC Analysis
22.11. Asia Pacific Nanotechnology in Oil and gas Market, by Nanobots and Nanorobots, 2017-2030(US$ Mn)
22.11.1. Overview
22.11.2. SRC Analysis
22.12. Asia Pacific Nanotechnology in Oil and gas Market, by Catalysts for Upgrading Processes, 2017-2030(US$ Mn)
22.12.1. Overview
22.12.2. SRC Analysis
22.13. Asia Pacific Nanotechnology in Oil and gas Market, by Country, 2017-2030 (US$ Mn)
22.13.1. Asia Pacific Nanotechnology in Oil and gas Market, by Country, 2022 Vs 2030 (in%)
22.13.2. China
22.13.3. Japan
22.13.4. India
22.13.5. South Korea
22.13.6. South East Asia
22.13.7. Rest of Asia Pacific
23. Latin America Nanotechnology in Oil and gas Market Analysis
23.1. Overview
23.1.1. Market Dynamics for Latin America
23.1.1.1. Drivers
23.1.1.2. Restraints
23.1.1.3. Opportunities
23.1.1.4. Trends
23.2. Latin America Nanotechnology in Oil and gas Market, by Enhanced Oil Recovery (EOR), 2017-2030(US$ Mn)
23.2.1. Overview
23.2.2. SRC Analysis
23.3. Latin America Nanotechnology in Oil and gas Market, by Drilling Fluids and Wellbore Stability, 2017-2030(US$ Mn)
23.3.1. Overview
23.3.2. SRC Analysis
23.4. Latin America Nanotechnology in Oil and gas Market, by Corrosion Prevention and Control, 2017-2030(US$ Mn)
23.4.1. Overview
23.4.2. SRC Analysis
23.5. Latin America Nanotechnology in Oil and gas Market, by Downhole Sensing and Monitoring, 2017-2030(US$ Mn)
23.5.1. Overview
23.5.2. SRC Analysis
23.6. Latin America Nanotechnology in Oil and gas Market, by Water Treatment and Desalination, 2017-2030(US$ Mn)
23.6.1. Overview
23.6.2. SRC Analysis
23.7. Latin America Nanotechnology in Oil and gas Market, by Nanotechnology in Cementing, 2017-2030(US$ Mn)
23.7.1. Overview
23.7.2. SRC Analysis
23.8. Latin America Nanotechnology in Oil and gas Market, by Reservoir Imaging and Characterization, 2017-2030(US$ Mn)
23.8.1. Overview
23.8.2. SRC Analysis
23.9. Latin America Nanotechnology in Oil and gas Market, by Environmental Management, 2017-2030(US$ Mn)
23.9.1. Overview
23.9.2. SRC Analysis
23.10. Latin America Nanotechnology in Oil and gas Market, by Exploration and Seismic Imaging, 2017-2030(US$ Mn)
23.10.1. Overview
23.10.2. SRC Analysis
23.11. Latin America Nanotechnology in Oil and gas Market, by Nanobots and Nanorobots, 2017-2030(US$ Mn)
23.11.1. Overview
23.11.2. SRC Analysis
23.12. Latin America Nanotechnology in Oil and gas Market, by Catalysts for Upgrading Processes, 2017-2030(US$ Mn)
23.12.1. Overview
23.12.2. SRC Analysis
23.13. Latin America Nanotechnology in Oil and gas Market, by Country, 2017-2030 (US$ Mn)
23.13.1. Latin America Nanotechnology in Oil and gas Market, by Country, 2022 Vs 2030 (in%)
23.13.2. Brazil
23.13.3. Argentina
23.13.4. Rest of Latin America
24. Middle East Nanotechnology in Oil and gas Market Analysis
24.1. Overview
24.1.1. Market Dynamics for Middle East
24.1.1.1. Drivers
24.1.1.2. Restraints
24.1.1.3. Opportunities
24.1.1.4. Trends
24.2. Middle East Nanotechnology in Oil and gas Market, by Enhanced Oil Recovery (EOR), 2017-2030(US$ Mn)
24.2.1. Overview
24.2.2. SRC Analysis
24.3. Middle East Nanotechnology in Oil and gas Market, by Drilling Fluids and Wellbore Stability, 2017-2030(US$ Mn)
24.3.1. Overview
24.3.2. SRC Analysis
24.4. Middle East Nanotechnology in Oil and gas Market, by Corrosion Prevention and Control, 2017-2030(US$ Mn)
24.4.1. Overview
24.4.2. SRC Analysis
24.5. Middle East Nanotechnology in Oil and gas Market, by Downhole Sensing and Monitoring, 2017-2030(US$ Mn)
24.5.1. Overview
24.5.2. SRC Analysis
24.6. Middle East Nanotechnology in Oil and gas Market, by Water Treatment and Desalination, 2017-2030(US$ Mn)
24.6.1. Overview
24.6.2. SRC Analysis
24.7. Middle East Nanotechnology in Oil and gas Market, by Nanotechnology in Cementing, 2017-2030(US$ Mn)
24.7.1. Overview
24.7.2. SRC Analysis
24.8. Middle East Nanotechnology in Oil and gas Market, by Reservoir Imaging and Characterization, 2017-2030(US$ Mn)
24.8.1. Overview
24.8.2. SRC Analysis
24.9. Middle East Nanotechnology in Oil and gas Market, by Environmental Management, 2017-2030(US$ Mn)
24.9.1. Overview
24.9.2. SRC Analysis
24.10. Middle East Nanotechnology in Oil and gas Market, by Exploration and Seismic Imaging, 2017-2030(US$ Mn)
24.10.1. Overview
24.10.2. SRC Analysis
24.11. Middle East Nanotechnology in Oil and gas Market, by Nanobots and Nanorobots, 2017-2030(US$ Mn)
24.11.1. Overview
24.11.2. SRC Analysis
24.12. Middle East Nanotechnology in Oil and gas Market, by Catalysts for Upgrading Processes, 2017-2030(US$ Mn)
24.12.1. Overview
24.12.2. SRC Analysis
24.13. Middle East Nanotechnology in Oil and gas Market, by Country, 2017-2030 (US$ Mn)
24.13.1. Middle East Nanotechnology in Oil and gas Market, by Country, 2022 Vs 2030 (in%)
24.13.2. UAE
24.13.3. Saudi Arabia
24.13.4. Rest of Middle East
25. Africa Nanotechnology in Oil and gas Market Analysis
25.1. Overview
25.1.1. Market Dynamics for Africa
25.1.1.1. Drivers
25.1.1.2. Restraints
25.1.1.3. Opportunities
25.1.1.4. Trends
25.2. Africa Nanotechnology in Oil and gas Market, by Enhanced Oil Recovery (EOR), 2017-2030(US$ Mn)
25.2.1. Overview
25.2.2. SRC Analysis
25.3. Africa Nanotechnology in Oil and gas Market, by Drilling Fluids and Wellbore Stability, 2017-2030(US$ Mn)
25.3.1. Overview
25.3.2. SRC Analysis
25.4. Africa Nanotechnology in Oil and gas Market, by Corrosion Prevention and Control, 2017-2030(US$ Mn)
25.4.1. Overview
25.4.2. SRC Analysis
25.5. Africa Nanotechnology in Oil and gas Market, by Downhole Sensing and Monitoring, 2017-2030(US$ Mn)
25.5.1. Overview
25.5.2. SRC Analysis
25.6. Africa Nanotechnology in Oil and gas Market, by Water Treatment and Desalination, 2017-2030(US$ Mn)
25.6.1. Overview
25.6.2. SRC Analysis
25.7. Africa Nanotechnology in Oil and gas Market, by Nanotechnology in Cementing, 2017-2030(US$ Mn)
25.7.1. Overview
25.7.2. SRC Analysis
25.8. Africa Nanotechnology in Oil and gas Market, by Reservoir Imaging and Characterization, 2017-2030(US$ Mn)
25.8.1. Overview
25.8.2. SRC Analysis
25.9. Africa Nanotechnology in Oil and gas Market, by Environmental Management, 2017-2030(US$ Mn)
25.9.1. Overview
25.9.2. SRC Analysis
25.10. Africa Nanotechnology in Oil and gas Market, by Exploration and Seismic Imaging, 2017-2030(US$ Mn)
25.10.1. Overview
25.10.2. SRC Analysis
25.11. Africa Nanotechnology in Oil and gas Market, by Nanobots and Nanorobots, 2017-2030(US$ Mn)
25.11.1. Overview
25.11.2. SRC Analysis
25.12. Africa Nanotechnology in Oil and gas Market, by Catalysts for Upgrading Processes, 2017-2030(US$ Mn)
25.12.1. Overview
25.12.2. SRC Analysis
25.13. Africa Nanotechnology in Oil and gas Market, by Country, 2017-2030 (US$ Mn)
25.13.1. Africa Nanotechnology in Oil and gas Market, by Country, 2022 Vs 2030 (in%)
25.13.2. South Africa
25.13.3. Egypt
25.13.4. Rest of Africa
26. Company Profiles
26.1. ExxonMobil
26.1.1. Company Overview
26.1.2. Products/Services Portfolio
26.1.3. Geographical Presence
26.1.4. SWOT Analysis
26.1.5. Financial Summary
26.1.5.1. Market Revenue and Net Profit (2019-2022)
26.1.5.2. Business Segment Revenue Analysis
26.1.5.3. Geographical Revenue Analysis
26.2. Shell
26.3. Chevron
26.4. Baker Hughes
26.5. Halliburton
26.6. DuPont
26.7. BASF
26.8. 3M
26.9. Others
27. Research Methodology
27.1. Research Methodology
27.2. Phase I – Secondary Research
27.3. Phase II – Data Modelling
27.3.1. Company Share Analysis Model
27.3.2. Revenue Based Modelling
27.4. Phase III – Primary Research
27.5. Research Limitations
27.5.1. Assumptions

List of Figures
FIG. 1 Global Nanotechnology in Oil and gas Market: Research Methodology
FIG. 2 Market Size Estimation – Top Down & Bottom up Approach
FIG. 3 Global Nanotechnology in Oil and gas Market Segmentation
FIG. 4 Global Nanotechnology in Oil and gas Market, by Enhanced Oil Recovery (EOR), 2022 (US$ Mn)
FIG. 5 Global Nanotechnology in Oil and gas Market, by Drilling Fluids and Wellbore Stability, 2022 (US$ Mn)
FIG. 6 Global Nanotechnology in Oil and gas Market, by Corrosion Prevention and Control, 2022 (US$ Mn)
FIG. 7 Global Nanotechnology in Oil and gas Market, by Downhole Sensing and Monitoring, 2022 (US$ Mn)
FIG. 8 Global Nanotechnology in Oil and gas Market, by Water Treatment and Desalination, 2022 (US$ Mn)
FIG. 9 Global Nanotechnology in Oil and gas Market, by Nanotechnology in Cementing, 2022 (US$ Mn)
FIG. 10 Global Nanotechnology in Oil and gas Market, by Reservoir Imaging and Characterization, 2022 (US$ Mn)
FIG. 11 Global Nanotechnology in Oil and gas Market, by Environmental Management, 2022 (US$ Mn)
FIG. 12 Global Nanotechnology in Oil and gas Market, by Exploration and Seismic Imaging, 2022 (US$ Mn)
FIG. 13 Global Nanotechnology in Oil and gas Market, by Nanobots and Nanorobots, 2022 (US$ Mn)
FIG. 14 Global Nanotechnology in Oil and gas Market, by Catalysts for Upgrading Processes, 2022 (US$ Mn)
FIG. 15 Global Nanotechnology in Oil and gas Market, by Geography, 2022 (US$ Mn)
FIG. 16 Attractive Investment Proposition, by Enhanced Oil Recovery (EOR), 2022
FIG. 17 Attractive Investment Proposition, by Drilling Fluids and Wellbore Stability, 2022
FIG. 18 Attractive Investment Proposition, by Corrosion Prevention and Control, 2022
FIG. 19 Attractive Investment Proposition, by Downhole Sensing and Monitoring, 2022
FIG. 20 Attractive Investment Proposition, by Water Treatment and Desalination, 2022
FIG. 21 Attractive Investment Proposition, by Nanotechnology in Cementing, 2022
FIG. 22 Attractive Investment Proposition, by Reservoir Imaging and Characterization, 2022
FIG. 23 Attractive Investment Proposition, by Environmental Management, 2022
FIG. 24 Attractive Investment Proposition, by Exploration and Seismic Imaging, 2022
FIG. 25 Attractive Investment Proposition, by Nanobots and Nanorobots, 2022
FIG. 26 Attractive Investment Proposition, by Catalysts for Upgrading Processes, 2022
FIG. 27 Attractive Investment Proposition, by Geography, 2022
FIG. 28 Global Market Share Analysis of Key Nanotechnology in Oil and gas Market Manufacturers, 2022
FIG. 29 Global Market Positioning of Key Nanotechnology in Oil and gas Market Manufacturers, 2022
FIG. 30 Global Nanotechnology in Oil and gas Market Value Contribution, By Enhanced Oil Recovery (EOR), 2022 & 2030 (Value %)
FIG. 31 Global Nanotechnology in Oil and gas Market, by Nanofluids for Reservoir Stimulation, Value, 2017-2030 (US$ Mn)
FIG. 32 Global Nanotechnology in Oil and gas Market, by Smart Nanogels, Value, 2017-2030 (US$ Mn)
FIG. 33 Global Nanotechnology in Oil and gas Market Value Contribution, By Drilling Fluids and Wellbore Stability, 2022 & 2030 (Value %)
FIG. 34 Global Nanotechnology in Oil and gas Market, by Nanoparticle-Based Drilling Fluids, Value, 2017-2030 (US$ Mn)
FIG. 35 Global Nanotechnology in Oil and gas Market, by Nanocomposites for Wellbore Reinforcement, Value, 2017-2030 (US$ Mn)
FIG. 36 Global Nanotechnology in Oil and gas Market Value Contribution, By Corrosion Prevention and Control, 2022 & 2030 (Value %)
FIG. 37 Global Nanotechnology in Oil and gas Market, by Nanocoatings, Value, 2017-2030 (US$ Mn)
FIG. 38 Global Nanotechnology in Oil and gas Market, by Corrosion Inhibitors, Value, 2017-2030 (US$ Mn)
FIG. 39 Global Nanotechnology in Oil and gas Market Value Contribution, By Downhole Sensing and Monitoring, 2022 & 2030 (Value %)
FIG. 40 Global Nanotechnology in Oil and gas Market, by Nanomaterial-Based Sensors, Value, 2017-2030 (US$ Mn)
FIG. 41 Global Nanotechnology in Oil and gas Market, by Smart Nanomaterials, Value, 2017-2030 (US$ Mn)
FIG. 42 Global Nanotechnology in Oil and gas Market Value Contribution, By Water Treatment and Desalination, 2022 & 2030 (Value %)
FIG. 43 Global Nanotechnology in Oil and gas Market, by Nanofiltration and Nanomembranes, Value, 2017-2030 (US$ Mn)
FIG. 44 Global Nanotechnology in Oil and gas Market, by Nanoparticle-Based Adsorbents, Value, 2017-2030 (US$ Mn)
FIG. 45 Global Nanotechnology in Oil and gas Market Value Contribution, By Nanotechnology in Cementing, 2022 & 2030 (Value %)
FIG. 46 Global Nanotechnology in Oil and gas Market, by Nanoparticles in Cement Formulations, Value, 2017-2030 (US$ Mn)
FIG. 47 Global Nanotechnology in Oil and gas Market, by Strength and Durability Enhancement, Value, 2017-2030 (US$ Mn)
FIG. 48 Global Nanotechnology in Oil and gas Market Value Contribution, By Reservoir Imaging and Characterization, 2022 & 2030 (Value %)
FIG. 49 Global Nanotechnology in Oil and gas Market, by Nanoparticle Tracers, Value, 2017-2030 (US$ Mn)
FIG. 50 Global Nanotechnology in Oil and gas Market, by Nanoparticle-Enhanced Imaging Techniques, Value, 2017-2030 (US$ Mn)
FIG. 51 Global Nanotechnology in Oil and gas Market Value Contribution, By Environmental Management, 2022 & 2030 (Value %)
FIG. 52 Global Nanotechnology in Oil and gas Market, by Nanoremediation, Value, 2017-2030 (US$ Mn)
FIG. 53 Global Nanotechnology in Oil and gas Market, by Nanoparticle-Based Sorbents, Value, 2017-2030 (US$ Mn)
FIG. 54 Global Nanotechnology in Oil and gas Market Value Contribution, By Exploration and Seismic Imaging, 2022 & 2030 (Value %)
FIG. 55 Global Nanotechnology in Oil and gas Market, by Nanoparticles in Seismic Surveys, Value, 2017-2030 (US$ Mn)
FIG. 56 Global Nanotechnology in Oil and gas Market, by Improved Subsurface Imaging, Value, 2017-2030 (US$ Mn)
FIG. 57 Global Nanotechnology in Oil and gas Market Value Contribution, By Nanobots and Nanorobots, 2022 & 2030 (Value %)
FIG. 58 Global Nanotechnology in Oil and gas Market, by Nanorobotic Applications, Value, 2017-2030 (US$ Mn)
FIG. 59 Global Nanotechnology in Oil and gas Market Value Contribution, By Catalysts for Upgrading Processes, 2022 & 2030 (Value %)
FIG. 60 Global Nanotechnology in Oil and gas Market, by Nanocatalysts, Value, 2017-2030 (US$ Mn)
FIG. 61 North America Nanotechnology in Oil and gas Market, 2017-2030 (US$ Mn)
FIG. 62 U.S. Nanotechnology in Oil and gas Market, 2017-2030 (US$ Mn)
FIG. 63 Canada Nanotechnology in Oil and gas Market, 2017-2030 (US$ Mn)
FIG. 64 Mexico Nanotechnology in Oil and gas Market, 2017-2030 (US$ Mn)
FIG. 65 Europe Nanotechnology in Oil and gas Market, 2017-2030 (US$ Mn)
FIG. 66 Germany Nanotechnology in Oil and gas Market, 2017-2030 (US$ Mn)
FIG. 67 France Nanotechnology in Oil and gas Market, 2017-2030 (US$ Mn)
FIG. 68 U.K. Nanotechnology in Oil and gas Market, 2017-2030 (US$ Mn)
FIG. 69 Italy Nanotechnology in Oil and gas Market, 2017-2030 (US$ Mn)
FIG. 70 Spain Nanotechnology in Oil and gas Market, 2017-2030 (US$ Mn)
FIG. 71 Benelux Nanotechnology in Oil and gas Market, 2017-2030 (US$ Mn)
FIG. 72 Russia Nanotechnology in Oil and gas Market, 2017-2030 (US$ Mn)
FIG. 73 Rest of Europe Nanotechnology in Oil and gas Market, 2017-2030 (US$ Mn)
FIG. 74 Asia Pacific Nanotechnology in Oil and gas Market, 2017-2030 (US$ Mn)
FIG. 75 China Nanotechnology in Oil and gas Market, 2017-2030 (US$ Mn)
FIG. 76 Japan Nanotechnology in Oil and gas Market, 2017-2030 (US$ Mn)
FIG. 77 India Nanotechnology in Oil and gas Market, 2017-2030 (US$ Mn)
FIG. 78 South Korea Nanotechnology in Oil and gas Market, 2017-2030 (US$ Mn)
FIG. 79 South-East Asia Nanotechnology in Oil and gas Market, 2017-2030 (US$ Mn)
FIG. 80 Rest of Asia Pacific Nanotechnology in Oil and gas Market, 2017-2030 (US$ Mn)
FIG. 81 Latin America Nanotechnology in Oil and gas Market, 2017-2030 (US$ Mn)
FIG. 82 Brazil Nanotechnology in Oil and gas Market, 2017-2030 (US$ Mn)
FIG. 83 Argentina Nanotechnology in Oil and gas Market, 2017-2030 (US$ Mn)
FIG. 84 Rest of Latin America Nanotechnology in Oil and gas Market, 2017-2030 (US$ Mn)
FIG. 85 Middle East Nanotechnology in Oil and gas Market, 2017-2030 (US$ Mn)
FIG. 86 UAE Nanotechnology in Oil and gas Market, 2017-2030 (US$ Mn)
FIG. 87 Saudi Arabia Nanotechnology in Oil and gas Market, 2017-2030 (US$ Mn)
FIG. 88 Rest of Middle East Nanotechnology in Oil and gas Market, 2017-2030 (US$ Mn)
FIG. 89 Africa Nanotechnology in Oil and gas Market, 2017-2030 (US$ Mn)
FIG. 90 South Africa Nanotechnology in Oil and gas Market, 2017-2030 (US$ Mn)
FIG. 91 Egypt Nanotechnology in Oil and gas Market, 2017-2030 (US$ Mn)
FIG. 92 Rest of Africa Nanotechnology in Oil and gas Market, 2017-2030 (US$ Mn)

List of Tables
TABLE 1 Market Snapshot: Global Nanotechnology in Oil and gas Market
TABLE 2 Global Nanotechnology in Oil and gas Market: Market Drivers Impact Analysis
TABLE 3 Global Nanotechnology in Oil and gas Market: Market Restraints Impact Analysis
TABLE 4 Global Nanotechnology in Oil and gas Market, by Competitive Benchmarking, 2022
TABLE 5 Global Nanotechnology in Oil and gas Market, by Geographical Presence Analysis, 2022
TABLE 6 Global Nanotechnology in Oil and gas Market, by Key Strategies Analysis, 2022
TABLE 7 Global Nanotechnology in Oil and gas Market, by Nanofluids for Reservoir Stimulation, By Region, 2017-2022 (US$ Mn)
TABLE 8 Global Nanotechnology in Oil and gas Market, by Nanofluids for Reservoir Stimulation, By Region, 2023-2030 (US$ Mn)
TABLE 9 Global Nanotechnology in Oil and gas Market, by Smart Nanogels, By Region, 2017-2022 (US$ Mn)
TABLE 10 Global Nanotechnology in Oil and gas Market, by Smart Nanogels, By Region, 2023-2030 (US$ Mn)
TABLE 11 Global Nanotechnology in Oil and gas Market, by Nanoparticle-Based Drilling Fluids, By Region, 2017-2022 (US$ Mn)
TABLE 12 Global Nanotechnology in Oil and gas Market, by Nanoparticle-Based Drilling Fluids, By Region, 2023-2030 (US$ Mn)
TABLE 13 Global Nanotechnology in Oil and gas Market, by Nanocomposites for Wellbore Reinforcement, By Region, 2017-2022 (US$ Mn)
TABLE 14 Global Nanotechnology in Oil and gas Market, by Nanocomposites for Wellbore Reinforcement, By Region, 2023-2030 (US$ Mn)
TABLE 15 Global Nanotechnology in Oil and gas Market, by Nanocoatings, By Region, 2017-2022 (US$ Mn)
TABLE 16 Global Nanotechnology in Oil and gas Market, by Nanocoatings, By Region, 2023-2030 (US$ Mn)
TABLE 17 Global Nanotechnology in Oil and gas Market, by Corrosion Inhibitors, By Region, 2017-2022 (US$ Mn)
TABLE 18 Global Nanotechnology in Oil and gas Market, by Corrosion Inhibitors, By Region, 2023-2030 (US$ Mn)
TABLE 19 Global Nanotechnology in Oil and gas Market, by Nanomaterial-Based Sensors, By Region, 2017-2022 (US$ Mn)
TABLE 20 Global Nanotechnology in Oil and gas Market, by Nanomaterial-Based Sensors, By Region, 2023-2030 (US$ Mn)
TABLE 21 Global Nanotechnology in Oil and gas Market, by Smart Nanomaterials, By Region, 2017-2022 (US$ Mn)
TABLE 22 Global Nanotechnology in Oil and gas Market, by Smart Nanomaterials, By Region, 2023-2030 (US$ Mn)
TABLE 23 Global Nanotechnology in Oil and gas Market, by Nanofiltration and Nanomembranes, By Region, 2017-2022 (US$ Mn)
TABLE 24 Global Nanotechnology in Oil and gas Market, by Nanofiltration and Nanomembranes, By Region, 2023-2030 (US$ Mn)
TABLE 25 Global Nanotechnology in Oil and gas Market, by Nanoparticle-Based Adsorbents, By Region, 2017-2022 (US$ Mn)
TABLE 26 Global Nanotechnology in Oil and gas Market, by Nanoparticle-Based Adsorbents, By Region, 2023-2030 (US$ Mn)
TABLE 27 Global Nanotechnology in Oil and gas Market, by Nanoparticles in Cement Formulations, By Region, 2017-2022 (US$ Mn)
TABLE 28 Global Nanotechnology in Oil and gas Market, by Nanoparticles in Cement Formulations, By Region, 2023-2030 (US$ Mn)
TABLE 29 Global Nanotechnology in Oil and gas Market, by Strength and Durability Enhancement, By Region, 2017-2022 (US$ Mn)
TABLE 30 Global Nanotechnology in Oil and gas Market, by Strength and Durability Enhancement, By Region, 2023-2030 (US$ Mn)
TABLE 31 Global Nanotechnology in Oil and gas Market, by Nanoparticle Tracers, By Region, 2017-2022 (US$ Mn)
TABLE 32 Global Nanotechnology in Oil and gas Market, by Nanoparticle Tracers, By Region, 2023-2030 (US$ Mn)
TABLE 33 Global Nanotechnology in Oil and gas Market, by Nanoparticle-Enhanced Imaging Techniques, By Region, 2017-2022 (US$ Mn)
TABLE 34 Global Nanotechnology in Oil and gas Market, by Nanoparticle-Enhanced Imaging Techniques, By Region, 2023-2030 (US$ Mn)
TABLE 35 Global Nanotechnology in Oil and gas Market, by Nanoremediation, By Region, 2017-2022 (US$ Mn)
TABLE 36 Global Nanotechnology in Oil and gas Market, by Nanoremediation, By Region, 2023-2030 (US$ Mn)
TABLE 37 Global Nanotechnology in Oil and gas Market, by Nanoparticle-Based Sorbents, By Region, 2017-2022 (US$ Mn)
TABLE 38 Global Nanotechnology in Oil and gas Market, by Nanoparticle-Based Sorbents, By Region, 2023-2030 (US$ Mn)
TABLE 39 Global Nanotechnology in Oil and gas Market, by Nanoparticles in Seismic Surveys, By Region, 2017-2022 (US$ Mn)
TABLE 40 Global Nanotechnology in Oil and gas Market, by Nanoparticles in Seismic Surveys, By Region, 2023-2030 (US$ Mn)
TABLE 41 Global Nanotechnology in Oil and gas Market, by Improved Subsurface Imaging, By Region, 2017-2022 (US$ Mn)
TABLE 42 Global Nanotechnology in Oil and gas Market, by Improved Subsurface Imaging, By Region, 2023-2030 (US$ Mn)
TABLE 43 Global Nanotechnology in Oil and gas Market, by Nanorobotic Applications, By Region, 2017-2022 (US$ Mn)
TABLE 44 Global Nanotechnology in Oil and gas Market, by Nanorobotic Applications, By Region, 2023-2030 (US$ Mn)
TABLE 45 Global Nanotechnology in Oil and gas Market, by Nanocatalysts, By Region, 2017-2022 (US$ Mn)
TABLE 46 Global Nanotechnology in Oil and gas Market, by Nanocatalysts, By Region, 2023-2030 (US$ Mn)
TABLE 47 Global Nanotechnology in Oil and gas Market, by Enhanced Oil Recovery (EOR), 2017-2022 (US$ Mn)
TABLE 48 Global Nanotechnology in Oil and gas Market, by Enhanced Oil Recovery (EOR), 2023-2030 (US$ Mn)
TABLE 49 Global Nanotechnology in Oil and gas Market, by Drilling Fluids and Wellbore Stability, 2017-2022 (US$ Mn)
TABLE 50 Global Nanotechnology in Oil and gas Market, by Drilling Fluids and Wellbore Stability, 2023-2030 (US$ Mn)
TABLE 51 Global Nanotechnology in Oil and gas Market, by Corrosion Prevention and Control, 2017-2022 (US$ Mn)
TABLE 52 Global Nanotechnology in Oil and gas Market, by Corrosion Prevention and Control, 2023-2030 (US$ Mn)
TABLE 53 Global Nanotechnology in Oil and gas Market, by Downhole Sensing and Monitoring, 2017-2022 (US$ Mn)
TABLE 54 Global Nanotechnology in Oil and gas Market, by Downhole Sensing and Monitoring, 2023-2030 (US$ Mn)
TABLE 55 Global Nanotechnology in Oil and gas Market, by Water Treatment and Desalination, 2017-2022 (US$ Mn)
TABLE 56 Global Nanotechnology in Oil and gas Market, by Water Treatment and Desalination, 2023-2030 (US$ Mn)
TABLE 57 Global Nanotechnology in Oil and gas Market, by Nanotechnology in Cementing, 2017-2022 (US$ Mn)
TABLE 58 Global Nanotechnology in Oil and gas Market, by Nanotechnology in Cementing, 2023-2030 (US$ Mn)
TABLE 59 Global Nanotechnology in Oil and gas Market, by Reservoir Imaging and Characterization, 2017-2022 (US$ Mn)
TABLE 60 Global Nanotechnology in Oil and gas Market, by Reservoir Imaging and Characterization, 2023-2030 (US$ Mn)
TABLE 61 Global Nanotechnology in Oil and gas Market, by Environmental Management, 2017-2022 (US$ Mn)
TABLE 62 Global Nanotechnology in Oil and gas Market, by Environmental Management, 2023-2030 (US$ Mn)
TABLE 63 Global Nanotechnology in Oil and gas Market, by Exploration and Seismic Imaging, 2017-2022 (US$ Mn)
TABLE 64 Global Nanotechnology in Oil and gas Market, by Exploration and Seismic Imaging, 2023-2030 (US$ Mn)
TABLE 65 Global Nanotechnology in Oil and gas Market, by Nanobots and Nanorobots, 2017-2022 (US$ Mn)
TABLE 66 Global Nanotechnology in Oil and gas Market, by Nanobots and Nanorobots, 2023-2030 (US$ Mn)
TABLE 67 Global Nanotechnology in Oil and gas Market, by Catalysts for Upgrading Processes, 2017-2022 (US$ Mn)
TABLE 68 Global Nanotechnology in Oil and gas Market, by Catalysts for Upgrading Processes, 2023-2030 (US$ Mn)
TABLE 69 Global Nanotechnology in Oil and gas Market, by Region, 2017-2022 (US$ Mn)
TABLE 70 Global Nanotechnology in Oil and gas Market, by Region, 2023-2030 (US$ Mn)
TABLE 71 North America Nanotechnology in Oil and gas Market, by Enhanced Oil Recovery (EOR), 2017-2022 (US$ Mn)
TABLE 72 North America Nanotechnology in Oil and gas Market, by Enhanced Oil Recovery (EOR), 2023-2030 (US$ Mn)
TABLE 73 North America Nanotechnology in Oil and gas Market, by Drilling Fluids and Wellbore Stability, 2017-2022 (US$ Mn)
TABLE 74 North America Nanotechnology in Oil and gas Market, by Drilling Fluids and Wellbore Stability, 2023-2030 (US$ Mn)
TABLE 75 North America Nanotechnology in Oil and gas Market, by Corrosion Prevention and Control, 2017-2022 (US$ Mn)
TABLE 76 North America Nanotechnology in Oil and gas Market, by Corrosion Prevention and Control, 2023-2030 (US$ Mn)
TABLE 77 North America Nanotechnology in Oil and gas Market, by Downhole Sensing and Monitoring, 2017-2022 (US$ Mn)
TABLE 78 North America Nanotechnology in Oil and gas Market, by Downhole Sensing and Monitoring, 2023-2030 (US$ Mn)
TABLE 79 North America Nanotechnology in Oil and gas Market, by Water Treatment and Desalination, 2017-2022 (US$ Mn)
TABLE 80 North America Nanotechnology in Oil and gas Market, by Water Treatment and Desalination, 2023-2030 (US$ Mn)
TABLE 81 North America Nanotechnology in Oil and gas Market, by Nanotechnology in Cementing, 2017-2022 (US$ Mn)
TABLE 82 North America Nanotechnology in Oil and gas Market, by Nanotechnology in Cementing, 2023-2030 (US$ Mn)
TABLE 83 North America Nanotechnology in Oil and gas Market, by Reservoir Imaging and Characterization, 2017-2022 (US$ Mn)
TABLE 84 North America Nanotechnology in Oil and gas Market, by Reservoir Imaging and Characterization, 2023-2030 (US$ Mn)
TABLE 85 North America Nanotechnology in Oil and gas Market, by Environmental Management, 2017-2022 (US$ Mn)
TABLE 86 North America Nanotechnology in Oil and gas Market, by Environmental Management, 2023-2030 (US$ Mn)
TABLE 87 North America Nanotechnology in Oil and gas Market, by Exploration and Seismic Imaging, 2017-2022 (US$ Mn)
TABLE 88 North America Nanotechnology in Oil and gas Market, by Exploration and Seismic Imaging, 2023-2030 (US$ Mn)
TABLE 89 North America Nanotechnology in Oil and gas Market, by Nanobots and Nanorobots, 2017-2022 (US$ Mn)
TABLE 90 North America Nanotechnology in Oil and gas Market, by Nanobots and Nanorobots, 2023-2030 (US$ Mn)
TABLE 91 North America Nanotechnology in Oil and gas Market, by Catalysts for Upgrading Processes, 2017-2022 (US$ Mn)
TABLE 92 North America Nanotechnology in Oil and gas Market, by Catalysts for Upgrading Processes, 2023-2030 (US$ Mn)
TABLE 93 North America Nanotechnology in Oil and gas Market, by Country, 2017-2022 (US$ Mn)
TABLE 94 North America Nanotechnology in Oil and gas Market, by Country, 2023-2030 (US$ Mn)
TABLE 95 United States Nanotechnology in Oil and gas Market, by Enhanced Oil Recovery (EOR), 2017-2022 (US$ Mn)
TABLE 96 United States Nanotechnology in Oil and gas Market, by Enhanced Oil Recovery (EOR), 2023-2030 (US$ Mn)
TABLE 97 United States Nanotechnology in Oil and gas Market, by Drilling Fluids and Wellbore Stability, 2017-2022 (US$ Mn)
TABLE 98 United States Nanotechnology in Oil and gas Market, by Drilling Fluids and Wellbore Stability, 2023-2030 (US$ Mn)
TABLE 99 United States Nanotechnology in Oil and gas Market, by Corrosion Prevention and Control, 2017-2022 (US$ Mn)
TABLE 100 United States Nanotechnology in Oil and gas Market, by Corrosion Prevention and Control, 2023-2030 (US$ Mn)
TABLE 101 United States Nanotechnology in Oil and gas Market, by Downhole Sensing and Monitoring, 2017-2022 (US$ Mn)
TABLE 102 United States Nanotechnology in Oil and gas Market, by Downhole Sensing and Monitoring, 2023-2030 (US$ Mn)
TABLE 103 United States Nanotechnology in Oil and gas Market, by Water Treatment and Desalination, 2017-2022 (US$ Mn)
TABLE 104 United States Nanotechnology in Oil and gas Market, by Water Treatment and Desalination, 2023-2030 (US$ Mn)
TABLE 105 United States Nanotechnology in Oil and gas Market, by Nanotechnology in Cementing, 2017-2022 (US$ Mn)
TABLE 106 United States Nanotechnology in Oil and gas Market, by Nanotechnology in Cementing, 2023-2030 (US$ Mn)
TABLE 107 United States Nanotechnology in Oil and gas Market, by Reservoir Imaging and Characterization, 2017-2022 (US$ Mn)
TABLE 108 United States Nanotechnology in Oil and gas Market, by Reservoir Imaging and Characterization, 2023-2030 (US$ Mn)
TABLE 109 United States Nanotechnology in Oil and gas Market, by Environmental Management, 2017-2022 (US$ Mn)
TABLE 110 United States Nanotechnology in Oil and gas Market, by Environmental Management, 2023-2030 (US$ Mn)
TABLE 111 United States Nanotechnology in Oil and gas Market, by Exploration and Seismic Imaging, 2017-2022 (US$ Mn)
TABLE 112 United States Nanotechnology in Oil and gas Market, by Exploration and Seismic Imaging, 2023-2030 (US$ Mn)
TABLE 113 United States Nanotechnology in Oil and gas Market, by Nanobots and Nanorobots, 2017-2022 (US$ Mn)
TABLE 114 United States Nanotechnology in Oil and gas Market, by Nanobots and Nanorobots, 2023-2030 (US$ Mn)
TABLE 115 United States Nanotechnology in Oil and gas Market, by Catalysts for Upgrading Processes, 2017-2022 (US$ Mn)
TABLE 116 United States Nanotechnology in Oil and gas Market, by Catalysts for Upgrading Processes, 2023-2030 (US$ Mn)
TABLE 117 Canada Nanotechnology in Oil and gas Market, by Enhanced Oil Recovery (EOR), 2017-2022 (US$ Mn)
TABLE 118 Canada Nanotechnology in Oil and gas Market, by Enhanced Oil Recovery (EOR), 2023-2030 (US$ Mn)
TABLE 119 Canada Nanotechnology in Oil and gas Market, by Drilling Fluids and Wellbore Stability, 2017-2022 (US$ Mn)
TABLE 120 Canada Nanotechnology in Oil and gas Market, by Drilling Fluids and Wellbore Stability, 2023-2030 (US$ Mn)
TABLE 121 Canada Nanotechnology in Oil and gas Market, by Corrosion Prevention and Control, 2017-2022 (US$ Mn)
TABLE 122 Canada Nanotechnology in Oil and gas Market, by Corrosion Prevention and Control, 2023-2030 (US$ Mn)
TABLE 123 Canada Nanotechnology in Oil and gas Market, by Downhole Sensing and Monitoring, 2017-2022 (US$ Mn)
TABLE 124 Canada Nanotechnology in Oil and gas Market, by Downhole Sensing and Monitoring, 2023-2030 (US$ Mn)
TABLE 125 Canada Nanotechnology in Oil and gas Market, by Water Treatment and Desalination, 2017-2022 (US$ Mn)
TABLE 126 Canada Nanotechnology in Oil and gas Market, by Water Treatment and Desalination, 2023-2030 (US$ Mn)
TABLE 127 Canada Nanotechnology in Oil and gas Market, by Nanotechnology in Cementing, 2017-2022 (US$ Mn)
TABLE 128 Canada Nanotechnology in Oil and gas Market, by Nanotechnology in Cementing, 2023-2030 (US$ Mn)
TABLE 129 Canada Nanotechnology in Oil and gas Market, by Reservoir Imaging and Characterization, 2017-2022 (US$ Mn)
TABLE 130 Canada Nanotechnology in Oil and gas Market, by Reservoir Imaging and Characterization, 2023-2030 (US$ Mn)
TABLE 131 Canada Nanotechnology in Oil and gas Market, by Environmental Management, 2017-2022 (US$ Mn)
TABLE 132 Canada Nanotechnology in Oil and gas Market, by Environmental Management, 2023-2030 (US$ Mn)
TABLE 133 Canada Nanotechnology in Oil and gas Market, by Exploration and Seismic Imaging, 2017-2022 (US$ Mn)
TABLE 134 Canada Nanotechnology in Oil and gas Market, by Exploration and Seismic Imaging, 2023-2030 (US$ Mn)
TABLE 135 Canada Nanotechnology in Oil and gas Market, by Nanobots and Nanorobots, 2017-2022 (US$ Mn)
TABLE 136 Canada Nanotechnology in Oil and gas Market, by Nanobots and Nanorobots, 2023-2030 (US$ Mn)
TABLE 137 Canada Nanotechnology in Oil and gas Market, by Catalysts for Upgrading Processes, 2017-2022 (US$ Mn)
TABLE 138 Canada Nanotechnology in Oil and gas Market, by Catalysts for Upgrading Processes, 2023-2030 (US$ Mn)
TABLE 139 Mexico Nanotechnology in Oil and gas Market, by Enhanced Oil Recovery (EOR), 2017-2022 (US$ Mn)
TABLE 140 Mexico Nanotechnology in Oil and gas Market, by Enhanced Oil Recovery (EOR), 2023-2030 (US$ Mn)
TABLE 141 Mexico Nanotechnology in Oil and gas Market, by Drilling Fluids and Wellbore Stability, 2017-2022 (US$ Mn)
TABLE 142 Mexico Nanotechnology in Oil and gas Market, by Drilling Fluids and Wellbore Stability, 2023-2030 (US$ Mn)
TABLE 143 Mexico Nanotechnology in Oil and gas Market, by Corrosion Prevention and Control, 2017-2022 (US$ Mn)
TABLE 144 Mexico Nanotechnology in Oil and gas Market, by Corrosion Prevention and Control, 2023-2030 (US$ Mn)
TABLE 145 Mexico Nanotechnology in Oil and gas Market, by Downhole Sensing and Monitoring, 2017-2022 (US$ Mn)
TABLE 146 Mexico Nanotechnology in Oil and gas Market, by Downhole Sensing and Monitoring, 2023-2030 (US$ Mn)
TABLE 147 Mexico Nanotechnology in Oil and gas Market, by Water Treatment and Desalination, 2017-2022 (US$ Mn)
TABLE 148 Mexico Nanotechnology in Oil and gas Market, by Water Treatment and Desalination, 2023-2030 (US$ Mn)
TABLE 149 Mexico Nanotechnology in Oil and gas Market, by Nanotechnology in Cementing, 2017-2022 (US$ Mn)
TABLE 150 Mexico Nanotechnology in Oil and gas Market, by Nanotechnology in Cementing, 2023-2030 (US$ Mn)
TABLE 151 Mexico Nanotechnology in Oil and gas Market, by Reservoir Imaging and Characterization, 2017-2022 (US$ Mn)
TABLE 152 Mexico Nanotechnology in Oil and gas Market, by Reservoir Imaging and Characterization, 2023-2030 (US$ Mn)
TABLE 153 Mexico Nanotechnology in Oil and gas Market, by Environmental Management, 2017-2022 (US$ Mn)
TABLE 154 Mexico Nanotechnology in Oil and gas Market, by Environmental Management, 2023-2030 (US$ Mn)
TABLE 155 Mexico Nanotechnology in Oil and gas Market, by Exploration and Seismic Imaging, 2017-2022 (US$ Mn)
TABLE 156 Mexico Nanotechnology in Oil and gas Market, by Exploration and Seismic Imaging, 2023-2030 (US$ Mn)
TABLE 157 Mexico Nanotechnology in Oil and gas Market, by Nanobots and Nanorobots, 2017-2022 (US$ Mn)
TABLE 158 Mexico Nanotechnology in Oil and gas Market, by Nanobots and Nanorobots, 2023-2030 (US$ Mn)
TABLE 159 Mexico Nanotechnology in Oil and gas Market, by Catalysts for Upgrading Processes, 2017-2022 (US$ Mn)
TABLE 160 Mexico Nanotechnology in Oil and gas Market, by Catalysts for Upgrading Processes, 2023-2030 (US$ Mn)
TABLE 161 Europe Nanotechnology in Oil and gas Market, by Enhanced Oil Recovery (EOR), 2017-2022 (US$ Mn)
TABLE 162 Europe Nanotechnology in Oil and gas Market, by Enhanced Oil Recovery (EOR), 2023-2030 (US$ Mn)
TABLE 163 Europe Nanotechnology in Oil and gas Market, by Drilling Fluids and Wellbore Stability, 2017-2022 (US$ Mn)
TABLE 164 Europe Nanotechnology in Oil and gas Market, by Drilling Fluids and Wellbore Stability, 2023-2030 (US$ Mn)
TABLE 165 Europe Nanotechnology in Oil and gas Market, by Corrosion Prevention and Control, 2017-2022 (US$ Mn)
TABLE 166 Europe Nanotechnology in Oil and gas Market, by Corrosion Prevention and Control, 2023-2030 (US$ Mn)
TABLE 167 Europe Nanotechnology in Oil and gas Market, by Downhole Sensing and Monitoring, 2017-2022 (US$ Mn)
TABLE 168 Europe Nanotechnology in Oil and gas Market, by Downhole Sensing and Monitoring, 2023-2030 (US$ Mn)
TABLE 169 Europe Nanotechnology in Oil and gas Market, by Water Treatment and Desalination, 2017-2022 (US$ Mn)
TABLE 170 Europe Nanotechnology in Oil and gas Market, by Water Treatment and Desalination, 2023-2030 (US$ Mn)
TABLE 171 Europe Nanotechnology in Oil and gas Market, by Nanotechnology in Cementing, 2017-2022 (US$ Mn)
TABLE 172 Europe Nanotechnology in Oil and gas Market, by Nanotechnology in Cementing, 2023-2030 (US$ Mn)
TABLE 173 Europe Nanotechnology in Oil and gas Market, by Reservoir Imaging and Characterization, 2017-2022 (US$ Mn)
TABLE 174 Europe Nanotechnology in Oil and gas Market, by Reservoir Imaging and Characterization, 2023-2030 (US$ Mn)
TABLE 175 Europe Nanotechnology in Oil and gas Market, by Environmental Management, 2017-2022 (US$ Mn)
TABLE 176 Europe Nanotechnology in Oil and gas Market, by Environmental Management, 2023-2030 (US$ Mn)
TABLE 177 Europe Nanotechnology in Oil and gas Market, by Exploration and Seismic Imaging, 2017-2022 (US$ Mn)
TABLE 178 Europe Nanotechnology in Oil and gas Market, by Exploration and Seismic Imaging, 2023-2030 (US$ Mn)
TABLE 179 Europe Nanotechnology in Oil and gas Market, by Nanobots and Nanorobots, 2017-2022 (US$ Mn)
TABLE 180 Europe Nanotechnology in Oil and gas Market, by Nanobots and Nanorobots, 2023-2030 (US$ Mn)
TABLE 181 Europe Nanotechnology in Oil and gas Market, by Catalysts for Upgrading Processes, 2017-2022 (US$ Mn)
TABLE 182 Europe Nanotechnology in Oil and gas Market, by Catalysts for Upgrading Processes, 2023-2030 (US$ Mn)
TABLE 183 Europe Nanotechnology in Oil and gas Market, by Country, 2017-2022 (US$ Mn)
TABLE 184 Europe Nanotechnology in Oil and gas Market, by Country, 2023-2030 (US$ Mn)
TABLE 185 Germany Nanotechnology in Oil and gas Market, by Enhanced Oil Recovery (EOR), 2017-2022 (US$ Mn)
TABLE 186 Germany Nanotechnology in Oil and gas Market, by Enhanced Oil Recovery (EOR), 2023-2030 (US$ Mn)
TABLE 187 Germany Nanotechnology in Oil and gas Market, by Drilling Fluids and Wellbore Stability, 2017-2022 (US$ Mn)
TABLE 188 Germany Nanotechnology in Oil and gas Market, by Drilling Fluids and Wellbore Stability, 2023-2030 (US$ Mn)
TABLE 189 Germany Nanotechnology in Oil and gas Market, by Corrosion Prevention and Control, 2017-2022 (US$ Mn)
TABLE 190 Germany Nanotechnology in Oil and gas Market, by Corrosion Prevention and Control, 2023-2030 (US$ Mn)
TABLE 191 Germany Nanotechnology in Oil and gas Market, by Downhole Sensing and Monitoring, 2017-2022 (US$ Mn)
TABLE 192 Germany Nanotechnology in Oil and gas Market, by Downhole Sensing and Monitoring, 2023-2030 (US$ Mn)
TABLE 193 Germany Nanotechnology in Oil and gas Market, by Water Treatment and Desalination, 2017-2022 (US$ Mn)
TABLE 194 Germany Nanotechnology in Oil and gas Market, by Water Treatment and Desalination, 2023-2030 (US$ Mn)
TABLE 195 Germany Nanotechnology in Oil and gas Market, by Nanotechnology in Cementing, 2017-2022 (US$ Mn)
TABLE 196 Germany Nanotechnology in Oil and gas Market, by Nanotechnology in Cementing, 2023-2030 (US$ Mn)
TABLE 197 Germany Nanotechnology in Oil and gas Market, by Reservoir Imaging and Characterization, 2017-2022 (US$ Mn)
TABLE 198 Germany Nanotechnology in Oil and gas Market, by Reservoir Imaging and Characterization, 2023-2030 (US$ Mn)
TABLE 199 Germany Nanotechnology in Oil and gas Market, by Environmental Management, 2017-2022 (US$ Mn)
TABLE 200 Germany Nanotechnology in Oil and gas Market, by Environmental Management, 2023-2030 (US$ Mn)
TABLE 201 Germany Nanotechnology in Oil and gas Market, by Exploration and Seismic Imaging, 2017-2022 (US$ Mn)
TABLE 202 Germany Nanotechnology in Oil and gas Market, by Exploration and Seismic Imaging, 2023-2030 (US$ Mn)
TABLE 203 Germany Nanotechnology in Oil and gas Market, by Nanobots and Nanorobots, 2017-2022 (US$ Mn)
TABLE 204 Germany Nanotechnology in Oil and gas Market, by Nanobots and Nanorobots, 2023-2030 (US$ Mn)
TABLE 205 Germany Nanotechnology in Oil and gas Market, by Catalysts for Upgrading Processes, 2017-2022 (US$ Mn)
TABLE 206 Germany Nanotechnology in Oil and gas Market, by Catalysts for Upgrading Processes, 2023-2030 (US$ Mn)
TABLE 207 France Nanotechnology in Oil and gas Market, by Enhanced Oil Recovery (EOR), 2017-2022 (US$ Mn)
TABLE 208 France Nanotechnology in Oil and gas Market, by Enhanced Oil Recovery (EOR), 2023-2030 (US$ Mn)
TABLE 209 France Nanotechnology in Oil and gas Market, by Drilling Fluids and Wellbore Stability, 2017-2022 (US$ Mn)
TABLE 210 France Nanotechnology in Oil and gas Market, by Drilling Fluids and Wellbore Stability, 2023-2030 (US$ Mn)
TABLE 211 France Nanotechnology in Oil and gas Market, by Corrosion Prevention and Control, 2017-2022 (US$ Mn)
TABLE 212 France Nanotechnology in Oil and gas Market, by Corrosion Prevention and Control, 2023-2030 (US$ Mn)
TABLE 213 France Nanotechnology in Oil and gas Market, by Downhole Sensing and Monitoring, 2017-2022 (US$ Mn)
TABLE 214 France Nanotechnology in Oil and gas Market, by Downhole Sensing and Monitoring, 2023-2030 (US$ Mn)
TABLE 215 France Nanotechnology in Oil and gas Market, by Water Treatment and Desalination, 2017-2022 (US$ Mn)
TABLE 216 France Nanotechnology in Oil and gas Market, by Water Treatment and Desalination, 2023-2030 (US$ Mn)
TABLE 217 France Nanotechnology in Oil and gas Market, by Nanotechnology in Cementing, 2017-2022 (US$ Mn)
TABLE 218 France Nanotechnology in Oil and gas Market, by Nanotechnology in Cementing, 2023-2030 (US$ Mn)
TABLE 219 France Nanotechnology in Oil and gas Market, by Reservoir Imaging and Characterization, 2017-2022 (US$ Mn)
TABLE 220 France Nanotechnology in Oil and gas Market, by Reservoir Imaging and Characterization, 2023-2030 (US$ Mn)
TABLE 221 France Nanotechnology in Oil and gas Market, by Environmental Management, 2017-2022 (US$ Mn)
TABLE 222 France Nanotechnology in Oil and gas Market, by Environmental Management, 2023-2030 (US$ Mn)
TABLE 223 France Nanotechnology in Oil and gas Market, by Exploration and Seismic Imaging, 2017-2022 (US$ Mn)
TABLE 224 France Nanotechnology in Oil and gas Market, by Exploration and Seismic Imaging, 2023-2030 (US$ Mn)
TABLE 225 France Nanotechnology in Oil and gas Market, by Nanobots and Nanorobots, 2017-2022 (US$ Mn)
TABLE 226 France Nanotechnology in Oil and gas Market, by Nanobots and Nanorobots, 2023-2030 (US$ Mn)
TABLE 227 France Nanotechnology in Oil and gas Market, by Catalysts for Upgrading Processes, 2017-2022 (US$ Mn)
TABLE 228 France Nanotechnology in Oil and gas Market, by Catalysts for Upgrading Processes, 2023-2030 (US$ Mn)
TABLE 229 United Kingdom Nanotechnology in Oil and gas Market, by Enhanced Oil Recovery (EOR), 2017-2022 (US$ Mn)
TABLE 230 United Kingdom Nanotechnology in Oil and gas Market, by Enhanced Oil Recovery (EOR), 2023-2030 (US$ Mn)
TABLE 231 United Kingdom Nanotechnology in Oil and gas Market, by Drilling Fluids and Wellbore Stability, 2017-2022 (US$ Mn)
TABLE 232 United Kingdom Nanotechnology in Oil and gas Market, by Drilling Fluids and Wellbore Stability, 2023-2030 (US$ Mn)
TABLE 233 United Kingdom Nanotechnology in Oil and gas Market, by Corrosion Prevention and Control, 2017-2022 (US$ Mn)
TABLE 234 United Kingdom Nanotechnology in Oil and gas Market, by Corrosion Prevention and Control, 2023-2030 (US$ Mn)
TABLE 235 United Kingdom Nanotechnology in Oil and gas Market, by Downhole Sensing and Monitoring, 2017-2022 (US$ Mn)
TABLE 236 United Kingdom Nanotechnology in Oil and gas Market, by Downhole Sensing and Monitoring, 2023-2030 (US$ Mn)
TABLE 237 United Kingdom Nanotechnology in Oil and gas Market, by Water Treatment and Desalination, 2017-2022 (US$ Mn)
TABLE 238 United Kingdom Nanotechnology in Oil and gas Market, by Water Treatment and Desalination, 2023-2030 (US$ Mn)
TABLE 239 United Kingdom Nanotechnology in Oil and gas Market, by Nanotechnology in Cementing, 2017-2022 (US$ Mn)
TABLE 240 United Kingdom Nanotechnology in Oil and gas Market, by Nanotechnology in Cementing, 2023-2030 (US$ Mn)
TABLE 241 United Kingdom Nanotechnology in Oil and gas Market, by Reservoir Imaging and Characterization, 2017-2022 (US$ Mn)
TABLE 242 United Kingdom Nanotechnology in Oil and gas Market, by Reservoir Imaging and Characterization, 2023-2030 (US$ Mn)
TABLE 243 United Kingdom Nanotechnology in Oil and gas Market, by Environmental Management, 2017-2022 (US$ Mn)
TABLE 244 United Kingdom Nanotechnology in Oil and gas Market, by Environmental Management, 2023-2030 (US$ Mn)
TABLE 245 United Kingdom Nanotechnology in Oil and gas Market, by Exploration and Seismic Imaging, 2017-2022 (US$ Mn)
TABLE 246 United Kingdom Nanotechnology in Oil and gas Market, by Exploration and Seismic Imaging, 2023-2030 (US$ Mn)
TABLE 247 United Kingdom Nanotechnology in Oil and gas Market, by Nanobots and Nanorobots, 2017-2022 (US$ Mn)
TABLE 248 United Kingdom Nanotechnology in Oil and gas Market, by Nanobots and Nanorobots, 2023-2030 (US$ Mn)
TABLE 249 United Kingdom Nanotechnology in Oil and gas Market, by Catalysts for Upgrading Processes, 2017-2022 (US$ Mn)
TABLE 250 United Kingdom Nanotechnology in Oil and gas Market, by Catalysts for Upgrading Processes, 2023-2030 (US$ Mn)
TABLE 251 Italy Nanotechnology in Oil and gas Market, by Enhanced Oil Recovery (EOR), 2017-2022 (US$ Mn)
TABLE 252 Italy Nanotechnology in Oil and gas Market, by Enhanced Oil Recovery (EOR), 2023-2030 (US$ Mn)
TABLE 253 Italy Nanotechnology in Oil and gas Market, by Drilling Fluids and Wellbore Stability, 2017-2022 (US$ Mn)
TABLE 254 Italy Nanotechnology in Oil and gas Market, by Drilling Fluids and Wellbore Stability, 2023-2030 (US$ Mn)
TABLE 255 Italy Nanotechnology in Oil and gas Market, by Corrosion Prevention and Control, 2017-2022 (US$ Mn)
TABLE 256 Italy Nanotechnology in Oil and gas Market, by Corrosion Prevention and Control, 2023-2030 (US$ Mn)
TABLE 257 Italy Nanotechnology in Oil and gas Market, by Downhole Sensing and Monitoring, 2017-2022 (US$ Mn)
TABLE 258 Italy Nanotechnology in Oil and gas Market, by Downhole Sensing and Monitoring, 2023-2030 (US$ Mn)
TABLE 259 Italy Nanotechnology in Oil and gas Market, by Water Treatment and Desalination, 2017-2022 (US$ Mn)
TABLE 260 Italy Nanotechnology in Oil and gas Market, by Water Treatment and Desalination, 2023-2030 (US$ Mn)
TABLE 261 Italy Nanotechnology in Oil and gas Market, by Nanotechnology in Cementing, 2017-2022 (US$ Mn)
TABLE 262 Italy Nanotechnology in Oil and gas Market, by Nanotechnology in Cementing, 2023-2030 (US$ Mn)
TABLE 263 Italy Nanotechnology in Oil and gas Market, by Reservoir Imaging and Characterization, 2017-2022 (US$ Mn)
TABLE 264 Italy Nanotechnology in Oil and gas Market, by Reservoir Imaging and Characterization, 2023-2030 (US$ Mn)
TABLE 265 Italy Nanotechnology in Oil and gas Market, by Environmental Management, 2017-2022 (US$ Mn)
TABLE 266 Italy Nanotechnology in Oil and gas Market, by Environmental Management, 2023-2030 (US$ Mn)
TABLE 267 Italy Nanotechnology in Oil and gas Market, by Exploration and Seismic Imaging, 2017-2022 (US$ Mn)
TABLE 268 Italy Nanotechnology in Oil and gas Market, by Exploration and Seismic Imaging, 2023-2030 (US$ Mn)
TABLE 269 Italy Nanotechnology in Oil and gas Market, by Nanobots and Nanorobots, 2017-2022 (US$ Mn)
TABLE 270 Italy Nanotechnology in Oil and gas Market, by Nanobots and Nanorobots, 2023-2030 (US$ Mn)
TABLE 271 Italy Nanotechnology in Oil and gas Market, by Catalysts for Upgrading Processes, 2017-2022 (US$ Mn)
TABLE 272 Italy Nanotechnology in Oil and gas Market, by Catalysts for Upgrading Processes, 2023-2030 (US$ Mn)
TABLE 273 Spain Nanotechnology in Oil and gas Market, by Enhanced Oil Recovery (EOR), 2017-2022 (US$ Mn)
TABLE 274 Spain Nanotechnology in Oil and gas Market, by Enhanced Oil Recovery (EOR), 2023-2030 (US$ Mn)
TABLE 275 Spain Nanotechnology in Oil and gas Market, by Drilling Fluids and Wellbore Stability, 2017-2022 (US$ Mn)
TABLE 276 Spain Nanotechnology in Oil and gas Market, by Drilling Fluids and Wellbore Stability, 2023-2030 (US$ Mn)
TABLE 277 Spain Nanotechnology in Oil and gas Market, by Corrosion Prevention and Control, 2017-2022 (US$ Mn)
TABLE 278 Spain Nanotechnology in Oil and gas Market, by Corrosion Prevention and Control, 2023-2030 (US$ Mn)
TABLE 279 Spain Nanotechnology in Oil and gas Market, by Downhole Sensing and Monitoring, 2017-2022 (US$ Mn)
TABLE 280 Spain Nanotechnology in Oil and gas Market, by Downhole Sensing and Monitoring, 2023-2030 (US$ Mn)
TABLE 281 Spain Nanotechnology in Oil and gas Market, by Water Treatment and Desalination, 2017-2022 (US$ Mn)
TABLE 282 Spain Nanotechnology in Oil and gas Market, by Water Treatment and Desalination, 2023-2030 (US$ Mn)
TABLE 283 Spain Nanotechnology in Oil and gas Market, by Nanotechnology in Cementing, 2017-2022 (US$ Mn)
TABLE 284 Spain Nanotechnology in Oil and gas Market, by Nanotechnology in Cementing, 2023-2030 (US$ Mn)
TABLE 285 Spain Nanotechnology in Oil and gas Market, by Reservoir Imaging and Characterization, 2017-2022 (US$ Mn)
TABLE 286 Spain Nanotechnology in Oil and gas Market, by Reservoir Imaging and Characterization, 2023-2030 (US$ Mn)
TABLE 287 Spain Nanotechnology in Oil and gas Market, by Environmental Management, 2017-2022 (US$ Mn)
TABLE 288 Spain Nanotechnology in Oil and gas Market, by Environmental Management, 2023-2030 (US$ Mn)
TABLE 289 Spain Nanotechnology in Oil and gas Market, by Exploration and Seismic Imaging, 2017-2022 (US$ Mn)
TABLE 290 Spain Nanotechnology in Oil and gas Market, by Exploration and Seismic Imaging, 2023-2030 (US$ Mn)
TABLE 291 Spain Nanotechnology in Oil and gas Market, by Nanobots and Nanorobots, 2017-2022 (US$ Mn)
TABLE 292 Spain Nanotechnology in Oil and gas Market, by Nanobots and Nanorobots, 2023-2030 (US$ Mn)
TABLE 293 Spain Nanotechnology in Oil and gas Market, by Catalysts for Upgrading Processes, 2017-2022 (US$ Mn)
TABLE 294 Spain Nanotechnology in Oil and gas Market, by Catalysts for Upgrading Processes, 2023-2030 (US$ Mn)
TABLE 295 Benelux Nanotechnology in Oil and gas Market, by Enhanced Oil Recovery (EOR), 2017-2022 (US$ Mn)
TABLE 296 Benelux Nanotechnology in Oil and gas Market, by Enhanced Oil Recovery (EOR), 2023-2030 (US$ Mn)
TABLE 297 Benelux Nanotechnology in Oil and gas Market, by Drilling Fluids and Wellbore Stability, 2017-2022 (US$ Mn)
TABLE 298 Benelux Nanotechnology in Oil and gas Market, by Drilling Fluids and Wellbore Stability, 2023-2030 (US$ Mn)
TABLE 299 Benelux Nanotechnology in Oil and gas Market, by Corrosion Prevention and Control, 2017-2022 (US$ Mn)
TABLE 300 Benelux Nanotechnology in Oil and gas Market, by Corrosion Prevention and Control, 2023-2030 (US$ Mn)
TABLE 301 Benelux Nanotechnology in Oil and gas Market, by Downhole Sensing and Monitoring, 2017-2022 (US$ Mn)
TABLE 302 Benelux Nanotechnology in Oil and gas Market, by Downhole Sensing and Monitoring, 2023-2030 (US$ Mn)
TABLE 303 Benelux Nanotechnology in Oil and gas Market, by Water Treatment and Desalination, 2017-2022 (US$ Mn)
TABLE 304 Benelux Nanotechnology in Oil and gas Market, by Water Treatment and Desalination, 2023-2030 (US$ Mn)
TABLE 305 Benelux Nanotechnology in Oil and gas Market, by Nanotechnology in Cementing, 2017-2022 (US$ Mn)
TABLE 306 Benelux Nanotechnology in Oil and gas Market, by Nanotechnology in Cementing, 2023-2030 (US$ Mn)
TABLE 307 Benelux Nanotechnology in Oil and gas Market, by Reservoir Imaging and Characterization, 2017-2022 (US$ Mn)
TABLE 308 Benelux Nanotechnology in Oil and gas Market, by Reservoir Imaging and Characterization, 2023-2030 (US$ Mn)
TABLE 309 Benelux Nanotechnology in Oil and gas Market, by Environmental Management, 2017-2022 (US$ Mn)
TABLE 310 Benelux Nanotechnology in Oil and gas Market, by Environmental Management, 2023-2030 (US$ Mn)
TABLE 311 Benelux Nanotechnology in Oil and gas Market, by Exploration and Seismic Imaging, 2017-2022 (US$ Mn)
TABLE 312 Benelux Nanotechnology in Oil and gas Market, by Exploration and Seismic Imaging, 2023-2030 (US$ Mn)
TABLE 313 Benelux Nanotechnology in Oil and gas Market, by Nanobots and Nanorobots, 2017-2022 (US$ Mn)
TABLE 314 Benelux Nanotechnology in Oil and gas Market, by Nanobots and Nanorobots, 2023-2030 (US$ Mn)
TABLE 315 Benelux Nanotechnology in Oil and gas Market, by Catalysts for Upgrading Processes, 2017-2022 (US$ Mn)
TABLE 316 Benelux Nanotechnology in Oil and gas Market, by Catalysts for Upgrading Processes, 2023-2030 (US$ Mn)
TABLE 317 Russia Nanotechnology in Oil and gas Market, by Enhanced Oil Recovery (EOR), 2017-2022 (US$ Mn)
TABLE 318 Russia Nanotechnology in Oil and gas Market, by Enhanced Oil Recovery (EOR), 2023-2030 (US$ Mn)
TABLE 319 Russia Nanotechnology in Oil and gas Market, by Drilling Fluids and Wellbore Stability, 2017-2022 (US$ Mn)
TABLE 320 Russia Nanotechnology in Oil and gas Market, by Drilling Fluids and Wellbore Stability, 2023-2030 (US$ Mn)
TABLE 321 Russia Nanotechnology in Oil and gas Market, by Corrosion Prevention and Control, 2017-2022 (US$ Mn)
TABLE 322 Russia Nanotechnology in Oil and gas Market, by Corrosion Prevention and Control, 2023-2030 (US$ Mn)
TABLE 323 Russia Nanotechnology in Oil and gas Market, by Downhole Sensing and Monitoring, 2017-2022 (US$ Mn)
TABLE 324 Russia Nanotechnology in Oil and gas Market, by Downhole Sensing and Monitoring, 2023-2030 (US$ Mn)
TABLE 325 Russia Nanotechnology in Oil and gas Market, by Water Treatment and Desalination, 2017-2022 (US$ Mn)
TABLE 326 Russia Nanotechnology in Oil and gas Market, by Water Treatment and Desalination, 2023-2030 (US$ Mn)
TABLE 327 Russia Nanotechnology in Oil and gas Market, by Nanotechnology in Cementing, 2017-2022 (US$ Mn)
TABLE 328 Russia Nanotechnology in Oil and gas Market, by Nanotechnology in Cementing, 2023-2030 (US$ Mn)
TABLE 329 Russia Nanotechnology in Oil and gas Market, by Reservoir Imaging and Characterization, 2017-2022 (US$ Mn)
TABLE 330 Russia Nanotechnology in Oil and gas Market, by Reservoir Imaging and Characterization, 2023-2030 (US$ Mn)
TABLE 331 Russia Nanotechnology in Oil and gas Market, by Environmental Management, 2017-2022 (US$ Mn)
TABLE 332 Russia Nanotechnology in Oil and gas Market, by Environmental Management, 2023-2030 (US$ Mn)
TABLE 333 Russia Nanotechnology in Oil and gas Market, by Exploration and Seismic Imaging, 2017-2022 (US$ Mn)
TABLE 334 Russia Nanotechnology in Oil and gas Market, by Exploration and Seismic Imaging, 2023-2030 (US$ Mn)
TABLE 335 Russia Nanotechnology in Oil and gas Market, by Nanobots and Nanorobots, 2017-2022 (US$ Mn)
TABLE 336 Russia Nanotechnology in Oil and gas Market, by Nanobots and Nanorobots, 2023-2030 (US$ Mn)
TABLE 337 Russia Nanotechnology in Oil and gas Market, by Catalysts for Upgrading Processes, 2017-2022 (US$ Mn)
TABLE 338 Russia Nanotechnology in Oil and gas Market, by Catalysts for Upgrading Processes, 2023-2030 (US$ Mn)
TABLE 339 Rest of Europe Nanotechnology in Oil and gas Market, by Enhanced Oil Recovery (EOR), 2017-2022 (US$ Mn)
TABLE 340 Rest of Europe Nanotechnology in Oil and gas Market, by Enhanced Oil Recovery (EOR), 2023-2030 (US$ Mn)
TABLE 341 Rest of Europe Nanotechnology in Oil and gas Market, by Drilling Fluids and Wellbore Stability, 2017-2022 (US$ Mn)
TABLE 342 Rest of Europe Nanotechnology in Oil and gas Market, by Drilling Fluids and Wellbore Stability, 2023-2030 (US$ Mn)
TABLE 343 Rest of Europe Nanotechnology in Oil and gas Market, by Corrosion Prevention and Control, 2017-2022 (US$ Mn)
TABLE 344 Rest of Europe Nanotechnology in Oil and gas Market, by Corrosion Prevention and Control, 2023-2030 (US$ Mn)
TABLE 345 Rest of Europe Nanotechnology in Oil and gas Market, by Downhole Sensing and Monitoring, 2017-2022 (US$ Mn)
TABLE 346 Rest of Europe Nanotechnology in Oil and gas Market, by Downhole Sensing and Monitoring, 2023-2030 (US$ Mn)
TABLE 347 Rest of Europe Nanotechnology in Oil and gas Market, by Water Treatment and Desalination, 2017-2022 (US$ Mn)
TABLE 348 Rest of Europe Nanotechnology in Oil and gas Market, by Water Treatment and Desalination, 2023-2030 (US$ Mn)
TABLE 349 Rest of Europe Nanotechnology in Oil and gas Market, by Nanotechnology in Cementing, 2017-2022 (US$ Mn)
TABLE 350 Rest of Europe Nanotechnology in Oil and gas Market, by Nanotechnology in Cementing, 2023-2030 (US$ Mn)
TABLE 351 Rest of Europe Nanotechnology in Oil and gas Market, by Reservoir Imaging and Characterization, 2017-2022 (US$ Mn)
TABLE 352 Rest of Europe Nanotechnology in Oil and gas Market, by Reservoir Imaging and Characterization, 2023-2030 (US$ Mn)
TABLE 353 Rest of Europe Nanotechnology in Oil and gas Market, by Environmental Management, 2017-2022 (US$ Mn)
TABLE 354 Rest of Europe Nanotechnology in Oil and gas Market, by Environmental Management, 2023-2030 (US$ Mn)
TABLE 355 Rest of Europe Nanotechnology in Oil and gas Market, by Exploration and Seismic Imaging, 2017-2022 (US$ Mn)
TABLE 356 Rest of Europe Nanotechnology in Oil and gas Market, by Exploration and Seismic Imaging, 2023-2030 (US$ Mn)
TABLE 357 Rest of Europe Nanotechnology in Oil and gas Market, by Nanobots and Nanorobots, 2017-2022 (US$ Mn)
TABLE 358 Rest of Europe Nanotechnology in Oil and gas Market, by Nanobots and Nanorobots, 2023-2030 (US$ Mn)
TABLE 359 Rest of Europe Nanotechnology in Oil and gas Market, by Catalysts for Upgrading Processes, 2017-2022 (US$ Mn)
TABLE 360 Rest of Europe Nanotechnology in Oil and gas Market, by Catalysts for Upgrading Processes, 2023-2030 (US$ Mn)
TABLE 361 Asia Pacific Nanotechnology in Oil and gas Market, by Enhanced Oil Recovery (EOR), 2017-2022 (US$ Mn)
TABLE 362 Asia Pacific Nanotechnology in Oil and gas Market, by Enhanced Oil Recovery (EOR), 2023-2030 (US$ Mn)
TABLE 363 Asia Pacific Nanotechnology in Oil and gas Market, by Drilling Fluids and Wellbore Stability, 2017-2022 (US$ Mn)
TABLE 364 Asia Pacific Nanotechnology in Oil and gas Market, by Drilling Fluids and Wellbore Stability, 2023-2030 (US$ Mn)
TABLE 365 Asia Pacific Nanotechnology in Oil and gas Market, by Corrosion Prevention and Control, 2017-2022 (US$ Mn)
TABLE 366 Asia Pacific Nanotechnology in Oil and gas Market, by Corrosion Prevention and Control, 2023-2030 (US$ Mn)
TABLE 367 Asia Pacific Nanotechnology in Oil and gas Market, by Downhole Sensing and Monitoring, 2017-2022 (US$ Mn)
TABLE 368 Asia Pacific Nanotechnology in Oil and gas Market, by Downhole Sensing and Monitoring, 2023-2030 (US$ Mn)
TABLE 369 Asia Pacific Nanotechnology in Oil and gas Market, by Water Treatment and Desalination, 2017-2022 (US$ Mn)
TABLE 370 Asia Pacific Nanotechnology in Oil and gas Market, by Water Treatment and Desalination, 2023-2030 (US$ Mn)
TABLE 371 Asia Pacific Nanotechnology in Oil and gas Market, by Nanotechnology in Cementing, 2017-2022 (US$ Mn)
TABLE 372 Asia Pacific Nanotechnology in Oil and gas Market, by Nanotechnology in Cementing, 2023-2030 (US$ Mn)
TABLE 373 Asia Pacific Nanotechnology in Oil and gas Market, by Reservoir Imaging and Characterization, 2017-2022 (US$ Mn)
TABLE 374 Asia Pacific Nanotechnology in Oil and gas Market, by Reservoir Imaging and Characterization, 2023-2030 (US$ Mn)
TABLE 375 Asia Pacific Nanotechnology in Oil and gas Market, by Environmental Management, 2017-2022 (US$ Mn)
TABLE 376 Asia Pacific Nanotechnology in Oil and gas Market, by Environmental Management, 2023-2030 (US$ Mn)
TABLE 377 Asia Pacific Nanotechnology in Oil and gas Market, by Exploration and Seismic Imaging, 2017-2022 (US$ Mn)
TABLE 378 Asia Pacific Nanotechnology in Oil and gas Market, by Exploration and Seismic Imaging, 2023-2030 (US$ Mn)
TABLE 379 Asia Pacific Nanotechnology in Oil and gas Market, by Nanobots and Nanorobots, 2017-2022 (US$ Mn)
TABLE 380 Asia Pacific Nanotechnology in Oil and gas Market, by Nanobots and Nanorobots, 2023-2030 (US$ Mn)
TABLE 381 Asia Pacific Nanotechnology in Oil and gas Market, by Catalysts for Upgrading Processes, 2017-2022 (US$ Mn)
TABLE 382 Asia Pacific Nanotechnology in Oil and gas Market, by Catalysts for Upgrading Processes, 2023-2030 (US$ Mn)
TABLE 383 China Nanotechnology in Oil and gas Market, by Enhanced Oil Recovery (EOR), 2017-2022 (US$ Mn)
TABLE 384 China Nanotechnology in Oil and gas Market, by Enhanced Oil Recovery (EOR), 2023-2030 (US$ Mn)
TABLE 385 China Nanotechnology in Oil and gas Market, by Drilling Fluids and Wellbore Stability, 2017-2022 (US$ Mn)
TABLE 386 China Nanotechnology in Oil and gas Market, by Drilling Fluids and Wellbore Stability, 2023-2030 (US$ Mn)
TABLE 387 China Nanotechnology in Oil and gas Market, by Corrosion Prevention and Control, 2017-2022 (US$ Mn)
TABLE 388 China Nanotechnology in Oil and gas Market, by Corrosion Prevention and Control, 2023-2030 (US$ Mn)
TABLE 389 China Nanotechnology in Oil and gas Market, by Downhole Sensing and Monitoring, 2017-2022 (US$ Mn)
TABLE 390 China Nanotechnology in Oil and gas Market, by Downhole Sensing and Monitoring, 2023-2030 (US$ Mn)
TABLE 391 China Nanotechnology in Oil and gas Market, by Water Treatment and Desalination, 2017-2022 (US$ Mn)
TABLE 392 China Nanotechnology in Oil and gas Market, by Water Treatment and Desalination, 2023-2030 (US$ Mn)
TABLE 393 China Nanotechnology in Oil and gas Market, by Nanotechnology in Cementing, 2017-2022 (US$ Mn)
TABLE 394 China Nanotechnology in Oil and gas Market, by Nanotechnology in Cementing, 2023-2030 (US$ Mn)
TABLE 395 China Nanotechnology in Oil and gas Market, by Reservoir Imaging and Characterization, 2017-2022 (US$ Mn)
TABLE 396 China Nanotechnology in Oil and gas Market, by Reservoir Imaging and Characterization, 2023-2030 (US$ Mn)
TABLE 397 China Nanotechnology in Oil and gas Market, by Environmental Management, 2017-2022 (US$ Mn)
TABLE 398 China Nanotechnology in Oil and gas Market, by Environmental Management, 2023-2030 (US$ Mn)
TABLE 399 China Nanotechnology in Oil and gas Market, by Exploration and Seismic Imaging, 2017-2022 (US$ Mn)
TABLE 400 China Nanotechnology in Oil and gas Market, by Exploration and Seismic Imaging, 2023-2030 (US$ Mn)
TABLE 401 China Nanotechnology in Oil and gas Market, by Nanobots and Nanorobots, 2017-2022 (US$ Mn)
TABLE 402 China Nanotechnology in Oil and gas Market, by Nanobots and Nanorobots, 2023-2030 (US$ Mn)
TABLE 403 China Nanotechnology in Oil and gas Market, by Catalysts for Upgrading Processes, 2017-2022 (US$ Mn)
TABLE 404 China Nanotechnology in Oil and gas Market, by Catalysts for Upgrading Processes, 2023-2030 (US$ Mn)
TABLE 405 Japan Nanotechnology in Oil and gas Market, by Enhanced Oil Recovery (EOR), 2017-2022 (US$ Mn)
TABLE 406 Japan Nanotechnology in Oil and gas Market, by Enhanced Oil Recovery (EOR), 2023-2030 (US$ Mn)
TABLE 407 Japan Nanotechnology in Oil and gas Market, by Drilling Fluids and Wellbore Stability, 2017-2022 (US$ Mn)
TABLE 408 Japan Nanotechnology in Oil and gas Market, by Drilling Fluids and Wellbore Stability, 2023-2030 (US$ Mn)
TABLE 409 Japan Nanotechnology in Oil and gas Market, by Corrosion Prevention and Control, 2017-2022 (US$ Mn)
TABLE 410 Japan Nanotechnology in Oil and gas Market, by Corrosion Prevention and Control, 2023-2030 (US$ Mn)
TABLE 411 Japan Nanotechnology in Oil and gas Market, by Downhole Sensing and Monitoring, 2017-2022 (US$ Mn)
TABLE 412 Japan Nanotechnology in Oil and gas Market, by Downhole Sensing and Monitoring, 2023-2030 (US$ Mn)
TABLE 413 Japan Nanotechnology in Oil and gas Market, by Water Treatment and Desalination, 2017-2022 (US$ Mn)
TABLE 414 Japan Nanotechnology in Oil and gas Market, by Water Treatment and Desalination, 2023-2030 (US$ Mn)
TABLE 415 Japan Nanotechnology in Oil and gas Market, by Nanotechnology in Cementing, 2017-2022 (US$ Mn)
TABLE 416 Japan Nanotechnology in Oil and gas Market, by Nanotechnology in Cementing, 2023-2030 (US$ Mn)
TABLE 417 Japan Nanotechnology in Oil and gas Market, by Reservoir Imaging and Characterization, 2017-2022 (US$ Mn)
TABLE 418 Japan Nanotechnology in Oil and gas Market, by Reservoir Imaging and Characterization, 2023-2030 (US$ Mn)
TABLE 419 Japan Nanotechnology in Oil and gas Market, by Environmental Management, 2017-2022 (US$ Mn)
TABLE 420 Japan Nanotechnology in Oil and gas Market, by Environmental Management, 2023-2030 (US$ Mn)
TABLE 421 Japan Nanotechnology in Oil and gas Market, by Exploration and Seismic Imaging, 2017-2022 (US$ Mn)
TABLE 422 Japan Nanotechnology in Oil and gas Market, by Exploration and Seismic Imaging, 2023-2030 (US$ Mn)
TABLE 423 Japan Nanotechnology in Oil and gas Market, by Nanobots and Nanorobots, 2017-2022 (US$ Mn)
TABLE 424 Japan Nanotechnology in Oil and gas Market, by Nanobots and Nanorobots, 2023-2030 (US$ Mn)
TABLE 425 Japan Nanotechnology in Oil and gas Market, by Catalysts for Upgrading Processes, 2017-2022 (US$ Mn)
TABLE 426 Japan Nanotechnology in Oil and gas Market, by Catalysts for Upgrading Processes, 2023-2030 (US$ Mn)
TABLE 427 India Nanotechnology in Oil and gas Market, by Enhanced Oil Recovery (EOR), 2017-2022 (US$ Mn)
TABLE 428 India Nanotechnology in Oil and gas Market, by Enhanced Oil Recovery (EOR), 2023-2030 (US$ Mn)
TABLE 429 India Nanotechnology in Oil and gas Market, by Drilling Fluids and Wellbore Stability, 2017-2022 (US$ Mn)
TABLE 430 India Nanotechnology in Oil and gas Market, by Drilling Fluids and Wellbore Stability, 2023-2030 (US$ Mn)
TABLE 431 India Nanotechnology in Oil and gas Market, by Corrosion Prevention and Control, 2017-2022 (US$ Mn)
TABLE 432 India Nanotechnology in Oil and gas Market, by Corrosion Prevention and Control, 2023-2030 (US$ Mn)
TABLE 433 India Nanotechnology in Oil and gas Market, by Downhole Sensing and Monitoring, 2017-2022 (US$ Mn)
TABLE 434 India Nanotechnology in Oil and gas Market, by Downhole Sensing and Monitoring, 2023-2030 (US$ Mn)
TABLE 435 India Nanotechnology in Oil and gas Market, by Water Treatment and Desalination, 2017-2022 (US$ Mn)
TABLE 436 India Nanotechnology in Oil and gas Market, by Water Treatment and Desalination, 2023-2030 (US$ Mn)
TABLE 437 India Nanotechnology in Oil and gas Market, by Nanotechnology in Cementing, 2017-2022 (US$ Mn)
TABLE 438 India Nanotechnology in Oil and gas Market, by Nanotechnology in Cementing, 2023-2030 (US$ Mn)
TABLE 439 India Nanotechnology in Oil and gas Market, by Reservoir Imaging and Characterization, 2017-2022 (US$ Mn)
TABLE 440 India Nanotechnology in Oil and gas Market, by Reservoir Imaging and Characterization, 2023-2030 (US$ Mn)
TABLE 441 India Nanotechnology in Oil and gas Market, by Environmental Management, 2017-2022 (US$ Mn)
TABLE 442 India Nanotechnology in Oil and gas Market, by Environmental Management, 2023-2030 (US$ Mn)
TABLE 443 India Nanotechnology in Oil and gas Market, by Exploration and Seismic Imaging, 2017-2022 (US$ Mn)
TABLE 444 India Nanotechnology in Oil and gas Market, by Exploration and Seismic Imaging, 2023-2030 (US$ Mn)
TABLE 445 India Nanotechnology in Oil and gas Market, by Nanobots and Nanorobots, 2017-2022 (US$ Mn)
TABLE 446 India Nanotechnology in Oil and gas Market, by Nanobots and Nanorobots, 2023-2030 (US$ Mn)
TABLE 447 India Nanotechnology in Oil and gas Market, by Catalysts for Upgrading Processes, 2017-2022 (US$ Mn)
TABLE 448 India Nanotechnology in Oil and gas Market, by Catalysts for Upgrading Processes, 2023-2030 (US$ Mn)
TABLE 449 South Korea Nanotechnology in Oil and gas Market, by Enhanced Oil Recovery (EOR), 2017-2022 (US$ Mn)
TABLE 450 South Korea Nanotechnology in Oil and gas Market, by Enhanced Oil Recovery (EOR), 2023-2030 (US$ Mn)
TABLE 451 South Korea Nanotechnology in Oil and gas Market, by Drilling Fluids and Wellbore Stability, 2017-2022 (US$ Mn)
TABLE 452 South Korea Nanotechnology in Oil and gas Market, by Drilling Fluids and Wellbore Stability, 2023-2030 (US$ Mn)
TABLE 453 South Korea Nanotechnology in Oil and gas Market, by Corrosion Prevention and Control, 2017-2022 (US$ Mn)
TABLE 454 South Korea Nanotechnology in Oil and gas Market, by Corrosion Prevention and Control, 2023-2030 (US$ Mn)
TABLE 455 South Korea Nanotechnology in Oil and gas Market, by Downhole Sensing and Monitoring, 2017-2022 (US$ Mn)
TABLE 456 South Korea Nanotechnology in Oil and gas Market, by Downhole Sensing and Monitoring, 2023-2030 (US$ Mn)
TABLE 457 South Korea Nanotechnology in Oil and gas Market, by Water Treatment and Desalination, 2017-2022 (US$ Mn)
TABLE 458 South Korea Nanotechnology in Oil and gas Market, by Water Treatment and Desalination, 2023-2030 (US$ Mn)
TABLE 459 South Korea Nanotechnology in Oil and gas Market, by Nanotechnology in Cementing, 2017-2022 (US$ Mn)
TABLE 460 South Korea Nanotechnology in Oil and gas Market, by Nanotechnology in Cementing, 2023-2030 (US$ Mn)
TABLE 461 South Korea Nanotechnology in Oil and gas Market, by Reservoir Imaging and Characterization, 2017-2022 (US$ Mn)
TABLE 462 South Korea Nanotechnology in Oil and gas Market, by Reservoir Imaging and Characterization, 2023-2030 (US$ Mn)
TABLE 463 South Korea Nanotechnology in Oil and gas Market, by Environmental Management, 2017-2022 (US$ Mn)
TABLE 464 South Korea Nanotechnology in Oil and gas Market, by Environmental Management, 2023-2030 (US$ Mn)
TABLE 465 South Korea Nanotechnology in Oil and gas Market, by Exploration and Seismic Imaging, 2017-2022 (US$ Mn)
TABLE 466 South Korea Nanotechnology in Oil and gas Market, by Exploration and Seismic Imaging, 2023-2030 (US$ Mn)
TABLE 467 South Korea Nanotechnology in Oil and gas Market, by Nanobots and Nanorobots, 2017-2022 (US$ Mn)
TABLE 468 South Korea Nanotechnology in Oil and gas Market, by Nanobots and Nanorobots, 2023-2030 (US$ Mn)
TABLE 469 South Korea Nanotechnology in Oil and gas Market, by Catalysts for Upgrading Processes, 2017-2022 (US$ Mn)
TABLE 470 South Korea Nanotechnology in Oil and gas Market, by Catalysts for Upgrading Processes, 2023-2030 (US$ Mn)
TABLE 471 South-East Asia Nanotechnology in Oil and gas Market, by Enhanced Oil Recovery (EOR), 2017-2022 (US$ Mn)
TABLE 472 South-East Asia Nanotechnology in Oil and gas Market, by Enhanced Oil Recovery (EOR), 2023-2030 (US$ Mn)
TABLE 473 South-East Asia Nanotechnology in Oil and gas Market, by Drilling Fluids and Wellbore Stability, 2017-2022 (US$ Mn)
TABLE 474 South-East Asia Nanotechnology in Oil and gas Market, by Drilling Fluids and Wellbore Stability, 2023-2030 (US$ Mn)
TABLE 475 South-East Asia Nanotechnology in Oil and gas Market, by Corrosion Prevention and Control, 2017-2022 (US$ Mn)
TABLE 476 South-East Asia Nanotechnology in Oil and gas Market, by Corrosion Prevention and Control, 2023-2030 (US$ Mn)
TABLE 477 South-East Asia Nanotechnology in Oil and gas Market, by Downhole Sensing and Monitoring, 2017-2022 (US$ Mn)
TABLE 478 South-East Asia Nanotechnology in Oil and gas Market, by Downhole Sensing and Monitoring, 2023-2030 (US$ Mn)
TABLE 479 South-East Asia Nanotechnology in Oil and gas Market, by Water Treatment and Desalination, 2017-2022 (US$ Mn)
TABLE 480 South-East Asia Nanotechnology in Oil and gas Market, by Water Treatment and Desalination, 2023-2030 (US$ Mn)
TABLE 481 South-East Asia Nanotechnology in Oil and gas Market, by Nanotechnology in Cementing, 2017-2022 (US$ Mn)
TABLE 482 South-East Asia Nanotechnology in Oil and gas Market, by Nanotechnology in Cementing, 2023-2030 (US$ Mn)
TABLE 483 South-East Asia Nanotechnology in Oil and gas Market, by Reservoir Imaging and Characterization, 2017-2022 (US$ Mn)
TABLE 484 South-East Asia Nanotechnology in Oil and gas Market, by Reservoir Imaging and Characterization, 2023-2030 (US$ Mn)
TABLE 485 South-East Asia Nanotechnology in Oil and gas Market, by Environmental Management, 2017-2022 (US$ Mn)
TABLE 486 South-East Asia Nanotechnology in Oil and gas Market, by Environmental Management, 2023-2030 (US$ Mn)
TABLE 487 South-East Asia Nanotechnology in Oil and gas Market, by Exploration and Seismic Imaging, 2017-2022 (US$ Mn)
TABLE 488 South-East Asia Nanotechnology in Oil and gas Market, by Exploration and Seismic Imaging, 2023-2030 (US$ Mn)
TABLE 489 South-East Asia Nanotechnology in Oil and gas Market, by Nanobots and Nanorobots, 2017-2022 (US$ Mn)
TABLE 490 South-East Asia Nanotechnology in Oil and gas Market, by Nanobots and Nanorobots, 2023-2030 (US$ Mn)
TABLE 491 South-East Asia Nanotechnology in Oil and gas Market, by Catalysts for Upgrading Processes, 2017-2022 (US$ Mn)
TABLE 492 South-East Asia Nanotechnology in Oil and gas Market, by Catalysts for Upgrading Processes, 2023-2030 (US$ Mn)
TABLE 493 Rest of Asia Pacific Nanotechnology in Oil and gas Market, by Enhanced Oil Recovery (EOR), 2017-2022 (US$ Mn)
TABLE 494 Rest of Asia Pacific Nanotechnology in Oil and gas Market, by Enhanced Oil Recovery (EOR), 2023-2030 (US$ Mn)
TABLE 495 Rest of Asia Pacific Nanotechnology in Oil and gas Market, by Drilling Fluids and Wellbore Stability, 2017-2022 (US$ Mn)
TABLE 496 Rest of Asia Pacific Nanotechnology in Oil and gas Market, by Drilling Fluids and Wellbore Stability, 2023-2030 (US$ Mn)
TABLE 497 Rest of Asia Pacific Nanotechnology in Oil and gas Market, by Corrosion Prevention and Control, 2017-2022 (US$ Mn)
TABLE 498 Rest of Asia Pacific Nanotechnology in Oil and gas Market, by Corrosion Prevention and Control, 2023-2030 (US$ Mn)
TABLE 499 Rest of Asia Pacific Nanotechnology in Oil and gas Market, by Downhole Sensing and Monitoring, 2017-2022 (US$ Mn)
TABLE 500 Rest of Asia Pacific Nanotechnology in Oil and gas Market, by Downhole Sensing and Monitoring, 2023-2030 (US$ Mn)
TABLE 501 Rest of Asia Pacific Nanotechnology in Oil and gas Market, by Water Treatment and Desalination, 2017-2022 (US$ Mn)
TABLE 502 Rest of Asia Pacific Nanotechnology in Oil and gas Market, by Water Treatment and Desalination, 2023-2030 (US$ Mn)
TABLE 503 Rest of Asia Pacific Nanotechnology in Oil and gas Market, by Nanotechnology in Cementing, 2017-2022 (US$ Mn)
TABLE 504 Rest of Asia Pacific Nanotechnology in Oil and gas Market, by Nanotechnology in Cementing, 2023-2030 (US$ Mn)
TABLE 505 Rest of Asia Pacific Nanotechnology in Oil and gas Market, by Reservoir Imaging and Characterization, 2017-2022 (US$ Mn)
TABLE 506 Rest of Asia Pacific Nanotechnology in Oil and gas Market, by Reservoir Imaging and Characterization, 2023-2030 (US$ Mn)
TABLE 507 Rest of Asia Pacific Nanotechnology in Oil and gas Market, by Environmental Management, 2017-2022 (US$ Mn)
TABLE 508 Rest of Asia Pacific Nanotechnology in Oil and gas Market, by Environmental Management, 2023-2030 (US$ Mn)
TABLE 509 Rest of Asia Pacific Nanotechnology in Oil and gas Market, by Exploration and Seismic Imaging, 2017-2022 (US$ Mn)
TABLE 510 Rest of Asia Pacific Nanotechnology in Oil and gas Market, by Exploration and Seismic Imaging, 2023-2030 (US$ Mn)
TABLE 511 Rest of Asia Pacific Nanotechnology in Oil and gas Market, by Nanobots and Nanorobots, 2017-2022 (US$ Mn)
TABLE 512 Rest of Asia Pacific Nanotechnology in Oil and gas Market, by Nanobots and Nanorobots, 2023-2030 (US$ Mn)
TABLE 513 Rest of Asia Pacific Nanotechnology in Oil and gas Market, by Catalysts for Upgrading Processes, 2017-2022 (US$ Mn)
TABLE 514 Rest of Asia Pacific Nanotechnology in Oil and gas Market, by Catalysts for Upgrading Processes, 2023-2030 (US$ Mn)
TABLE 515 Latin America Nanotechnology in Oil and gas Market, by Enhanced Oil Recovery (EOR), 2017-2022 (US$ Mn)
TABLE 516 Latin America Nanotechnology in Oil and gas Market, by Enhanced Oil Recovery (EOR), 2023-2030 (US$ Mn)
TABLE 517 Latin America Nanotechnology in Oil and gas Market, by Drilling Fluids and Wellbore Stability, 2017-2022 (US$ Mn)
TABLE 518 Latin America Nanotechnology in Oil and gas Market, by Drilling Fluids and Wellbore Stability, 2023-2030 (US$ Mn)
TABLE 519 Latin America Nanotechnology in Oil and gas Market, by Corrosion Prevention and Control, 2017-2022 (US$ Mn)
TABLE 520 Latin America Nanotechnology in Oil and gas Market, by Corrosion Prevention and Control, 2023-2030 (US$ Mn)
TABLE 521 Latin America Nanotechnology in Oil and gas Market, by Downhole Sensing and Monitoring, 2017-2022 (US$ Mn)
TABLE 522 Latin America Nanotechnology in Oil and gas Market, by Downhole Sensing and Monitoring, 2023-2030 (US$ Mn)
TABLE 523 Latin America Nanotechnology in Oil and gas Market, by Water Treatment and Desalination, 2017-2022 (US$ Mn)
TABLE 524 Latin America Nanotechnology in Oil and gas Market, by Water Treatment and Desalination, 2023-2030 (US$ Mn)
TABLE 525 Latin America Nanotechnology in Oil and gas Market, by Nanotechnology in Cementing, 2017-2022 (US$ Mn)
TABLE 526 Latin America Nanotechnology in Oil and gas Market, by Nanotechnology in Cementing, 2023-2030 (US$ Mn)
TABLE 527 Latin America Nanotechnology in Oil and gas Market, by Reservoir Imaging and Characterization, 2017-2022 (US$ Mn)
TABLE 528 Latin America Nanotechnology in Oil and gas Market, by Reservoir Imaging and Characterization, 2023-2030 (US$ Mn)
TABLE 529 Latin America Nanotechnology in Oil and gas Market, by Environmental Management, 2017-2022 (US$ Mn)
TABLE 530 Latin America Nanotechnology in Oil and gas Market, by Environmental Management, 2023-2030 (US$ Mn)
TABLE 531 Latin America Nanotechnology in Oil and gas Market, by Exploration and Seismic Imaging, 2017-2022 (US$ Mn)
TABLE 532 Latin America Nanotechnology in Oil and gas Market, by Exploration and Seismic Imaging, 2023-2030 (US$ Mn)
TABLE 533 Latin America Nanotechnology in Oil and gas Market, by Nanobots and Nanorobots, 2017-2022 (US$ Mn)
TABLE 534 Latin America Nanotechnology in Oil and gas Market, by Nanobots and Nanorobots, 2023-2030 (US$ Mn)
TABLE 535 Latin America Nanotechnology in Oil and gas Market, by Catalysts for Upgrading Processes, 2017-2022 (US$ Mn)
TABLE 536 Latin America Nanotechnology in Oil and gas Market, by Catalysts for Upgrading Processes, 2023-2030 (US$ Mn)
TABLE 537 Brazil Nanotechnology in Oil and gas Market, by Enhanced Oil Recovery (EOR), 2017-2022 (US$ Mn)
TABLE 538 Brazil Nanotechnology in Oil and gas Market, by Enhanced Oil Recovery (EOR), 2023-2030 (US$ Mn)
TABLE 539 Brazil Nanotechnology in Oil and gas Market, by Drilling Fluids and Wellbore Stability, 2017-2022 (US$ Mn)
TABLE 540 Brazil Nanotechnology in Oil and gas Market, by Drilling Fluids and Wellbore Stability, 2023-2030 (US$ Mn)
TABLE 541 Brazil Nanotechnology in Oil and gas Market, by Corrosion Prevention and Control, 2017-2022 (US$ Mn)
TABLE 542 Brazil Nanotechnology in Oil and gas Market, by Corrosion Prevention and Control, 2023-2030 (US$ Mn)
TABLE 543 Brazil Nanotechnology in Oil and gas Market, by Downhole Sensing and Monitoring, 2017-2022 (US$ Mn)
TABLE 544 Brazil Nanotechnology in Oil and gas Market, by Downhole Sensing and Monitoring, 2023-2030 (US$ Mn)
TABLE 545 Brazil Nanotechnology in Oil and gas Market, by Water Treatment and Desalination, 2017-2022 (US$ Mn)
TABLE 546 Brazil Nanotechnology in Oil and gas Market, by Water Treatment and Desalination, 2023-2030 (US$ Mn)
TABLE 547 Brazil Nanotechnology in Oil and gas Market, by Nanotechnology in Cementing, 2017-2022 (US$ Mn)
TABLE 548 Brazil Nanotechnology in Oil and gas Market, by Nanotechnology in Cementing, 2023-2030 (US$ Mn)
TABLE 549 Brazil Nanotechnology in Oil and gas Market, by Reservoir Imaging and Characterization, 2017-2022 (US$ Mn)
TABLE 550 Brazil Nanotechnology in Oil and gas Market, by Reservoir Imaging and Characterization, 2023-2030 (US$ Mn)
TABLE 551 Brazil Nanotechnology in Oil and gas Market, by Environmental Management, 2017-2022 (US$ Mn)
TABLE 552 Brazil Nanotechnology in Oil and gas Market, by Environmental Management, 2023-2030 (US$ Mn)
TABLE 553 Brazil Nanotechnology in Oil and gas Market, by Exploration and Seismic Imaging, 2017-2022 (US$ Mn)
TABLE 554 Brazil Nanotechnology in Oil and gas Market, by Exploration and Seismic Imaging, 2023-2030 (US$ Mn)
TABLE 555 Brazil Nanotechnology in Oil and gas Market, by Nanobots and Nanorobots, 2017-2022 (US$ Mn)
TABLE 556 Brazil Nanotechnology in Oil and gas Market, by Nanobots and Nanorobots, 2023-2030 (US$ Mn)
TABLE 557 Brazil Nanotechnology in Oil and gas Market, by Catalysts for Upgrading Processes, 2017-2022 (US$ Mn)
TABLE 558 Brazil Nanotechnology in Oil and gas Market, by Catalysts for Upgrading Processes, 2023-2030 (US$ Mn)
TABLE 559 Argentina Nanotechnology in Oil and gas Market, by Enhanced Oil Recovery (EOR), 2017-2022 (US$ Mn)
TABLE 560 Argentina Nanotechnology in Oil and gas Market, by Enhanced Oil Recovery (EOR), 2023-2030 (US$ Mn)
TABLE 561 Argentina Nanotechnology in Oil and gas Market, by Drilling Fluids and Wellbore Stability, 2017-2022 (US$ Mn)
TABLE 562 Argentina Nanotechnology in Oil and gas Market, by Drilling Fluids and Wellbore Stability, 2023-2030 (US$ Mn)
TABLE 563 Argentina Nanotechnology in Oil and gas Market, by Corrosion Prevention and Control, 2017-2022 (US$ Mn)
TABLE 564 Argentina Nanotechnology in Oil and gas Market, by Corrosion Prevention and Control, 2023-2030 (US$ Mn)
TABLE 565 Argentina Nanotechnology in Oil and gas Market, by Downhole Sensing and Monitoring, 2017-2022 (US$ Mn)
TABLE 566 Argentina Nanotechnology in Oil and gas Market, by Downhole Sensing and Monitoring, 2023-2030 (US$ Mn)
TABLE 567 Argentina Nanotechnology in Oil and gas Market, by Water Treatment and Desalination, 2017-2022 (US$ Mn)
TABLE 568 Argentina Nanotechnology in Oil and gas Market, by Water Treatment and Desalination, 2023-2030 (US$ Mn)
TABLE 569 Argentina Nanotechnology in Oil and gas Market, by Nanotechnology in Cementing, 2017-2022 (US$ Mn)
TABLE 570 Argentina Nanotechnology in Oil and gas Market, by Nanotechnology in Cementing, 2023-2030 (US$ Mn)
TABLE 571 Argentina Nanotechnology in Oil and gas Market, by Reservoir Imaging and Characterization, 2017-2022 (US$ Mn)
TABLE 572 Argentina Nanotechnology in Oil and gas Market, by Reservoir Imaging and Characterization, 2023-2030 (US$ Mn)
TABLE 573 Argentina Nanotechnology in Oil and gas Market, by Environmental Management, 2017-2022 (US$ Mn)
TABLE 574 Argentina Nanotechnology in Oil and gas Market, by Environmental Management, 2023-2030 (US$ Mn)
TABLE 575 Argentina Nanotechnology in Oil and gas Market, by Exploration and Seismic Imaging, 2017-2022 (US$ Mn)
TABLE 576 Argentina Nanotechnology in Oil and gas Market, by Exploration and Seismic Imaging, 2023-2030 (US$ Mn)
TABLE 577 Argentina Nanotechnology in Oil and gas Market, by Nanobots and Nanorobots, 2017-2022 (US$ Mn)
TABLE 578 Argentina Nanotechnology in Oil and gas Market, by Nanobots and Nanorobots, 2023-2030 (US$ Mn)
TABLE 579 Argentina Nanotechnology in Oil and gas Market, by Catalysts for Upgrading Processes, 2017-2022 (US$ Mn)
TABLE 580 Argentina Nanotechnology in Oil and gas Market, by Catalysts for Upgrading Processes, 2023-2030 (US$ Mn)
TABLE 581 Rest of Latin America Nanotechnology in Oil and gas Market, by Enhanced Oil Recovery (EOR), 2017-2022 (US$ Mn)
TABLE 582 Rest of Latin America Nanotechnology in Oil and gas Market, by Enhanced Oil Recovery (EOR), 2023-2030 (US$ Mn)
TABLE 583 Rest of Latin America Nanotechnology in Oil and gas Market, by Drilling Fluids and Wellbore Stability, 2017-2022 (US$ Mn)
TABLE 584 Rest of Latin America Nanotechnology in Oil and gas Market, by Drilling Fluids and Wellbore Stability, 2023-2030 (US$ Mn)
TABLE 585 Rest of Latin America Nanotechnology in Oil and gas Market, by Corrosion Prevention and Control, 2017-2022 (US$ Mn)
TABLE 586 Rest of Latin America Nanotechnology in Oil and gas Market, by Corrosion Prevention and Control, 2023-2030 (US$ Mn)
TABLE 587 Rest of Latin America Nanotechnology in Oil and gas Market, by Downhole Sensing and Monitoring, 2017-2022 (US$ Mn)
TABLE 588 Rest of Latin America Nanotechnology in Oil and gas Market, by Downhole Sensing and Monitoring, 2023-2030 (US$ Mn)
TABLE 589 Rest of Latin America Nanotechnology in Oil and gas Market, by Water Treatment and Desalination, 2017-2022 (US$ Mn)
TABLE 590 Rest of Latin America Nanotechnology in Oil and gas Market, by Water Treatment and Desalination, 2023-2030 (US$ Mn)
TABLE 591 Rest of Latin America Nanotechnology in Oil and gas Market, by Nanotechnology in Cementing, 2017-2022 (US$ Mn)
TABLE 592 Rest of Latin America Nanotechnology in Oil and gas Market, by Nanotechnology in Cementing, 2023-2030 (US$ Mn)
TABLE 593 Rest of Latin America Nanotechnology in Oil and gas Market, by Reservoir Imaging and Characterization, 2017-2022 (US$ Mn)
TABLE 594 Rest of Latin America Nanotechnology in Oil and gas Market, by Reservoir Imaging and Characterization, 2023-2030 (US$ Mn)
TABLE 595 Rest of Latin America Nanotechnology in Oil and gas Market, by Environmental Management, 2017-2022 (US$ Mn)
TABLE 596 Rest of Latin America Nanotechnology in Oil and gas Market, by Environmental Management, 2023-2030 (US$ Mn)
TABLE 597 Rest of Latin America Nanotechnology in Oil and gas Market, by Exploration and Seismic Imaging, 2017-2022 (US$ Mn)
TABLE 598 Rest of Latin America Nanotechnology in Oil and gas Market, by Exploration and Seismic Imaging, 2023-2030 (US$ Mn)
TABLE 599 Rest of Latin America Nanotechnology in Oil and gas Market, by Nanobots and Nanorobots, 2017-2022 (US$ Mn)
TABLE 600 Rest of Latin America Nanotechnology in Oil and gas Market, by Nanobots and Nanorobots, 2023-2030 (US$ Mn)
TABLE 601 Rest of Latin America Nanotechnology in Oil and gas Market, by Catalysts for Upgrading Processes, 2017-2022 (US$ Mn)
TABLE 602 Rest of Latin America Nanotechnology in Oil and gas Market, by Catalysts for Upgrading Processes, 2023-2030 (US$ Mn)
TABLE 603 Middle East Nanotechnology in Oil and gas Market, by Enhanced Oil Recovery (EOR), 2017-2022 (US$ Mn)
TABLE 604 Middle East Nanotechnology in Oil and gas Market, by Enhanced Oil Recovery (EOR), 2023-2030 (US$ Mn)
TABLE 605 Middle East Nanotechnology in Oil and gas Market, by Drilling Fluids and Wellbore Stability, 2017-2022 (US$ Mn)
TABLE 606 Middle East Nanotechnology in Oil and gas Market, by Drilling Fluids and Wellbore Stability, 2023-2030 (US$ Mn)
TABLE 607 Middle East Nanotechnology in Oil and gas Market, by Corrosion Prevention and Control, 2017-2022 (US$ Mn)
TABLE 608 Middle East Nanotechnology in Oil and gas Market, by Corrosion Prevention and Control, 2023-2030 (US$ Mn)
TABLE 609 Middle East Nanotechnology in Oil and gas Market, by Downhole Sensing and Monitoring, 2017-2022 (US$ Mn)
TABLE 610 Middle East Nanotechnology in Oil and gas Market, by Downhole Sensing and Monitoring, 2023-2030 (US$ Mn)
TABLE 611 Middle East Nanotechnology in Oil and gas Market, by Water Treatment and Desalination, 2017-2022 (US$ Mn)
TABLE 612 Middle East Nanotechnology in Oil and gas Market, by Water Treatment and Desalination, 2023-2030 (US$ Mn)
TABLE 613 Middle East Nanotechnology in Oil and gas Market, by Nanotechnology in Cementing, 2017-2022 (US$ Mn)
TABLE 614 Middle East Nanotechnology in Oil and gas Market, by Nanotechnology in Cementing, 2023-2030 (US$ Mn)
TABLE 615 Middle East Nanotechnology in Oil and gas Market, by Reservoir Imaging and Characterization, 2017-2022 (US$ Mn)
TABLE 616 Middle East Nanotechnology in Oil and gas Market, by Reservoir Imaging and Characterization, 2023-2030 (US$ Mn)
TABLE 617 Middle East Nanotechnology in Oil and gas Market, by Environmental Management, 2017-2022 (US$ Mn)
TABLE 618 Middle East Nanotechnology in Oil and gas Market, by Environmental Management, 2023-2030 (US$ Mn)
TABLE 619 Middle East Nanotechnology in Oil and gas Market, by Exploration and Seismic Imaging, 2017-2022 (US$ Mn)
TABLE 620 Middle East Nanotechnology in Oil and gas Market, by Exploration and Seismic Imaging, 2023-2030 (US$ Mn)
TABLE 621 Middle East Nanotechnology in Oil and gas Market, by Nanobots and Nanorobots, 2017-2022 (US$ Mn)
TABLE 622 Middle East Nanotechnology in Oil and gas Market, by Nanobots and Nanorobots, 2023-2030 (US$ Mn)
TABLE 623 Middle East Nanotechnology in Oil and gas Market, by Catalysts for Upgrading Processes, 2017-2022 (US$ Mn)
TABLE 624 Middle East Nanotechnology in Oil and gas Market, by Catalysts for Upgrading Processes, 2023-2030 (US$ Mn)
TABLE 625 UAE Nanotechnology in Oil and gas Market, by Enhanced Oil Recovery (EOR), 2017-2022 (US$ Mn)
TABLE 626 UAE Nanotechnology in Oil and gas Market, by Enhanced Oil Recovery (EOR), 2023-2030 (US$ Mn)
TABLE 627 UAE Nanotechnology in Oil and gas Market, by Drilling Fluids and Wellbore Stability, 2017-2022 (US$ Mn)
TABLE 628 UAE Nanotechnology in Oil and gas Market, by Drilling Fluids and Wellbore Stability, 2023-2030 (US$ Mn)
TABLE 629 UAE Nanotechnology in Oil and gas Market, by Corrosion Prevention and Control, 2017-2022 (US$ Mn)
TABLE 630 UAE Nanotechnology in Oil and gas Market, by Corrosion Prevention and Control, 2023-2030 (US$ Mn)
TABLE 631 UAE Nanotechnology in Oil and gas Market, by Downhole Sensing and Monitoring, 2017-2022 (US$ Mn)
TABLE 632 UAE Nanotechnology in Oil and gas Market, by Downhole Sensing and Monitoring, 2023-2030 (US$ Mn)
TABLE 633 UAE Nanotechnology in Oil and gas Market, by Water Treatment and Desalination, 2017-2022 (US$ Mn)
TABLE 634 UAE Nanotechnology in Oil and gas Market, by Water Treatment and Desalination, 2023-2030 (US$ Mn)
TABLE 635 UAE Nanotechnology in Oil and gas Market, by Nanotechnology in Cementing, 2017-2022 (US$ Mn)
TABLE 636 UAE Nanotechnology in Oil and gas Market, by Nanotechnology in Cementing, 2023-2030 (US$ Mn)
TABLE 637 UAE Nanotechnology in Oil and gas Market, by Reservoir Imaging and Characterization, 2017-2022 (US$ Mn)
TABLE 638 UAE Nanotechnology in Oil and gas Market, by Reservoir Imaging and Characterization, 2023-2030 (US$ Mn)
TABLE 639 UAE Nanotechnology in Oil and gas Market, by Environmental Management, 2017-2022 (US$ Mn)
TABLE 640 UAE Nanotechnology in Oil and gas Market, by Environmental Management, 2023-2030 (US$ Mn)
TABLE 641 UAE Nanotechnology in Oil and gas Market, by Exploration and Seismic Imaging, 2017-2022 (US$ Mn)
TABLE 642 UAE Nanotechnology in Oil and gas Market, by Exploration and Seismic Imaging, 2023-2030 (US$ Mn)
TABLE 643 UAE Nanotechnology in Oil and gas Market, by Nanobots and Nanorobots, 2017-2022 (US$ Mn)
TABLE 644 UAE Nanotechnology in Oil and gas Market, by Nanobots and Nanorobots, 2023-2030 (US$ Mn)
TABLE 645 UAE Nanotechnology in Oil and gas Market, by Catalysts for Upgrading Processes, 2017-2022 (US$ Mn)
TABLE 646 UAE Nanotechnology in Oil and gas Market, by Catalysts for Upgrading Processes, 2023-2030 (US$ Mn)
TABLE 647 Saudi Arabia Nanotechnology in Oil and gas Market, by Enhanced Oil Recovery (EOR), 2017-2022 (US$ Mn)
TABLE 648 Saudi Arabia Nanotechnology in Oil and gas Market, by Enhanced Oil Recovery (EOR), 2023-2030 (US$ Mn)
TABLE 649 Saudi Arabia Nanotechnology in Oil and gas Market, by Drilling Fluids and Wellbore Stability, 2017-2022 (US$ Mn)
TABLE 650 Saudi Arabia Nanotechnology in Oil and gas Market, by Drilling Fluids and Wellbore Stability, 2023-2030 (US$ Mn)
TABLE 651 Saudi Arabia Nanotechnology in Oil and gas Market, by Corrosion Prevention and Control, 2017-2022 (US$ Mn)
TABLE 652 Saudi Arabia Nanotechnology in Oil and gas Market, by Corrosion Prevention and Control, 2023-2030 (US$ Mn)
TABLE 653 Saudi Arabia Nanotechnology in Oil and gas Market, by Downhole Sensing and Monitoring, 2017-2022 (US$ Mn)
TABLE 654 Saudi Arabia Nanotechnology in Oil and gas Market, by Downhole Sensing and Monitoring, 2023-2030 (US$ Mn)
TABLE 655 Saudi Arabia Nanotechnology in Oil and gas Market, by Water Treatment and Desalination, 2017-2022 (US$ Mn)
TABLE 656 Saudi Arabia Nanotechnology in Oil and gas Market, by Water Treatment and Desalination, 2023-2030 (US$ Mn)
TABLE 657 Saudi Arabia Nanotechnology in Oil and gas Market, by Nanotechnology in Cementing, 2017-2022 (US$ Mn)
TABLE 658 Saudi Arabia Nanotechnology in Oil and gas Market, by Nanotechnology in Cementing, 2023-2030 (US$ Mn)
TABLE 659 Saudi Arabia Nanotechnology in Oil and gas Market, by Reservoir Imaging and Characterization, 2017-2022 (US$ Mn)
TABLE 660 Saudi Arabia Nanotechnology in Oil and gas Market, by Reservoir Imaging and Characterization, 2023-2030 (US$ Mn)
TABLE 661 Saudi Arabia Nanotechnology in Oil and gas Market, by Environmental Management, 2017-2022 (US$ Mn)
TABLE 662 Saudi Arabia Nanotechnology in Oil and gas Market, by Environmental Management, 2023-2030 (US$ Mn)
TABLE 663 Saudi Arabia Nanotechnology in Oil and gas Market, by Exploration and Seismic Imaging, 2017-2022 (US$ Mn)
TABLE 664 Saudi Arabia Nanotechnology in Oil and gas Market, by Exploration and Seismic Imaging, 2023-2030 (US$ Mn)
TABLE 665 Saudi Arabia Nanotechnology in Oil and gas Market, by Nanobots and Nanorobots, 2017-2022 (US$ Mn)
TABLE 666 Saudi Arabia Nanotechnology in Oil and gas Market, by Nanobots and Nanorobots, 2023-2030 (US$ Mn)
TABLE 667 Saudi Arabia Nanotechnology in Oil and gas Market, by Catalysts for Upgrading Processes, 2017-2022 (US$ Mn)
TABLE 668 Saudi Arabia Nanotechnology in Oil and gas Market, by Catalysts for Upgrading Processes, 2023-2030 (US$ Mn)
TABLE 669 Rest of Middle East Nanotechnology in Oil and gas Market, by Enhanced Oil Recovery (EOR), 2017-2022 (US$ Mn)
TABLE 670 Rest of Middle East Nanotechnology in Oil and gas Market, by Enhanced Oil Recovery (EOR), 2023-2030 (US$ Mn)
TABLE 671 Rest of Middle East Nanotechnology in Oil and gas Market, by Drilling Fluids and Wellbore Stability, 2017-2022 (US$ Mn)
TABLE 672 Rest of Middle East Nanotechnology in Oil and gas Market, by Drilling Fluids and Wellbore Stability, 2023-2030 (US$ Mn)
TABLE 673 Rest of Middle East Nanotechnology in Oil and gas Market, by Corrosion Prevention and Control, 2017-2022 (US$ Mn)
TABLE 674 Rest of Middle East Nanotechnology in Oil and gas Market, by Corrosion Prevention and Control, 2023-2030 (US$ Mn)
TABLE 675 Rest of Middle East Nanotechnology in Oil and gas Market, by Downhole Sensing and Monitoring, 2017-2022 (US$ Mn)
TABLE 676 Rest of Middle East Nanotechnology in Oil and gas Market, by Downhole Sensing and Monitoring, 2023-2030 (US$ Mn)
TABLE 677 Rest of Middle East Nanotechnology in Oil and gas Market, by Water Treatment and Desalination, 2017-2022 (US$ Mn)
TABLE 678 Rest of Middle East Nanotechnology in Oil and gas Market, by Water Treatment and Desalination, 2023-2030 (US$ Mn)
TABLE 679 Rest of Middle East Nanotechnology in Oil and gas Market, by Nanotechnology in Cementing, 2017-2022 (US$ Mn)
TABLE 680 Rest of Middle East Nanotechnology in Oil and gas Market, by Nanotechnology in Cementing, 2023-2030 (US$ Mn)
TABLE 681 Rest of Middle East Nanotechnology in Oil and gas Market, by Reservoir Imaging and Characterization, 2017-2022 (US$ Mn)
TABLE 682 Rest of Middle East Nanotechnology in Oil and gas Market, by Reservoir Imaging and Characterization, 2023-2030 (US$ Mn)
TABLE 683 Rest of Middle East Nanotechnology in Oil and gas Market, by Environmental Management, 2017-2022 (US$ Mn)
TABLE 684 Rest of Middle East Nanotechnology in Oil and gas Market, by Environmental Management, 2023-2030 (US$ Mn)
TABLE 685 Rest of Middle East Nanotechnology in Oil and gas Market, by Exploration and Seismic Imaging, 2017-2022 (US$ Mn)
TABLE 686 Rest of Middle East Nanotechnology in Oil and gas Market, by Exploration and Seismic Imaging, 2023-2030 (US$ Mn)
TABLE 687 Rest of Middle East Nanotechnology in Oil and gas Market, by Nanobots and Nanorobots, 2017-2022 (US$ Mn)
TABLE 688 Rest of Middle East Nanotechnology in Oil and gas Market, by Nanobots and Nanorobots, 2023-2030 (US$ Mn)
TABLE 689 Rest of Middle East Nanotechnology in Oil and gas Market, by Catalysts for Upgrading Processes, 2017-2022 (US$ Mn)
TABLE 690 Rest of Middle East Nanotechnology in Oil and gas Market, by Catalysts for Upgrading Processes, 2023-2030 (US$ Mn)
TABLE 691 Africa Nanotechnology in Oil and gas Market, by Enhanced Oil Recovery (EOR), 2017-2022 (US$ Mn)
TABLE 692 Africa Nanotechnology in Oil and gas Market, by Enhanced Oil Recovery (EOR), 2023-2030 (US$ Mn)
TABLE 693 Africa Nanotechnology in Oil and gas Market, by Drilling Fluids and Wellbore Stability, 2017-2022 (US$ Mn)
TABLE 694 Africa Nanotechnology in Oil and gas Market, by Drilling Fluids and Wellbore Stability, 2023-2030 (US$ Mn)
TABLE 695 Africa Nanotechnology in Oil and gas Market, by Corrosion Prevention and Control, 2017-2022 (US$ Mn)
TABLE 696 Africa Nanotechnology in Oil and gas Market, by Corrosion Prevention and Control, 2023-2030 (US$ Mn)
TABLE 697 Africa Nanotechnology in Oil and gas Market, by Downhole Sensing and Monitoring, 2017-2022 (US$ Mn)
TABLE 698 Africa Nanotechnology in Oil and gas Market, by Downhole Sensing and Monitoring, 2023-2030 (US$ Mn)
TABLE 699 Africa Nanotechnology in Oil and gas Market, by Water Treatment and Desalination, 2017-2022 (US$ Mn)
TABLE 700 Africa Nanotechnology in Oil and gas Market, by Water Treatment and Desalination, 2023-2030 (US$ Mn)
TABLE 701 Africa Nanotechnology in Oil and gas Market, by Nanotechnology in Cementing, 2017-2022 (US$ Mn)
TABLE 702 Africa Nanotechnology in Oil and gas Market, by Nanotechnology in Cementing, 2023-2030 (US$ Mn)
TABLE 703 Africa Nanotechnology in Oil and gas Market, by Reservoir Imaging and Characterization, 2017-2022 (US$ Mn)
TABLE 704 Africa Nanotechnology in Oil and gas Market, by Reservoir Imaging and Characterization, 2023-2030 (US$ Mn)
TABLE 705 Africa Nanotechnology in Oil and gas Market, by Environmental Management, 2017-2022 (US$ Mn)
TABLE 706 Africa Nanotechnology in Oil and gas Market, by Environmental Management, 2023-2030 (US$ Mn)
TABLE 707 Africa Nanotechnology in Oil and gas Market, by Exploration and Seismic Imaging, 2017-2022 (US$ Mn)
TABLE 708 Africa Nanotechnology in Oil and gas Market, by Exploration and Seismic Imaging, 2023-2030 (US$ Mn)
TABLE 709 Africa Nanotechnology in Oil and gas Market, by Nanobots and Nanorobots, 2017-2022 (US$ Mn)
TABLE 710 Africa Nanotechnology in Oil and gas Market, by Nanobots and Nanorobots, 2023-2030 (US$ Mn)
TABLE 711 Africa Nanotechnology in Oil and gas Market, by Catalysts for Upgrading Processes, 2017-2022 (US$ Mn)
TABLE 712 Africa Nanotechnology in Oil and gas Market, by Catalysts for Upgrading Processes, 2023-2030 (US$ Mn)
TABLE 713 South Africa Nanotechnology in Oil and gas Market, by Enhanced Oil Recovery (EOR), 2017-2022 (US$ Mn)
TABLE 714 South Africa Nanotechnology in Oil and gas Market, by Enhanced Oil Recovery (EOR), 2023-2030 (US$ Mn)
TABLE 715 South Africa Nanotechnology in Oil and gas Market, by Drilling Fluids and Wellbore Stability, 2017-2022 (US$ Mn)
TABLE 716 South Africa Nanotechnology in Oil and gas Market, by Drilling Fluids and Wellbore Stability, 2023-2030 (US$ Mn)
TABLE 717 South Africa Nanotechnology in Oil and gas Market, by Corrosion Prevention and Control, 2017-2022 (US$ Mn)
TABLE 718 South Africa Nanotechnology in Oil and gas Market, by Corrosion Prevention and Control, 2023-2030 (US$ Mn)
TABLE 719 South Africa Nanotechnology in Oil and gas Market, by Downhole Sensing and Monitoring, 2017-2022 (US$ Mn)
TABLE 720 South Africa Nanotechnology in Oil and gas Market, by Downhole Sensing and Monitoring, 2023-2030 (US$ Mn)
TABLE 721 South Africa Nanotechnology in Oil and gas Market, by Water Treatment and Desalination, 2017-2022 (US$ Mn)
TABLE 722 South Africa Nanotechnology in Oil and gas Market, by Water Treatment and Desalination, 2023-2030 (US$ Mn)
TABLE 723 South Africa Nanotechnology in Oil and gas Market, by Nanotechnology in Cementing, 2017-2022 (US$ Mn)
TABLE 724 South Africa Nanotechnology in Oil and gas Market, by Nanotechnology in Cementing, 2023-2030 (US$ Mn)
TABLE 725 South Africa Nanotechnology in Oil and gas Market, by Reservoir Imaging and Characterization, 2017-2022 (US$ Mn)
TABLE 726 South Africa Nanotechnology in Oil and gas Market, by Reservoir Imaging and Characterization, 2023-2030 (US$ Mn)
TABLE 727 South Africa Nanotechnology in Oil and gas Market, by Environmental Management, 2017-2022 (US$ Mn)
TABLE 728 South Africa Nanotechnology in Oil and gas Market, by Environmental Management, 2023-2030 (US$ Mn)
TABLE 729 South Africa Nanotechnology in Oil and gas Market, by Exploration and Seismic Imaging, 2017-2022 (US$ Mn)
TABLE 730 South Africa Nanotechnology in Oil and gas Market, by Exploration and Seismic Imaging, 2023-2030 (US$ Mn)
TABLE 731 South Africa Nanotechnology in Oil and gas Market, by Nanobots and Nanorobots, 2017-2022 (US$ Mn)
TABLE 732 South Africa Nanotechnology in Oil and gas Market, by Nanobots and Nanorobots, 2023-2030 (US$ Mn)
TABLE 733 South Africa Nanotechnology in Oil and gas Market, by Catalysts for Upgrading Processes, 2017-2022 (US$ Mn)
TABLE 734 South Africa Nanotechnology in Oil and gas Market, by Catalysts for Upgrading Processes, 2023-2030 (US$ Mn)
TABLE 735 Egypt Nanotechnology in Oil and gas Market, by Enhanced Oil Recovery (EOR), 2017-2022 (US$ Mn)
TABLE 736 Egypt Nanotechnology in Oil and gas Market, by Enhanced Oil Recovery (EOR), 2023-2030 (US$ Mn)
TABLE 737 Egypt Nanotechnology in Oil and gas Market, by Drilling Fluids and Wellbore Stability, 2017-2022 (US$ Mn)
TABLE 738 Egypt Nanotechnology in Oil and gas Market, by Drilling Fluids and Wellbore Stability, 2023-2030 (US$ Mn)
TABLE 739 Egypt Nanotechnology in Oil and gas Market, by Corrosion Prevention and Control, 2017-2022 (US$ Mn)
TABLE 740 Egypt Nanotechnology in Oil and gas Market, by Corrosion Prevention and Control, 2023-2030 (US$ Mn)
TABLE 741 Egypt Nanotechnology in Oil and gas Market, by Downhole Sensing and Monitoring, 2017-2022 (US$ Mn)
TABLE 742 Egypt Nanotechnology in Oil and gas Market, by Downhole Sensing and Monitoring, 2023-2030 (US$ Mn)
TABLE 743 Egypt Nanotechnology in Oil and gas Market, by Water Treatment and Desalination, 2017-2022 (US$ Mn)
TABLE 744 Egypt Nanotechnology in Oil and gas Market, by Water Treatment and Desalination, 2023-2030 (US$ Mn)
TABLE 745 Egypt Nanotechnology in Oil and gas Market, by Nanotechnology in Cementing, 2017-2022 (US$ Mn)
TABLE 746 Egypt Nanotechnology in Oil and gas Market, by Nanotechnology in Cementing, 2023-2030 (US$ Mn)
TABLE 747 Egypt Nanotechnology in Oil and gas Market, by Reservoir Imaging and Characterization, 2017-2022 (US$ Mn)
TABLE 748 Egypt Nanotechnology in Oil and gas Market, by Reservoir Imaging and Characterization, 2023-2030 (US$ Mn)
TABLE 749 Egypt Nanotechnology in Oil and gas Market, by Environmental Management, 2017-2022 (US$ Mn)
TABLE 750 Egypt Nanotechnology in Oil and gas Market, by Environmental Management, 2023-2030 (US$ Mn)
TABLE 751 Egypt Nanotechnology in Oil and gas Market, by Exploration and Seismic Imaging, 2017-2022 (US$ Mn)
TABLE 752 Egypt Nanotechnology in Oil and gas Market, by Exploration and Seismic Imaging, 2023-2030 (US$ Mn)
TABLE 753 Egypt Nanotechnology in Oil and gas Market, by Nanobots and Nanorobots, 2017-2022 (US$ Mn)
TABLE 754 Egypt Nanotechnology in Oil and gas Market, by Nanobots and Nanorobots, 2023-2030 (US$ Mn)
TABLE 755 Egypt Nanotechnology in Oil and gas Market, by Catalysts for Upgrading Processes, 2017-2022 (US$ Mn)
TABLE 756 Egypt Nanotechnology in Oil and gas Market, by Catalysts for Upgrading Processes, 2023-2030 (US$ Mn)
TABLE 757 Rest of Africa Nanotechnology in Oil and gas Market, by Enhanced Oil Recovery (EOR), 2017-2022 (US$ Mn)
TABLE 758 Rest of Africa Nanotechnology in Oil and gas Market, by Enhanced Oil Recovery (EOR), 2023-2030 (US$ Mn)
TABLE 759 Rest of Africa Nanotechnology in Oil and gas Market, by Drilling Fluids and Wellbore Stability, 2017-2022 (US$ Mn)
TABLE 760 Rest of Africa Nanotechnology in Oil and gas Market, by Drilling Fluids and Wellbore Stability, 2023-2030 (US$ Mn)
TABLE 761 Rest of Africa Nanotechnology in Oil and gas Market, by Corrosion Prevention and Control, 2017-2022 (US$ Mn)
TABLE 762 Rest of Africa Nanotechnology in Oil and gas Market, by Corrosion Prevention and Control, 2023-2030 (US$ Mn)
TABLE 763 Rest of Africa Nanotechnology in Oil and gas Market, by Downhole Sensing and Monitoring, 2017-2022 (US$ Mn)
TABLE 764 Rest of Africa Nanotechnology in Oil and gas Market, by Downhole Sensing and Monitoring, 2023-2030 (US$ Mn)
TABLE 765 Rest of Africa Nanotechnology in Oil and gas Market, by Water Treatment and Desalination, 2017-2022 (US$ Mn)
TABLE 766 Rest of Africa Nanotechnology in Oil and gas Market, by Water Treatment and Desalination, 2023-2030 (US$ Mn)
TABLE 767 Rest of Africa Nanotechnology in Oil and gas Market, by Nanotechnology in Cementing, 2017-2022 (US$ Mn)
TABLE 768 Rest of Africa Nanotechnology in Oil and gas Market, by Nanotechnology in Cementing, 2023-2030 (US$ Mn)
TABLE 769 Rest of Africa Nanotechnology in Oil and gas Market, by Reservoir Imaging and Characterization, 2017-2022 (US$ Mn)
TABLE 770 Rest of Africa Nanotechnology in Oil and gas Market, by Reservoir Imaging and Characterization, 2023-2030 (US$ Mn)
TABLE 771 Rest of Africa Nanotechnology in Oil and gas Market, by Environmental Management, 2017-2022 (US$ Mn)
TABLE 772 Rest of Africa Nanotechnology in Oil and gas Market, by Environmental Management, 2023-2030 (US$ Mn)
TABLE 773 Rest of Africa Nanotechnology in Oil and gas Market, by Exploration and Seismic Imaging, 2017-2022 (US$ Mn)
TABLE 774 Rest of Africa Nanotechnology in Oil and gas Market, by Exploration and Seismic Imaging, 2023-2030 (US$ Mn)
TABLE 775 Rest of Africa Nanotechnology in Oil and gas Market, by Nanobots and Nanorobots, 2017-2022 (US$ Mn)
TABLE 776 Rest of Africa Nanotechnology in Oil and gas Market, by Nanobots and Nanorobots, 2023-2030 (US$ Mn)
TABLE 777 Rest of Africa Nanotechnology in Oil and gas Market, by Catalysts for Upgrading Processes, 2017-2022 (US$ Mn)
TABLE 778 Rest of Africa Nanotechnology in Oil and gas Market, by Catalysts for Upgrading Processes, 2023-2030 (US$ Mn)

How big is the global market for nanotechnology in oil and gas right now?

In 2022, the market for nanotechnology in oil and gas was estimated to be worth USD 150.8 million.

What is the nanotechnology in the oil and gas market’s anticipated growth rate from 2023 to 2030?

The market for nanotechnology in oil and gas is anticipated to increase at a CAGR of 38.00% from 2023 to 2030, reaching USD 1983.50 million in 2030.

In terms of enhanced oil recovery (EOR), which market category is in the lead?

Nanofluids for reservoir stimulation are the most popular category of enhanced oil recovery (EOR).

Which segment is leading the market regarding drilling fluids and wellbore stability?

Nanoparticle-based drilling fluids, by drilling fluids and wellbore stability, are the notable segment.

Nanotechnology Photocatalysis Surface Coating Market

Published:
Report ID: 63671

DNA Nanotechnology Market

Published:
Report ID: 56272

Healthcare Nanotechnology Market

Published:
Report ID: 22438

Nanotechnology Packaging Market

Published:
Report ID: 18045

Metal And Metal Oxide Nanoparticles Market

Published:
Report ID: 69994

Advanced Functional Materials Market

Published:
Report ID: 68578

Denmark Pharmaceutical Drug Delivery Market

Published:
Report ID: 67655

Colombia Pharmaceutical Drug Delivery Market

Published:
Report ID: 67291

Australia Pharmaceutical Drug Delivery Market

Published:
Report ID: 66447

Automotive Lead Acid Battery Market

Published:
Report ID: 70895

Non-Concentrating Solar Collectors Market

Published:
Report ID: 70606

Oil and Gas Data Management Software Market

Published:
Report ID: 69482

Energy Intelligence Solution Market

Published:
Report ID: 69084

Energy Portfolio Management Market

Published:
Report ID: 69057

Automotive Cabin Air Quality Sensors Market

Published:
Report ID: 3177

Bioliquid Heat and Power Generation Market

Published:
Report ID: 68917

Lithium Ion Battery Material Market

Published:
Report ID: 68433

Industrial Solar Water Heaters Market

Published:
Report ID: 67934

Fuel Cell for Stationary Power Market

Published:
Report ID: 67747

U.S. Portable Power Bank Market

Published:
Report ID: 66987

Gasoline Direct Injection (GDI) Market

Published:
Report ID: 67305

Purchase Options

The report comes as a view-only PDF document, optimized for individual clients. This version is recommended for personal digital use and does not allow printing.
$4699

To meet the needs of modern corporate teams, our report comes in two formats: a printable PDF and a data-rich Excel sheet. This package is optimized for internal analysis and multi-location access, making it an excellent choice for organizations with distributed workforce.
$5699

The report will be delivered in printable PDF format along with the report’s data Excel sheet. This license offers 100 Free Analyst hours where the client can utilize Credence Research Inc.’s research team. It is highly recommended for organizations seeking to execute short, customized research projects related to the scope of the purchased report.
$7699

Smallform of Sample request

Have a question?

User Profile

Don’t settle for less – trust Mitul to help you find the best solution.

Report delivery within 24 to 48 hours

– Other Info –

What people say?-

User Review

I am very impressed with the information in this report. The author clearly did their research when they came up with this product and it has already given me a lot of ideas.

Jana Schmidt
CEDAR CX Technologies

– Connect with us –

Phone

+91 6232 49 3207


support

24/7 Research Support


sales@credenceresearch.com

– Research Methodology –

Going beyond the basics: advanced techniques in research methodology

– Trusted By –

Pepshi, LG, Nestle
Motorola, Honeywell, Johnson and johnson
LG Chem, SIEMENS, Pfizer
Unilever, Samsonite, QIAGEN